


Gastric cancer (GC) is one of the most commonly diagnosed malignancies worldwide and the second leading cause of cancer-related deaths in China, with radical gastrectomy and lymphadenectomy as the mainstay treatment( Reference Torre, Bray and Siegel 1 – 3 ). Despite progress in multidisciplinary treatments, including surgery, chemotherapy and biologically targeted therapy, long-term survival remains poor in those individuals with advanced-stage GC( Reference Van Cutsem, Sagaert and Topal 4 ). The tumour–lymph node–metastasis (TNM) staging system, the most commonly used criteria to predict GC patients’ long-term outcomes, is based on postoperative pathological results( Reference Ji, Bu and Yan 5 ), effectively limiting such indices in terms of clinical preoperative decision-making and applicability. Moreover, we often encounter patients in whom the prognosis differs significantly from what is predicted according to the pathological TNM stage, stressing the need for research to understand better the biology of the disease and additional risk factors for relapse( Reference Lin, Lin and Cao 6 – Reference Ock, Nam and Lee 8 ).
There is a growing body of evidence that preoperative immunological and nutritional statuses are significantly related not only to postoperative morbidities but also to long-term survival of patients with various malignancies( Reference Lin, Lin and Cao 6 – Reference Geisler, Linnemeier and Thomas 12 ). The lymphocyte count and serum albumin concentration were the most commonly used indicators for defining the immunological and nutritional status, based on which several indices have been explored for various malignancies, including the neutrophil:lymphocyte ratio (NLR) and the prognostic nutritional index (PNI)( Reference Yang, Gao and Song 7 , Reference Chan, Chan and Wong 11 , Reference Sun, Wang and Liu 13 – Reference Liu, Qiu and Kong 15 ). Given that it has a shorter half-life and smaller body pool, prealbumin may serve as a more sensitive marker than albumin to assess the nutritional status of a patient( Reference Geisler, Linnemeier and Thomas 12 , Reference Devoto, Gallo and Marchello 16 , Reference Unal, Orhan and Eroglu 17 ). Recently, several studies have reported that prealbumin is a very strong prognosticator in patients with malignancies including lung and oesophageal cancer, and renal cell carcinoma( Reference Geisler, Linnemeier and Thomas 12 , Reference Kelly, Paulin and Lamont 18 – Reference Cai, Kong and Dong 20 ). However, whether the results would be the same in patients with GC has not been investigated in detail.
Therefore, we hypothesised that a novel predictive index based on the combination of serum prealbumin concentration and lymphocyte count (Co-PaL) score would be a better indicator for prognosis than other prognostic scores in patients who underwent radical gastrectomy for advanced GC. This question was addressed by conducting a retrospective study in patients with stage II/III GC using multivariate Cox regression analysis.
Methods
Design and patients
A total of 1749 consecutive patients undergoing operations for pathologically confirmed gastric adenocarcinoma between November 2010 and December 2015 in our hospital were reviewed. Exclusion criteria and the flow chart of the study are shown in Fig. 1. Chronic liver disease was diagnosed in patients with chronic viral hepatitis or cirrhosis, and kidney disease was delimited by an estimated glomerular filtration rate <60 ml/min per 1·73 m2 ( Reference Sakurai, Tamura and Toyokawa 21 ). The present study was conducted according to the guidelines laid down in the Declaration of Helsinki, and was approved by the ethics committee of the Affiliated Cancer Hospital of Xiangya School of Medicine, Central South University. Written informed consents were obtained from all participants.
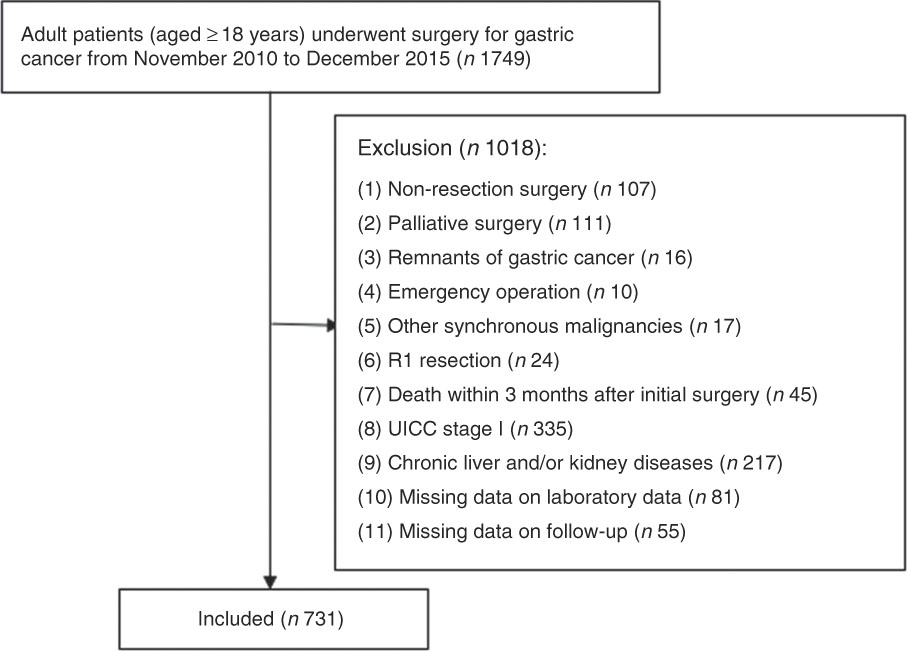
Fig. 1 Flow chart.
Perioperative management and follow-ups
All operations were performed or supervised by gastrointestinal surgeons with sufficient experience of D2 or D2+ radical gastrectomy. Lymphadenectomy and gastric reconstruction were determined according to the Japanese GC treatment guidelines( 3 ). The main surgical procedures and perioperative managements have been described in our previous study( Reference Xiao, Quan and Pan 22 ). Adjuvant chemotherapy was applied in a standard manner with fluorouracil- and platinum-based regimens (such as S-1 and oxaliplatin) within 6 months after surgery. A few patients with massive lymph node metastasis were given adjuvant concurrent chemoradiotherapy.
All of the patients were followed up at 1 month after surgery, and then at 3-monthly periods for the first 2 years, every 6 months between year 3 and year 5 and then at 12-monthly intervals. Patients who failed to attend their follow-up visit were sent an e-mail or letter and/or received a phone call. Follow-up of all the patients included in the present study was completed in December 2017. Physical examination and serum tumour markers were measured at each follow-up. Computed tomography scans and/or ultrasonography were carried out at 6-month intervals during the 5 years after surgery, and endoscopy was performed at 2-year intervals. MRI, positron emission tomography and/or biopsy was performed when recurrence or distant metastasis was suspected. Chemotherapy, chemoradiotherapy, molecular targeted drugs, traditional Chinese herbal drugs and conservative treatment, either alone or in combination, were the main treatments for those with tumour recurrence. Very few patients had the opportunity to undergo resection.
Data collection and outcomes
Data on patient demographics, co-morbidities, operative details and pathological results were obtained from medical records. The seventh edition of the Union for International Cancer Control on cancer staging system was used for grading the tumours( Reference Kwon 23 ).
Routine laboratory measurements, such as the serum concentration of albumin and prealbumin and leucocyte, neutrophil, monocyte, lymphocyte and platelet counts, were measured in all patients up to 7 d before surgery. The NLR was defined as the absolute neutrophil count divided by the absolute lymphocyte count. The PNI was calculated as follows: serum albumin value (g/l)+0·005×total lymphocyte count in the peripheral blood (per mm3). According to a previous study( Reference Sakurai, Tamura and Toyokawa 21 ), patients who had a PNI score >50 were considered to have good nutrition, those with a PNI score of 40–50 were considered to have mild to moderate malnutrition and those with a PNI score <40 were considered to have severe malnutrition.
The assessed primary outcomes were overall survival (OS) and disease-free survival (DFS). OS was measured from surgery to death from any cause or the last follow-up. DFS was measured from surgery to recurrence of the tumour, the last follow-up or the date when the patient died.
Definition of cut-off values
The X-tile program (3.6.1 software 20, http://medicine.yale.edu/lab/rimm/research/software.aspx) was used to determine the optimal cut-off values of serum albumin and prealbumin concentrations, lymphocyte, leucocyte, neutrophil, monocyte and platelet counts, and NLR for OS, as mentioned previously( Reference Lin, Lin and Cao 6 , Reference Camp, Dolled-Filhart and Rimm 24 ), whereas for other commonly quoted variables, such as BMI, anaemia and carcinoembryonic antigen, standard clinical thresholds were used as previously reported.
Statistical analysis
Statistical analyses were performed using the IBM SPSS version 24.0 software (IBM Corporation). Continuous data are presented as the means and standard deviations or medians and ranges, and comparisons were made on data that were normally distributed using the Student’s t test. All categorical variables were presented as percentages and numbers, and comparisons were made using a Fisher’s exact or χ 2 test. DFS and OS were calculated using the Kaplan–Meier method, and any differences were assessed by the long-rank test. All variables with a P-value ≤0·1 in the univariate analysis were entered into a multivariate Cox regression model, to reveal the independent risk factors influencing OS and DFS. A two-sided P-value <0·05 was considered to be statistically significant.
Results
Characteristics of patients
Overall, 1749 patients were identified, with 731 with stages II and III GC who satisfied the inclusion criteria (Fig. 1). The clinical, laboratory and pathological characteristics of the cohort of the 731 patients are listed in Table 1. In all, 67 % (n 492) of the patients were male and 33 % (n 239) were female, with an average of 54·55 (sd 10·96) years (range, 19–79) and 21·48 (sd 2·91) kg/m2 (range, 13·84–32·82) for age and BMI, respectively. On the basis of the seventh edition of the Union for International Cancer Control TNM staging system, there were 49 (6·7 %), 152 (20·8 %), 118 (16·1 %), 160 (21·9 %) and 252 (34·5 %) patients in stages IIA, IIB, IIIA, IIIB and IIIC, respectively. The majority of the patients (n 545, 74·6 %) received fluorouracil- and platinum-based adjuvant chemotherapy within 6 months of surgery, of whom twenty-nine (4·0 %) with massive lymph node metastasis received adjuvant concurrent chemoradiotherapy.
Table 1 Relationship between combination of serum prealbumin concentration and lymphocyte count (Co-PaL) scores and clinicopathologic characteristics of patients undergoing radical gastrectomy for stage II/III gastric cancer (n 731) (Numbers and percentages; mean values and standard deviations)
ASA, American Society of Anesthesiologists; TNM, tumour–lymph node–metastasis.
* Tumour stages are based on seventh edition of the Union for International Cancer Control TNM classification.
Cut-off values of variables
According to the X-tile program, the lymphocyte count, serum prealbumin and albumin concentrations cut-off values for OS were 1·5×109/litre, 180 mg/l and 33 g/l with maximum χ 2 long-rank values of 11·5 (P=0·02), 10·93 (P<0·01) and 7·65 (P=0·11), respectively (Fig. 2). Similarly, the optimal cut-off values of leucocyte, neutrophil, monocyte and platelet counts and NLR were 5·9×109/litre, 2·1×109/litre, 0·5×109/litre, 245×109/litre and 2·8, respectively (online Supplementary Fig. S1).
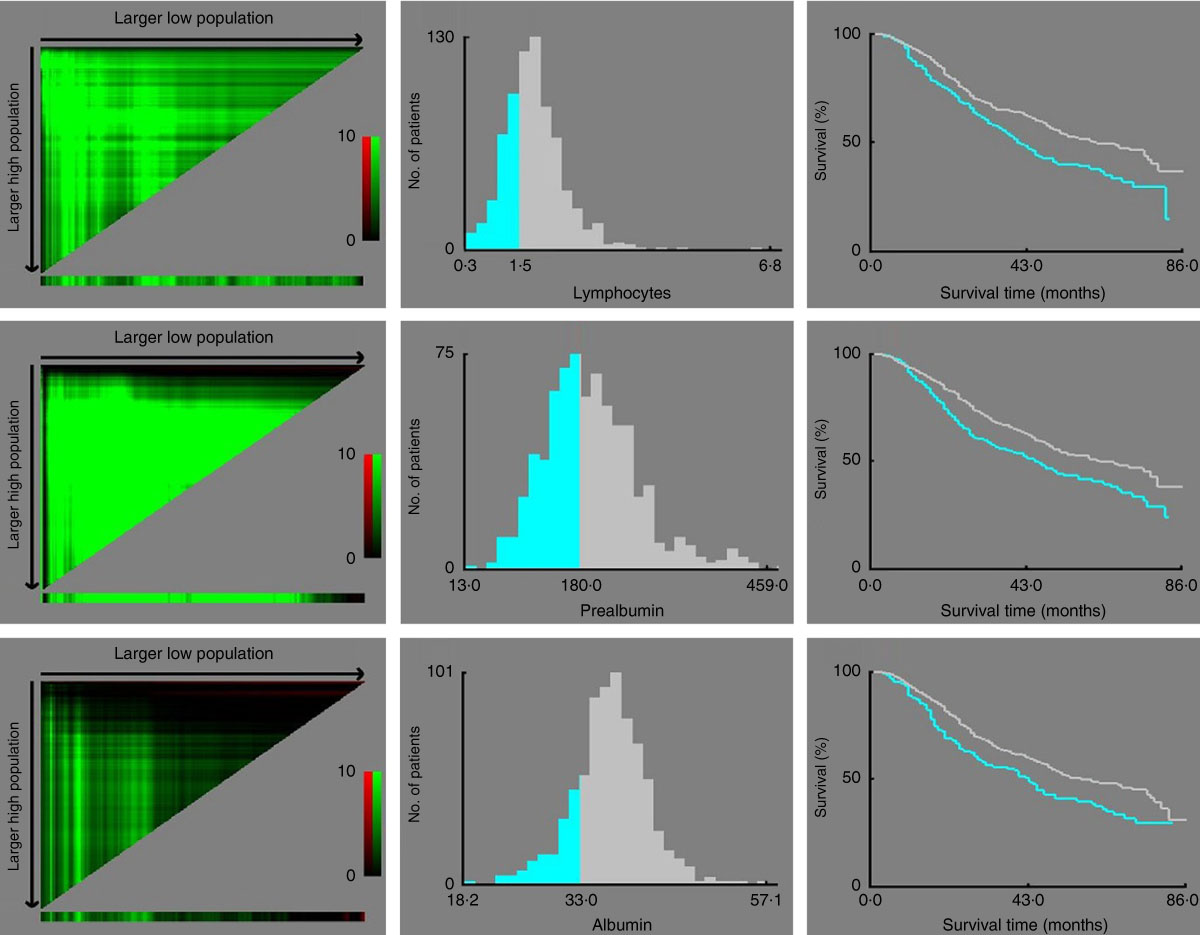
Fig. 2 X-tile analyses of overall survival performed using patients’ data to determine the optimal cut-off values for the lymphocyte count, serum prealbumin and albumin concentrations. In the left panels, the X-axis represents all potential cut-off values from low to high (left to right) that define a low subset, whereas the Y-axis represents the cut-off values from high to low (top to bottom) that define a high subset. Red coloration of a cut-off value indicates an inverse correlation with time to recurrence, and the green coloration represents direct associations. The optimal cut-off values highlighted by the black circles in the left panels are shown in the histograms of the entire cohort (middle panels). Kaplan–Meier plots are displayed in the right panels, where blue represents the low subgroup and grey represents the high subgroup. The optimal cut-off values for the lymphocyte count, serum prealbumin and albumin concentrations are 1·5×109/litre, 180 mg/l and 33 g/l, respectively.
Risk factors for survival
On the basis of univariate analysis and further multivariate Cox regression analysis to adjust for potential confounders (factors with a P-values ≤0·1 in univariate analysis), the following factors were clarified as negative independent prognosticators for OS: lymphocyte count <1·5×109/litre (hazard ratio (HR): 1·351, 95 % CI 1·082, 1·686, P=0·008), albumin <33 g/l (HR: 1·305, 95 % CI 1·008, 1·689, P=0·043), prealbumin <180 mg/l (HR: 1·362, 95 % CI 1·094, 1·695, P=0·006), serous invasion (T4) (HR: 2·499, 95 % CI 1·684, 3·706, P<0·001) and lymph node metastasis (HR: 2·089, 95 % CI 1·525, 2·863, P<0·001). No other variable such as being older, pretreatment anaemia or blood transfusion was identified as an independent predictor for a reduction of OS (Table 2).
Table 2 Univariate analysis (UV) and multivariate analysis (MV) of prognostic factors for overall survival (OS) after radical resection of stage II/III gastric cancer (n 731) (Numbers and percentages; medians and standard deviations; hazard ratios (HR) and 95 % confidence intervals)
ASA, American Society of Anesthesiologists.
* Defined as Hb concentration <120 g/l in males and <110 g/l in females.
† Tumour stages are based on seventh edition of the Union for International Cancer Control TNM classification.
‡ The specific median OS time is too long to be determined in this subgroup during the follow-up.
Similarly, a lymphocyte count <1·5×109/litre (HR: 1·323, 95 % CI 1·058, 1·655, P=0·014), prealbumin <180 mg/l (HR: 1·369, 95 % CI 1·099, 1·706, P=0·005), serous invasion (HR: 2·384, 95 % CI 1·617, 3·516, P<0·001) and lymph node metastasis (HR: 2·080, 95 % CI 1·517, 2·852, P<0·001) were identified as independent predictive factors for a decrease in DFS. Although patients with a decreased albumin concentration (<33 g/l) seemed to have a possible trend towards a poorer DFS, the difference slightly exceeded the traditional significance level (P=0·057) (Table 3).
Table 3 Univariate analysis (UV) and multivariate analysis (MV) of prognostic factors for disease-free survival (DFS) after radical resection of stage II/III gastric cancer (n 731) (Numbers and percentages; medians and standard deviations; hazard ratios (HR) and 95 % confidence intervals)
ASA, American Society of Anesthesiologists; TNM, tumour–lymph node–metastasis.
* Defined as Hb concentration <120 g/l in males and <110 g/l in females.
† Tumour stages are based on seventh edition of the Union for International Cancer Control TNM classification.
‡ The specific median disease-free survival time is too long to be determined in this subgroup during the follow-up.
Definition of combination of serum prealbumin concentration and lymphocyte count score
According to the results determined by multivariate Cox regression analysis, patients with a prealbumin concentration <180 mg/l and a lymphocyte count <1·5×109/litre were given a Co-PaL score of 2, indicating severe malnutrition. Patients with one of these conditions were given a Co-PaL score of 1, indicating mild to moderate malnutrition. Patients with neither of these conditions were given a Co-PaL score of 0, indicating good nutrition.
The Co-PaL score was 0 for 290 patients (39·7 %), 1 for 306 patients (41·9 %) and 2 for 135 patients (18·5 %), respectively. As shown in Table 1, patients with a greater Co-PaL score seemed to be older, with a smaller BMI, a greater American Society of Anesthesiologist score, lower Hb, albumin and prealbumin concentrations, more commonly needed a preoperative blood transfusion and had lower leucocyte, monocyte and lymphocyte counts. Although there was a tendency towards a higher rate of lymph node metastasis and stage III diseases in patients with greater Co-PaL scores, the difference did not reach a statistically significant level (all P>0·05).
Prognostic value of the combination of serum prealbumin concentration and lymphocyte count score
The median follow-up period in this study was 33 months (range, 3–86), with a median OS of 52 months. A total of 333 patients (45·6 %) died during the follow-up time, of whom 111 (38·3 %), 144 (47·1 %) and 78 (57·8 %) patients belonged to the Co-PaL score 0, 1 and 2 groups, respectively (P=0·001). Tumour recurrence was identified in 326 patients (44·6 %) in the entire cohort, with 112 (38·6 %), 138 (45·1 %) and 76 (56·3 %) patients in the PaL score 0, 1 and 2 groups, respectively (P=0·003).
The 1-, 3- and 5-year OS rates in the Co-PaL score 0 group were 93·6, 69·1 and 54·8 %, which were significantly greater than those in the Co-PaL score 1 group (90·8, 59·7 and 43·7 %, P=0·005), and those in the Co-PaL score 2 group (84·2, 51·3 and 36·2 %, P<0·001). Unsurprisingly, the OS rates in the Co-PaL score 1 group were statistically better than those in the Co-PaL score 2 group (P=0·039). The median OS time was 75·0, 48·0 and 38·0 months in the Co-PaL score 0, 1 and 2 groups, respectively (Fig. 3(a)).
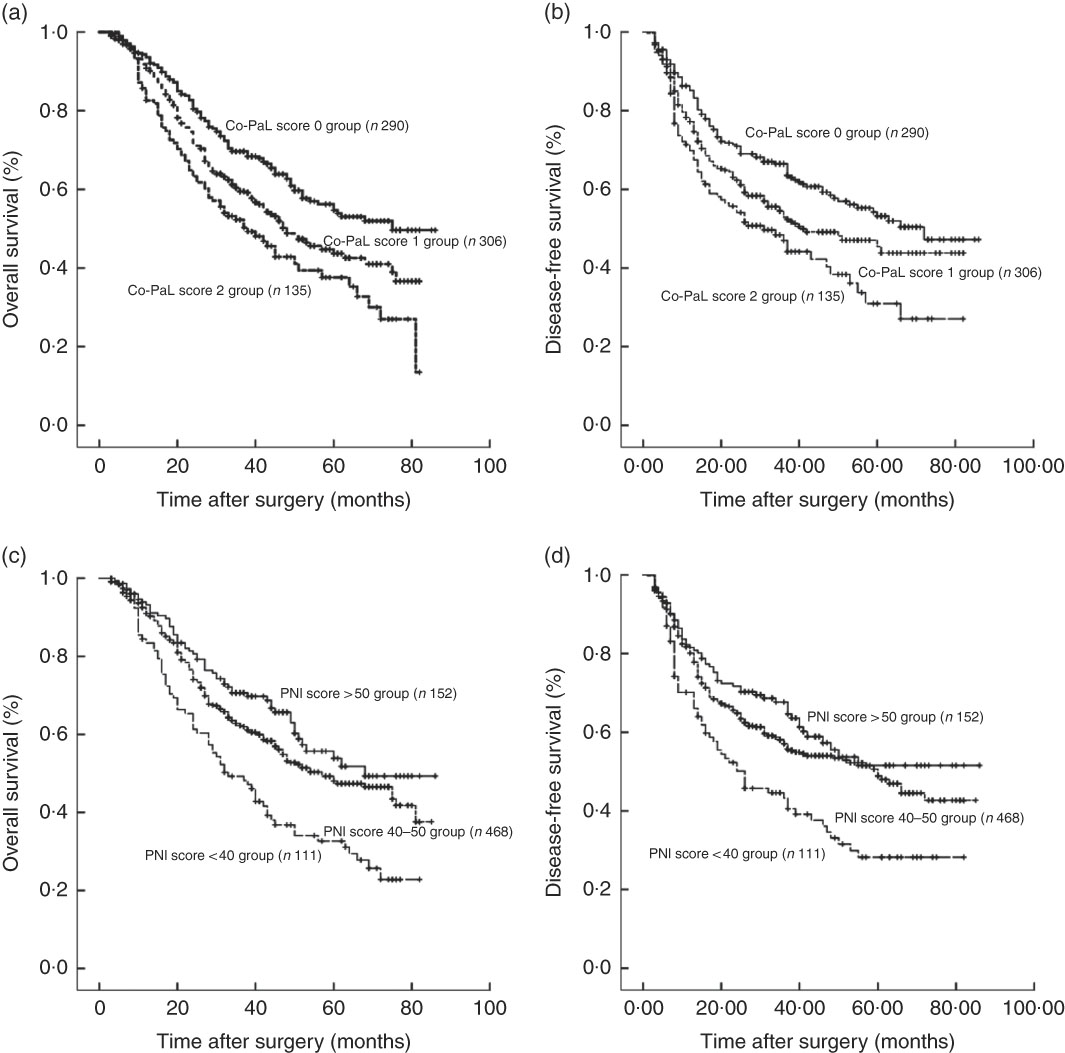
Fig. 3 Overall and disease-free survival curves in 731 patients who underwent gastrectomy for stage II/III gastric cancer. (a) Overall survival classified by a combination of the prealbumin concentration and lymphocyte count (Co-PaL) score. Co-PaL score 0 group v. 1 group, P=0·005; Co-PaL score 0 group v. 2 group, P<0·001; Co-PaL score 1 group v. 2 group, P=0·039. (b) Disease-free survival classified by the Co-PaL score. Co-PaL score 0 group v. 1 group, P=0·018; Co-PaL score 0 group v. 2 group, P<0·001; Co-PaL score 1 group v. 2 group, P=0·048. (c) Overall survival classified by the prognostic nutritional index (PNI). PNI score >50 group v. 40–50 group, P=0·107; PNI score >50 group v. <40 group, P<0·001; PNI score 40–50 group v. <40 group, P<0·001. (d) Disease-free survival classified by the PNI. PNI score >50 group v. 40–50 group, P=0·193; PNI score >50 group v. <40 group, P<0·001; PNI score 40–50 group v. <40 group, P=0·001.
The 1-, 3- and 5-year DFS rates in the Co-PaL score 0 group were 85·6, 65·1 and 53·2 %, which were significantly greater than those in the Co-PaL score 1 group (78·9, 53·4 and 42·1 %, P=0·018) and those in the Co-PaL score 2 group (70·5, 47·0 and 29·6 %, P<0·001). Similarly, the difference of DFS rates between the Co-PaL score 1 and 2 groups was statistically significant (P=0·048). The median DFS time was 72·0, 41·0 and 32·0 months in the Co-PaL score 0, 1 and 2 groups, respectively (Fig. 3(b)).
We further assessed the discriminatory ability of PNI. The 1-, 3- and 5-year OS rates in patients with good nutrition (PNI score >50, n 152) were 93·2, 70·2 and 53·8 %, which were significantly greater than those in patients with severe malnutrition (PNI score <40, n 111) (83·4, 48·7 and 31·9 %, P<0·001). Moreover, the 1-, 3- and 5-year OS rates in the mild to moderate malnutrition group (PNI score 40–50, n 468, 92·1, 62·3 and 49·2 %) were significantly greater than those in the severe malnutrition group (P<0·001). However, the differences of OS and DFS between the patients with good nutrition and those with mild to moderate malnutrition were not significantly different (P=0·107 and 0·193) (Fig. 3(c) and (d)).
Discussion
Although a number of studies have investigated the influence of pretreatment immunological and nutritional statuses on the oncological outcomes of GC patients after curative resection, increasing interest has been focused on the lymphocyte count, albumin and prealbumin concentrations. In addition, the PNI, based on the serum albumin concentration and lymphocyte count, reflecting both systemic inflammation and malnutrition, is considered to be the most reliable predictor of oncological survival( Reference Yang, Gao and Song 7 , Reference Chan, Chan and Wong 11 , Reference Sakurai, Tamura and Toyokawa 21 ). However, the conclusions are contradictory and even confusing in GC patients to date. Lee et al. ( Reference Lee, Kim and Kim 25 ) conducted an analysis of 7781 stage I to III patients and demonstrated that low PNI was a poor prognostic factor of OS, but not recurrence. PNI was also identified not to be associated with 5-year cancer-specific survival in elderly patients with GC in the research reported by Sakurai et al.( Reference Sakurai, Tamura and Toyokawa 21 ). A retrospective study of 1330 patients reported that low PNI was marginally associated with 5-year OS in patients with stage III GC, but the prognostic value was not significant in stages I and II disease( Reference Liu, Qiu and Kong 15 ), which contrasts with the results from another study of 594 patients( Reference Sakurai, Ohira and Tamura 14 ). There was also a meta-analysis that concluded that low PNI was significantly associated with a decreased OS in patients with GC at stage I to III, but not at stage IV( Reference Yang, Gao and Song 7 ). A feasible explanation for the conflicting results was the inconsistency in patient inclusion criteria. It seems difficult to determine the impact of pretreatment immunological and nutritional statuses on the long-term survival rates of patients having stage I GC, who experienced very low rates of severe malnutrition but had significantly better prognosis. In addition, patients with stage IV GC, who harboured widespread metastasis and experienced extremely disappointing survival times, are included in a number of the previous studies( Reference Yang, Gao and Song 7 ). In addition, patients with chronic liver and/or kindey diseases, such as liver cirrhosis, which may affect the immunological and nutritional status of the patients, were excluded from the present study, in order to minimise the impact of confounding factors. Moreover, the majority of the previous studies usually included a limited number of patients, and only few pretreatment immunological and nutritional variables were included in the prognostic analysis, which may affect the adequate accuracy, precision and statistical power of the model. Therefore, we evaluated the influence of pretreatment immunological and nutritional status on the oncological outcomes of a large cohort of 731 patients with pathologically diagnosed stage II/III GC from a single centre in China.
In this retrospective study, we identified that pretreatment decreased the lymphocyte count and that prealbumin and albumin concentrations were independently associated with decreased OS. In contrast to prealbumin, a statistical association was not found between albumin and DFS. Consequently, prealbumin levels are a more sensitive index of nutritional change and are better indicators of prognosis than albumin levels. Furthermore, the newly conducted prognostic index, Co-PaL score, had been clarified and it showed that it could accurately divide patients into low-, moderate- and high-risk subgroups. As a contrast, although the long-term survival was significantly worse in patients with severe malnutrition compared with those with good or mild to moderate malnutrition according to the PNI, the prognosis between the patients with good and mild to moderate malnutrition was not significantly different. Thus, it seems that the Co-PaL score is more sensitive in distinguishing patients with mild to moderate malnutrition from those with good nutrition compared with the widely used PNI. Compared with the postoperative pathological TNM stage, the Co-PaL score can be calculated easily from preoperative laboratory data and may well provide more definitive prognostic information for clinicians before surgery. Taken together, our results indicate that the complementary combination of the lymphocyte count and prealbumin concentration can be used as an independent indicator to predict the prognosis of patients who have undergone radical gastrectomy for locally advanced GC, and may facilitate preoperative treatment decision-making, including surgical procedure planning.
It is well accepted that inflammation plays an essential role in the prognosis of patients with malignancy. Possible explanations include that inflammatory responses can produce oxygen-free radicals and various inflammatory cytokines, which can stimulate tumour proliferation, progression and metastasis( Reference Sun, Wang and Liu 13 ). Accumulating evidence has indicated that systemic immune and inflammatory cells, including neutrophils, monocytes, lymphocytes and platelets, are related to the prognosis of various malignancies( Reference Lin, Lin and Cao 6 , Reference Ock, Nam and Lee 8 ). Several inflammation-based prognostic indexes have been identified to have a value in predicting long-term survival independently, such as NLR( Reference Ock, Nam and Lee 8 , Reference Wang, Chou and Strong 10 , Reference Sun, Wang and Liu 13 ). However, in the present study, only a decreased lymphocyte count was identified to be significantly associated with poor OS and DFS. Much research has emphasised that the lymphocyte is the crucial component of the host’s cellular adaptive immunity against cancers and can both attack malignant cells and eliminate the tumours. Thus, lymphocytopaenia indicates an insufficient immunologic reaction against the tumour and as a result adversely affects the prognosis of patients with cancer( Reference Hoffmann, Dworacki and Tsukihiro 26 , Reference Ray-Coquard, Cropet and Van Glabbeke 27 ).
Malnutrition is prevalent in patients with gastrointestinal cancer who undergo surgery as a result of unintentional weight loss related to their malignant disease process and its attendant anorexia and, in some cases, digestive tract obstruction( Reference Miner, Brennan and Jaques 28 ). There is growing evidence that nutritional status is significantly related to long-term outcomes of cancer( Reference Liu, Qiu and Kong 15 , Reference Kelly, Paulin and Lamont 18 – Reference Cai, Kong and Dong 20 ). Several reasons lie behind this association – for example, malnutrition impairs the immune system, suppresses cell-mediated immune function, which is crucial in defending cancer, and as a result leads to increased metastasis( Reference Xu, Zhong and Jing 29 ). Malnutrition can also produce postoperative complications, especially infections, thus activating systemic inflammatory responses and reducing the therapeutic efficacy of drugs( Reference Zhou, Hiki and Mine 9 , Reference Sun, Xu and Chen 30 ). Serum albumin and prealbumin concentrations are the most commonly used biochemical variables to define nutritional status.
Hypoalbuminaemia has been confirmed to be significantly associated with inflammation and adverse long-term outcomes in various malignancies( Reference Al-Shaiba, Mcmillan and Angerson 31 ). An albumin level <35 g/l and a metastatic lymph node ratio >0·2 were identified to be negative prognostic factors for resectable GC reported by Isik et al. ( Reference Isik, Okan and Firat 32 ), but only sixty-seven patients were included in their study. Several albumin-based prognostic indexes have been conducted to predict the prognosis of cancer such as the PNI and Glasgow prognostic score (GPS)( Reference Wakahara, Ueno and Maeda 33 ). Although PNI and GPS have been identified as promising indicators for prognosis in several types of malignancies, including GC, other scholars have argued that GPS or PNI is not sensitive enough to predict the prognosis in early-stage patients, whose nutritional status is relatively favourable( Reference Liu, Qiu and Kong 15 , Reference Wakahara, Ueno and Maeda 33 ). In the present study, although a low albumin concentration (<33 g/l) was confirmed to be a significant predictor for decreased OS, it lost its significance when considering DFS. Moreover, the prognosis of patients with good nutrition or mild to moderate malnutrition, which was classified by the PNI score based on albumin concentration and lymphocyte count, was not significantly different. The relatively insensitive albumin concentration for malnutrition might be responsible for these findings.
Prealbumin is a rapidly metabolised visceral protein with a half-life of about 2 d, which is significantly shorter than that of albumin (about 20 d)( Reference Zhou, Hiki and Mine 9 , Reference Unal, Orhan and Eroglu 17 ). Thus, the prealbumin concentration is closely associated with early changes in nutritional status and can be used to detect early nutritional deficits( Reference Bae, Lee and Han 34 ). In addition, the albumin concentration is strongly affected by age and inflammation compared with prealbumin( Reference Fan, Chi and Guo 35 ). Recently, prealbumin was identified as a useful marker not only for predicting morbidities but also for the prognosis of various malignancies such as lung and oesophageal cancer, and renal cell carcinoma( Reference Kelly, Paulin and Lamont 18 – Reference Cai, Kong and Dong 20 ). On the basis of the results of the present study, prealbumin appears to be a better indicator of prognosis and more sensitive to nutritional changes than albumin in patients with stage II/III GC. In addition, because prealbumin responds faster than albumin( Reference Davis, Sowa and Keim 36 ), we presume that if we can give proper nutritional support before an operation a low prealbumin concentration may serve as a modifiable risk factor for prognosis, although a large-scale prospective study will be needed in the future.
First, the retrospective nature and single-institution design of the current study is one of the possible limitations of our conclusions. Second, the median follow-up time (33 months) was relatively short and the median OS and DFS in several subgroups could not be determined. Third, only patients with stage II/III GC were included in the present study, and thus whether the results were the same in patients with stage I or IV GC requires further investigation. Last but not least, the present study sought to investigate predictors for prognosis among pretreatment patient characteristics. Thus, neither the surgical procedure nor the postoperative adjuvant therapy was included as a candidate independent risk factor in the analysis, both of which may be strongly associated with prognosis.
In conclusion, the results of our study confirm that the Co-PaL score, based on the pretreatment prealbumin concentration and lymphocyte count, is a useful and sensitive indicator for predicting the prognosis of patients who underwent gastrectomy for stage II/III GC. A higher Co-PaL score indicates poorer long-term survival. If feasible, proper nutrition support for patients with low prealbumin concentrations may be considered before an operation, although a prospective study will be needed to confirm this conjecture.
Acknowledgements
The authors gratefully acknowledge the contribution of the study participants, without whom the study would not have been possible.
This work was supported by the Natural Science Foundation of Hunan Province (no. 2018JJ6108). The funders had no role in the desisn, analysis or writing of this article.
Q. S. initiated the study, analysed data and wrote the original article. W. L., H. Q., S. P., S. L., T. Z. and Y. O. participated in the data collection and analysis, and provided advice on revising the paper. H. X. supervised all aspects of implementation of the paper and contributed to writing the article. All authors critically interpreted the findings and edited the article.
The authors declare that there are no conflicts of interest.
Supplementary material
For supplementary material/s referred to in this article, please visit https://doi.org/10.1017/S0007114518002854


