


Adequate nutrition during pregnancy is crucial for fetal development. The theory of the fetal origins of adult disease has renewed interest in nutrition during pregnancy. A study of survivors of the Dutch famine demonstrated that low birth weight due to maternal malnutrition increased infant susceptibility to CVD and type 2 diabetes in adulthood( Reference Alexander, Dasinger and Intapad 1 , Reference Barker 2 ). Among the nutrient groups assessed, proteins have emerged as an important factor related to birth weight.
Studies on protein intake during pregnancy suggested that while fulfilling the minimum protein requirement may help prevent fetal growth restriction, a higher protein intake may be more harmful than beneficial. A rodent model has repeatedly demonstrated that protein deprivation can hamper fetal growth( Reference Langley-Evans 3 – Reference Pinheiro, Pinheiro and Buratini 6 ) and cause permanent changes in the structure of tissues and organs and physiological functions in offspring( Reference Alexander, Dasinger and Intapad 1 , Reference Langley-Evans 3 , Reference Pinheiro, Pinheiro and Buratini 6 – Reference Godfrey, Robinson and Barker 8 ). In low- and middle-income countries, as well as in populations where malnutrition is common, protein supplementation has been shown to reduce the risk of low birth weight and small for gestational age (SGA) births( Reference Stevens, Buettner and Watt 9 – Reference Merialdi, Carroli and Villar 11 ). However, randomised interventional studies using supplementation with excessive protein (>20 % of energy as protein) have repeatedly shown that increased protein intake decreased fetal growth( Reference Sloan, Lederman and Leighton 12 , Reference Liberato, Singh and Mulholland 13 ), especially in high-income countries.
Based on evidence that both high and low protein intake may reduce fetal growth, current recommendations suggest a maternal dietary protein intake of 10–20 % of the total energy intake( Reference Rasmussen and Yaktine 14 ). However, the ‘optimal’ protein intake for pregnant women is unknown. The interventional studies on this topic have thus far been two-armed and therefore unsuitable for detailed calculation. Most previous epidemiological studies have proposed nothing more complex than a linear association between protein intake and birth outcomes with inconsistent results. We were able to find only two studies, one from New Zealand with 504 women( Reference Watson and McDonald 15 ) and another from Australia with 1040 women( Reference Andreasyan, Ponsonby and Dwyer 16 ), which suggested a non-linear relationship between maternal macronutrient intake and fetal growth. However, while both studies found that a quadratic model fit better than a linear model, the studies were relatively small and had insufficient power to produce conclusive results. Furthermore, most research on maternal macronutrients has focused on protein, and only a few studies have examined the importance of the other two macronutrients, that is, carbohydrates and fats.
Using data from a nationwide cohort study involving nearly 100 000 women and the cubic-spline model, we evaluated the association between maternal macronutrient intake and fetal growth.
Methods
Study sample
This study was based on data obtained from the Japan Environment and Children’s Study (JECS), a Japan-wide prospective cohort study of pregnant women, their spouses and their children( Reference Kawamoto, Nitta and Murata 17 , Reference Michikawa, Nitta and Nakayama 18 ). Pregnant women in any of the fifteen study regions throughout Japan were recruited from January 2011 to March 2014 either at their first antenatal visit at the participating, local health care institution or at a local government office issuing the so-called Mother and Child Health Handbook, a booklet issued to all expecting mothers in Japan enabling them to receive municipal health care services for their pregnancy, delivery and childcare. Women who were unable to participate in the survey or had difficulty filling out the questionnaire in Japanese were excluded. During pregnancy, the participants were asked to respond to two surveys covering demographics, life style, behaviour and medical history; one questionnaire was administered at recruitment (MT1) and the other was administered later during the pregnancy (MT2). Both surveys included a FFQ. Birth characteristics and medical information were collected separately from the medical records (Dr0m).
For this study, we used the dataset for birth outcomes ‘jecs-ag-20160424’, which was created in April 2016 and revised in October 2016. From the 104 102 births, we excluded multiple pregnancies, preterm deliveries before 28 weeks, post-term deliveries after 42 weeks, births with missing background characteristics and births from heavily obese women (BMI >35 kg/m2). In total 91 637 (90 %) subjects were enrolled (Fig. 1). Among these, 79 578 (87 %) underwent gestational weight gain measurement at 6–14 weeks and had answered the first FFQ (daily total energy intake of 2092–18828 kJ); 82 250 (89 %) underwent a gestational weight gain measurement at 20–28 weeks and had answered the second FFQ (daily total energy intake of 2092–18828 kJ).
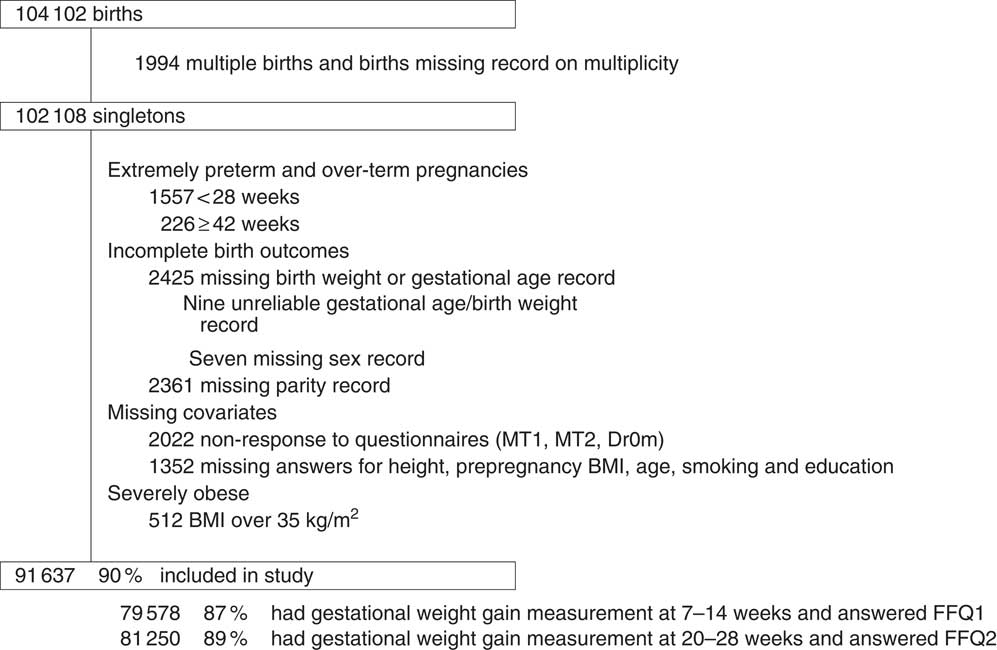
Fig. 1 Population flow chart.
FFQ
Our FFQ, listing 172 food and beverage item, asked about respondents’ habitual consumption of the listed food items using three portion sizes and nine frequency categories( Reference Yokoyama, Takachi and Ishihara 19 ). The FFQ has been previously validated using 3-d dietary records and blood samples( Reference Sasaki, Ishihara and Tsugane 20 , Reference Tsugane, Kobayashi and Sasaki 21 ) in adults, but not specifically in pregnant women. The intake of energy was calculated by food group using a food composition table developed for the FFQ based on the Standardized Tables of Food Composition developed in Japan (2010 edition). The first FFQ (FFQ1) was administered during early pregnancy and asked about respondents’ diet over the past year while the second FFQ (FFQ2) was administered during mid pregnancy and asked about respondents’ diet during pregnancy (from conception to the answering date).
Protein, fat and carbohydrate density was calculated as a percentage of the energy intake from that nutrient; for example, protein density was calculated using the formula: (protein intake (g) reported in FFQ×4 (kJ/g)/energy intake (kJ) reported in FFQ).
Demographic data
Maternal socio-demographic data collected from the responses to the second questionnaire were categorised by annual household income (<2 million yen, 2–4 million yen, 4–6 million yen, 6–8 million yen, >8 million yen and no answer); maternal education (university education or higher, 2-year college, vocational school, high school or lower) and smoking status (never smoked, previously smoked but stopped before pregnancy, previously smoked but stopped because of pregnancy and current smoker). Pre-pregnancy BMI was calculated from height and pre-pregnancy weight (either self-reported or measured) and categorised as under 18·5, 18·5–25 or 25 kg/m2 or higher. Weight measurements at the antenatal check-up visit at 7–14 and 20–28 weeks were collected from the Mother-Child Health Handbook and used to calculate gestational weight gain during early and mid-pregnancy.
Other baseline characteristics retrieved from the medical records were maternal age (<25, 25–34, ≥35 kg/m2) and parity (0, 1 or more). Data on birth outcomes (gestational age and birth weight) were also obtained from the medical records. SGA was defined as a birth weight below the tenth percentile of the normal population at each day of gestation and was stratified by sex and parity using the Japanese birth weight reference chart( Reference Uehara, Miura and Itabashi 22 ). The same chart was used to calculate the birth weight z-score for each infant.
Ethics
The JECS protocol was approved by the review board for epidemiological studies of the Ministry of the Environment and by the Ethics Committees of all the participating institutions. The JECS protocol was conducted in accordance with the Helsinki Declaration and other nationally valid regulations, and written informed consent was obtained from each participant.
Statistics
We calculated the average birth weight and proportion of SGA of infants based on the characteristics of the study population and the average dietary profile of the respondents to the two FFQ.
Next, we used the cubic spline model to analyse the association between maternal macronutrient intake and birth outcomes, namely, birth weight and risk of SGA. In the restricted cubic spline, all data points are used to estimate the dose–response association between the continuous independent variable and the outcome, thus allowing non-linear associations. The OR (for SGA) and change in birth weight, as well as their accompanying 95 % CI, were calculated with four knots placed at the 5th, 50th, 85th and 95th percentiles of the density of each macronutrient.
As our primary exposure of interest was maternal protein intake, our main analysis focused on the association of protein density in the maternal diet as assessed by FFQ1 (of the pre-pregnancy period to the first trimester) with birth weight and the risk of SGA. To evaluate the effect of protein relative to other macronutrients in an isoenergetic diet, a substitution model using the multivariate nutrient density method was employed( Reference Willett, Howe and Kushi 23 ).
Next, we created a model in which both energy and protein density were constant in order to observe the association between carbohydrate density and fetal growth when isoenergetic replacement was with fat, and conversely the association between fat density and fetal growth when isoenergetic replacement was with carbohydrates.
Due to the possibility that some women may have modified their diet after becoming pregnant, we conducted a sensitivity analysis using the maternal diet as assessed in FFQ2 (covering diet from conception to the second trimester).
Maternal age, parity, education, income, prepregnancy BMI, height, smoking status and infant sex were treated as potential confounders in all our analyses, and adjustments were made for recruitment site, total energy intake as reported in the FFQ, and gestational weight gain and age at the time of the survey (which also reflected energy intake and contained fewer measurement errors than the total energy value reported in the FFQ).
All statistical analyses were conducted using the statistical software package Stata 13 (Stata Corp). A P-value <0·05 was considered to be statistically significant when performing hypothesis tests. The spline curve was constructed using the ‘mkspline’ command in STATA. As this was a secondary analysis of a large cohort study, sample size calculation was not conducted before analysis.
Results
Table 1 shows the birth outcomes according to the characteristics of the study population. The average birth weight was 3028 (sd 406) g, and 6350 (6·9 %) births were SGA. The proportion of SGA births was highest among women who were shorter, thinner or continued to smoke during pregnancy. The proportion of SGA births was also higher among women from a lower income or educational level, older women, primiparae and women with low gestational weight gain until 20–28 weeks.
Table 1 Birth weight and fetal growth by characteristic (n 91 637) (Numbers and percentages; mean values and standard deviations)
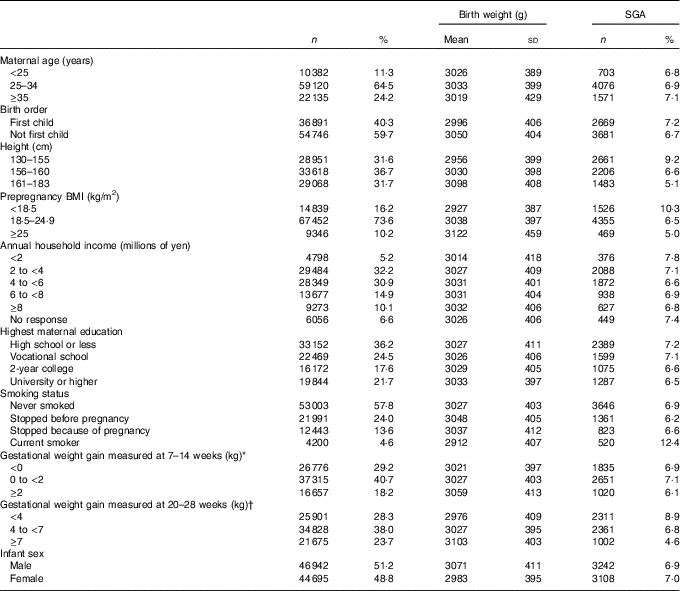
SGA, small for gestational age.
* Among 80 748 with weight measurement at 7–14 weeks.
† Among 82 404 with weight measurement at 20–28 weeks.
Table 2 shows the nutritional characteristics. The mean daily energy intake and percentage energy from protein, fats and carbohydrates were 1787 (7477 (sd 2577) kJ and 13·5 (sd 2·0), 29·5 (sd 6·5) and 55·3 (sd 7·8) %, respectively, for FFQ1, and 7184 (sd 2506) kJ and 13·6 (sd 2·1), 29·8 (sd 6·6) and 55·3 (sd 7·9) %, respectively, for FFQ2. The mean gestational weight gain for measurements when the two questionnaire were answered were 0·5 (sd 2·0) and 11·1 (sd 1·6) kg, respectively.
Table 2 Dietary profile of pregnant women during pregnancy (Mean values and standard deviations)
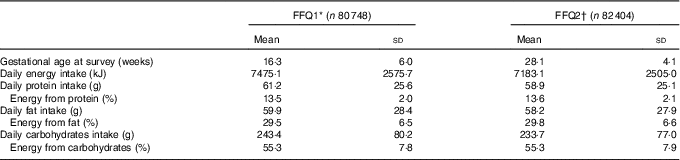
* FFQ1 was administered during early pregnancy and asked about respondents’ diet over the previous year.
† FFQ2 was administered during mid pregnancy and asked about the respondents’ diet during pregnancy.
The cubic-spline model demonstrated a dose–response relationship between maternal protein density as reported in FFQ2 and birth outcomes after adjusting for maternal characteristics and energy intake. The accompanying histograms showing the distribution of protein density are shown in Fig. 2 (for birth weight) and Fig. 3 (for risk of SGA). The reference level of the spline models was set at a protein density of 12 %. Fig. 2 shows that birth weight was highest when percentage energy from protein was 12 %, regardless of whether isoenergetic replacement was with fat or carbohydrates. Women whose diet contained a protein density above 14 % showed a significantly lower birth weight than those whose protein density was 12 %. Similarly, Fig. 3 shows a U-curve relationship between protein density and the risk of SGA; the latter was lowest when percentage energy from protein was 12 %, regardless of whether isoenergetic replacement was with fat or carbohydrates. Women whose diet contained a protein density above 15 % showed a significantly higher risk of SGA compared with those whose protein density was 12 %. The shape of the association between dietary protein density and birth outcomes was similar to that of the maternal diet as assessed in FFQ1 (online Supplementary Appendix S1).
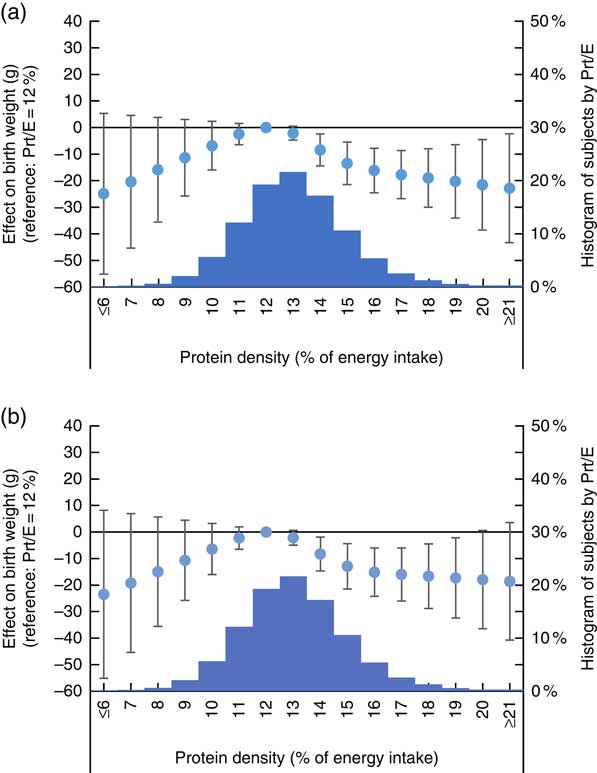
Fig. 2 Association between dietary protein density as assessed in FFQ1 and birth weight. (a) Analysis with isoenergetic replacement of protein with carbohydrate. (b) Analysis with isoenergetic replacement of protein with fat. Prt/E, protein energy percentage. Histogram displays number of subjects by dietary protein density as assessed in FFQ1. Estimated difference in birth weight compared with women who had highest birth weight is shown in circle, with associated 95 % CI shown as whiskers.
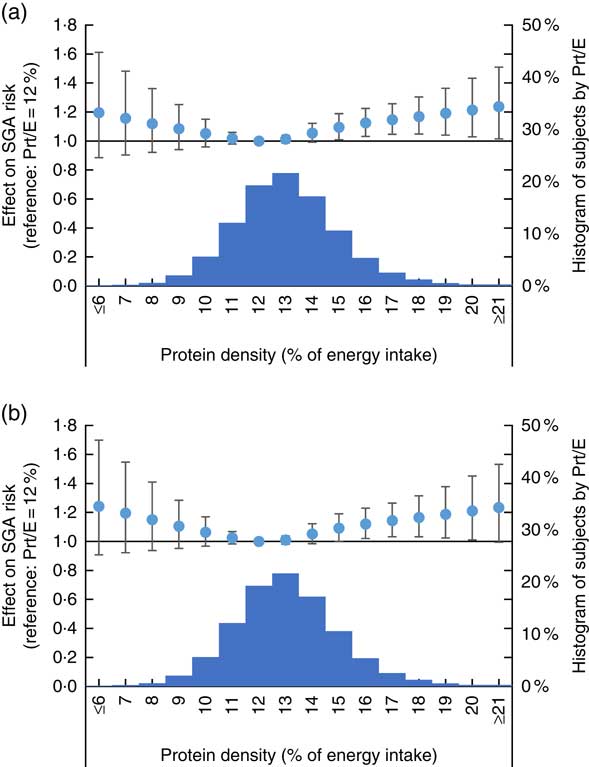
Fig. 3 Association between dietary protein density as assessed in FFQ1 and risk of small for gestational age (SGA) birth. (a) Analysis with isoenergetic replacement of protein with carbohydrate. (b) Analysis with isoenergetic replacement of protein with fat. Prt/E, protein energy percentage. Histogram displays number of subjects by dietary protein density as assessed in FFQ1. Estimated OR of SGA compared with women who had lowest risk of SGA is shown in circle, with associated 95 % CI shown as whiskers.
Fig. 4(a) shows the association between dietary carbohydrate density with birth weight while Fig. 4(b) shows the association between dietary fat density with birth weight. The accompanying histograms show the macronutrient density distribution for each nutrient. All models were adjusted for maternal characteristics, energy intake and protein intake. Fig. 4(a) shows that women whose diet had fat density of 25 % had highest birth weight, with women whose diet had fat density over 35 % having significantly lower birth weight. Fig. 4(b) shows that women whose diet contained a carbohydrate density of 59 % had highest birth weight, with women whose diet had carbohydrate density below 47 % having significantly lower birth weight. On the other hand, no significant difference in birth weight by carbohydrate or fat density of the diet was observed for FFQ2 (online Supplementary Appendix S2).

Fig. 4 Association between dietary fat and carbohydrate density as assessed in FFQ1 and birth weight. (a) Analysis with isoenergetic replacement of fat with carbohydrate. (b) Analysis with isoenergetic replacement of carbohydrate with fat. Fat/E, fat energy percentage; carbohydrate/E, carbohydrate energy percentage. Histogram displays number of subjects by dietary protein density as assessed in FFQ1. Estimated difference in birth weight compared with women who had highest birth weight is shown in circle, with associated 95 % CI shown as whiskers.
For both questionnaires, 12 % remained the protein density with highest birth weight in crude analysis not adjusting for possible confounders, and after excluding 2949 women who were diagnosed who developed gestational diabetes during pregnancy (results not shown).
Discussion
Among Japanese women, the association between protein intake and risk of fetal growth restriction described a U-shaped curve, suggesting that both high and low protein intake can increase its risk. Our study demonstrated that fetal growth peaked when protein density in the maternal diet was 12 %. This association was consistent for dietary reporting both in early pregnancy (covering diet over the past year) and in mid-pregnancy (covering diet during pregnancy). We also found that when protein intake was constant, birth weight decreased if <29 % of the energy intake derived from fat or more than 59 % derived from carbohydrates.
Most previous epidemiological studies have failed to consider anything more complex than a linear association between protein intake and birth outcomes. Their findings were also inconclusive. Studies conducted in the UK( Reference Godfrey, Robinson and Barker 8 ), Australia( Reference Andreasyan, Ponsonby and Dwyer 16 , Reference Moore, Davies and Willson 24 ) and Spain( Reference Cuco, Arija and Iranzo 25 ) reported that higher protein density in the maternal diet was associated with a linear increase in birth weight; however, studies in the USA demonstrated that a higher protein intake was associated with reduced fetal growth( Reference Sloan, Lederman and Leighton 12 , Reference Liberato, Singh and Mulholland 13 , Reference Switkowski, Jacques and Must 26 ). Other studies( Reference Haste, Brooke and Anderson 27 – Reference Petridou, Stoikidou and Diamantopoulou 30 ) failed to find any significant linear association. The present study suggests that the relationship is not linear but U-shaped; hence the discrepancies with previous studies may have resulted in part from differences in the mean protein intake in the population (e.g., women in the USA generally have a high protein intake)( Reference Switkowski, Jacques and Must 26 ). Such interpretations have been proposed in smaller studies( Reference Sloan, Lederman and Leighton 12 , Reference Watson and McDonald 15 ) but have not been confirmed.
We believe our study is the first to calculate the optimal protein density for the maternal diet during pregnancy. The cubic-spline model and a sufficient sample size allowed us to express the association between protein intake and fetal growth in a nonlinear fashion. We found that while an increase in protein density up to 12 % was associated with increased fetal growth and reduced SGA, any further increase in protein density significantly reduced fetal growth. Our findings did not conflict with those of interventional studies showing that while balanced protein supplementation (10–20 % of energy as protein) promoted fetal growth, especially in malnourished populations( Reference Stevens, Buettner and Watt 9 – Reference Merialdi, Carroli and Villar 11 , Reference Ota, Hori and Mori 31 ), supplementation with excessive protein (>20 % of energy as protein) decreased fetal growth, especially in populations with a diet already high in protein density( Reference Sloan, Lederman and Leighton 12 , Reference Liberato, Singh and Mulholland 13 ). Our results further suggested that the protein requirement was quite low, as we found that women who reported a diet containing a protein density of 14 % in early pregnancy had a significantly lower birth weight and birth weight z-score than those who reported a protein density of 12 %.
Few studies have examined the influence of maternal carbohydrate and fat intake, compared with that of protein, on fetal growth. A cohort study in the UK found that low carbohydrate intake in early pregnancy was associated with lower methylation levels in DNA sequences regulating an imprinted gene associated with fetal growth but failed to find any association with birth weight( Reference Godfrey, Sheppard and Gluckman 32 ). Animal studies showed that a high maternal fat intake may increase adult body weight( Reference Ribaroff, Wastnedge and Drake 33 ); however, studies of birth weight have produced inconsistent findings( Reference Ribaroff, Wastnedge and Drake 33 ) as seen, for instance, in the conflicting reports of increased birth weight in mice( Reference Giraudo, Della-Fera and Proctor 34 ) and reduced birth weight in rats( Reference Cunha Fda, Dalle Molle and Portella 35 , Reference Howie, Sloboda and Kamal 36 ). Our study demonstrated that lower fat and higher carbohydrate density in early-pregnancy significantly decreased risk of fetal growth. However, as these findings lack the support of previous epidemiological or experimental studies, the general validity of these findings needs to be weighed against the results of future studies.
Strengths and limitations
The chief strength of our study is its large subject pool, which enabled us to examine the non-linear relationship between nutritional intake and birth outcomes. In addition, assessment of nutritional status was conducted twice during pregnancy, with the replication of the results providing greater reassurance of their reliability. However, there are several limitations. First, dietary assessments conducted during early pregnancy covered the previous year, which included the prepregnancy period in addition to early pregnancy. However, previous studies on the replication of nutritional assessment have shown that while absolute intake may change from prepregnancy to pregnancy (due to morning sickness)( Reference Ogawa, Jwa and Kobayashi 37 ) and the intake of certain micronutrients (such as folate) may change due to antenatal education, overall dietary preferences do not change( Reference Rifas-Shiman, Rich-Edwards and Willett 38 ). Second, the reported total energy intake later in pregnancy (mean: 7184 kJ/d) was lower than in early pregnancy (7477 kJ/d), suggesting the possibility that women under-reported their energetic intake later in pregnancy possibly out of concern for social norms( Reference Ogawa, Morisaki and Sago 39 ) or reduced their intake in compliance with the strict national gestational guidelines( Reference Tsukamoto, Fukuoka and Inoue 40 ), which discourage excessive energetic intake during pregnancy. However, the adjustment for total energy intake in our analyses, the absence of any discernible reason for under-reporting macronutrient consumption disproportionately, the consistency of the association between macronutrient intake and fetal growth in the two FFQ, all suggest that this problem may not have had a significant influence on our results. Third, the association between macronutrients and the outcomes may have been affected by the intake of micro-nutrients correlating with the intake of macronutrients. However, the evidence from previous epidemiological and interventional studies using protein was consistent with our results. Similarly, while we cannot deny the fact there may be residual confounding due to unmeasured confounders, the stableness of the estimates which did not change much from the crude analysis to the adjusted analysis, as well as after excluding women with gestational diabetes suggest our results are likely to be robust. We thus believe that our interpretation of the inverse U-curve relationship of maternal dietary protein density with fetal growth is valid. Fourth, our sample population was limited to Japanese women, who generally have a different dietary culture than their Western counterparts and also eat less on the whole. Recent statistics (2010–2011) from the Japan National Health and Nutrition Survey based on 3-d dietary records( Reference Ikeda, Takimoto and Imai 41 ) show that consumption of both protein and total energy among pregnant women is very low( Reference Takimoto, Yoshiike and Katagiri 42 ), with an average pregnant woman eating only 6966 (sd 1845) kJ/d with a protein density of 13·8 (sd 4·3) %, comparable to what we found in our population (7184 (sd 2506) kJ/d and 13·6 (sd 2·1) %, respectively). Therefore, while our findings on the association between macronutrients and fetal growth is likely generalisable to the Japanese population or other populations with generally low energy intake, they may not be directly applicable to those who have a higher energy. Ideally, studies similar to the present one would be conducted in populations with different dietary cultures. Finally, while our study was able to calculate the ‘optimal’ ratio of the three nutrients to reduce risk of fetal growth restriction, it is much too early to interpret this as the ‘optimal’ maternal diet. The observed effect of protein intake on birth weight in this study is 10–20 g and quite small, thus if a different and more important outcome shows a different pattern with protein intake, such findings also need to be incorporated when deciding on what the true nutritional requirement is. Our study focused only on birth outcomes as the long-term outcomes of the cohort participants are not yet available, and mainly on fetal growth restriction as other birth outcomes such as neonatal deaths (<0·1 %), stillbirths (0·3 %) or macrosomia (0·6 % had birth weight over 4 kg) were extremely rare in the Japanese population. Future rigorous research using adequate databases should be conducted to estimate the influence of maternal nutrition on multiple outcomes, to provide the full picture of nutritional recommendations during pregnancy.
Conclusion
In conclusion, we found that protein intake from conception to the second trimester showed an inverse U-curve relationship with fetal growth. Our results strongly suggest that the association between protein intake and birth weight is nonlinear, and that a balanced diet fulfilling the minimum requirement for all macronutrients is ideal for avoiding fetal growth restriction.
Acknowledgements
The authors would like to express their gratitude to all the participants in this study and all the individuals involved in data collection. The authors would also like to thank the following members of the JECS (principal investigator, T. K.) as of 2017: Hirohisa Saito (National Center for Child Health and Development, Tokyo, Japan), Reiko Kishi (Hokkaido University, Sapporo, Japan), Nobuo Yaegashi (Tohoku University, Sendai, Japan), Koichi Hashimoto (Fukushima Medical University, Fukushima, Japan), Chisato Mori (Chiba University, Chiba, Japan), Shuichi Ito (Yokohama City University, Yokohama, Japan), Zentaro Yamagata (University of Yamanashi, Chuo, Japan), Hidekuni Inadera (University of Toyama, Toyama, Japan), Michihiro Kamijima (Nagoya City University, Nagoya, Japan), Takeo Nakayama (Kyoto University, Kyoto, Japan), Hiroyasu Iso (Osaka University, Suita, Japan), Masayuki Shima (Hyogo College of Medicine, Nishinomiya, Japan), Yasuaki Hirooka (Tottori University, Yonago, Japan), Narufumi Suganuma (Kochi University, Nankoku, Japan), K. K. (University of Occupational and Environmental Health, Kitakyushu, Japan) and Takahiko Katoh (Kumamoto University, Kumamoto, Japan).
JECS was funded by the Japanese Ministry of the Environment. The findings and conclusions of this article are solely the responsibility of the authors and do not represent the official views of the above government. This article was supported in part by the Grant-in-Aid for Young Scientists from the Japan Society for the Promotion of Science (26870889) to N. M. The funding bodies had no role in the design of the study, collection and analysis of data, interpretation of the results, writing of the manuscript or the decision to publish.
S. Y. and N. M. initiated the idea; N. M. designed the study; the JECS study group collected the data; N. M. analysed the data, wrote the paper and had primary responsibility for the final content. K. Kato, M. S., E. S., M. T., A. S., T. K. and K. Kusuhara critically reviewed the draft and provided important intellectual content to the interpretation of the results. All the authors have read and approved the final manuscript.
The authors declare that there are no conflicts of interest.
Supplementary material
For supplementary material/s referred to in this article, please visit https://doi.org/10.1017/S000711451800291X


