


Introduction
Acute respiratory infections caused by respiratory syncytial virus (RSV) have a significant impact on global health and in 2015 resulted in an estimated 3.2 million hospital admissions and 59600 in-hospital deaths in children aged <5 years [Reference Shi1]. Factors placing infants at high-risk of severe RSV respiratory infections include preterm birth, underlying chronic cardiopulmonary disorders, young age and being born shortly before an RSV outbreak [Reference Murray2–Reference Grimwood4]. In Australia, population age-adjusted incidence rates for RSV-related hospitalsations are estimated as 8.7–17.4 per 1000 for infants in the first year of life, and 2.2–4.5 per 1000 for children aged <5 years [Reference Ranmuthugala, Brown and Lidbury5, Reference Dede6]. Higher rates of 29.6 per 1000 are reported in Aboriginal and Torres Strait Islander children <2 years of age [Reference Dede6]. RSV infections consequently generate a significant economic burden with direct healthcare costs in Australia estimated at least $24 million in 2005 [Reference Ranmuthugala, Brown and Lidbury5].
Worldwide there are growing data defining seasonal epidemics of RSV in relation to geographic location and climate [Reference Yusuf7–Reference Tang and Loh9]. Annual RSV epidemics demonstrate clear seasonality in countries with temperate climates by occurring regularly in the cooler, winter months [Reference Yusuf7, Reference Vandini10]. In contrast, RSV can circulate all year-round in the tropics with peaks in the summer and early autumn [Reference Paynter11]. Seasonal peaks in Australia are seen in early autumn (March–May) in tropical regions, winter months (June–August) in temperate climates and year-round activity with autumn and winter peaks in arid settings [Reference Dede6, Reference Paynter12–Reference Fagan, McLeod and Baird15]. Data are lacking for other climatic zones within Australia, as well as for many other countries in the Southern Hemisphere, including subtropical, grassland, desert and equatorial regions.
Evidence is emerging that meteorological conditions, particularly humidity, rainfall and cooler temperatures, may influence these seasonal RSV epidemics [Reference Tang and Loh9]. RSV is transmitted by respiratory secretions, either through direct contact, including by short-range large respiratory droplets, or indirectly via fomites [Reference Treanor, Richman, Whitley and Hayden16]. One possibility is that more humid environments, such as tropical climates, may influence virus transmission by allowing heavy droplets to accumulate on surfaces and encouraging virus survival on surfaces by slowing the rate of evaporation [Reference Paynter17]. In contrast, laboratory studies have shown that lipid enveloped viruses, such as RSV, survive longer when ambient temperatures are low [Reference Hambling18]. It is also possible that weather patterns may facilitate RSV transmission by altering behaviour and living habits. This includes people crowding indoors during cold or wet weather, and air conditioning or dry air that can impair mucociliary clearance, each of which may have an impact on the epidemics seen at these times.
Identifying RSV seasonality is important for determining when to administer monthly intramuscular doses of palivizumab, a monoclonal antibody, which is used as prophylaxis to prevent RSV infection in high-risk preterm infants with chronic neonatal lung disease or infants with severe congenital heart abnormalities. While there is no Australian consensus on when to use palivizumab, updated recommendations from the American Academy of Pediatrics are to take local epidemiological data into consideration [19]. In addition, understanding RSV seasonality is important for informing healthcare infection control measures, hospital bed and staff planning, visitor information and guiding future public health interventions, such as maternal immunisation with RSV vaccines.
The aims of this study were to: (i) review the seasonal variation in RSV-positive emergency department (ED) and hospital presentations among infants and young children aged <5 years in an Australian subtropical city, and (ii) to assess meteorological factors and tourist incursions as potential drivers of this seasonality.
Methods
Sampling frame and data sources
The Gold Coast Hospital and Health Service is the sole publically funded health service in the Gold Coast region of South East Queensland, covering a geographic area of 1855 km2. In 2014, it had an estimated population of 560 266 residents with approximately 6% being children aged <5 years [20]. It is a major tourist destination attracting 4.7 million overnight visitors in the 2015–2016 financial year.
The Gold Coast (latitude 28.0°S, longitude 153.4°E) has a subtropical climate with a Köppen classification of Cfa, meaning it has hot, humid summers and mild winters [21]. The average monthly minimum and maximum temperature ranges are 12.0–21.9 and 21.2–28.8°C, respectively, and the average annual rainfall is 1273.5 mm. The wettest, hottest and most humid months are in summer (December–February).
The study period was between 1 July 2007 and 30 June 2016. During this time it was recommended by the Gold Coast Hospital and Health Service that all children presenting to the ED or admitted to hospital with an acute respiratory infection should have a nasal swab specimen collected to test for respiratory viruses, including RSV. These swabs were submitted to the publically funded Pathology Queensland Gold Coast Laboratory where they underwent nucleic acid amplification tests using an in-house multiplex polymerase chain reaction (PCR) assay. A rapid antigen test (Alere BinaxNOW® RSV Card, Alere, Waltham) was available if a time critical test was requested, although this was used infrequently.
The total number of nasal swabs submitted for testing and the positive test results for RSV in children aged <5 years in this period were identified from the Pathology Queensland Gold Coast Laboratory database. Repeat RSV samples from the same patient were excluded if they occurred within 2 weeks of one another, as these were considered to be within the same period of infection.
The Gold Coast Hospital and Health Service patient databases were interrogated to obtain the total number of ED presentations in children aged <5 years for the study period. In addition, demographic data, including the date of birth, test date, age at time of test, sex, residential postcode, and Aboriginal and Torres Strait Islander status for each child aged <5 years with a positive RSV test were extracted from these databases.
Meteorological data from the Australian Bureau of Meteorology Gold Coast Seaway weather station (station number 040764, latitude 27.9°S, longitude 153.4°E) were obtained for each day of the study period, aggregated weekly and presented as mean of exposure for each week. Data obtained included daily minimum and maximum temperatures, rainfall, average daily relative humidity, average daily dew point and daily global solar exposure, which is a measure of solar energy.
Gold Coast tourism data from Tourism and Events Queensland were obtained for the study period (personal communication). Data were available as a quarterly aggregate of overnight stays for people aged ⩾15 years.
Data analysis
An initial descriptive analysis was performed by plotting the number of RSV-positive swabs according to each calendar week and comparing this with the means of the meteorological variables in the same calendar week. Due to the regular seasonal patterns over the course of the study we were able to conduct time-series analyses testing for the seasonal scale associations between meteorological exposures and RSV test positives. This was performed using cross-correlations of weekly data over the study period. Cross-correlations give average associations over the course of the time series. Associations were assessed using pairwise correlation at points of maximum cross-correlation. Data were decomposed into annual (52-week) and seasonal (13-week) moving averages prior to the cross-correlation analysis in order to smooth out short-term fluctuations. Removing the trend component allows the investigation of seasonal relationships between meteorological exposures and RSV test positives. The Tourism Queensland data were incorporated in the cross-correlation analyses using quarterly data. Analysis was conducted using Stata statistical software v14.2 (Statacorp, College Station, TX, USA).
The Gold Coast Hospital and Health Service Human Research Ethics Committee approved this study (HREC/16/QGC/259).
Results
In the 9-year period from July 2007 to June 2016, 15 387 nasal swabs from children aged <5 years were submitted for testing and 2761 gave RSV-positive results. Of these, 61 were excluded due to a prior positive test within the previous 2 weeks, leaving 2700 for analysis (Fig. 1).

Fig. 1. Nasal swab specimens tested for respiratory syncytial virus (RSV), 1 July 2007–30 June, 2016.
The seasonality of RSV-positive specimens remained relatively consistent over the study period (Supplementary Figure). RSV was detected year-round, but peak activity occurred most frequently in the mid-to-late autumn season from April to May and tapered in the winter months of June–August (weeks 8–33, Fig. 2). The median (25th–75th percentile) age of cases was 10.5 (4.2–20.3) months, 1505 (55.7%) were male, 95 (3.5%) identified as Aboriginal or Torres Strait islanders and 174 (6.4%) were visitors to the Gold Coast. During the study period there was a 102% increase in the total number of ED presentations per month from 618 in July 2007 to 1247 in June 2016 for the age group of interest.
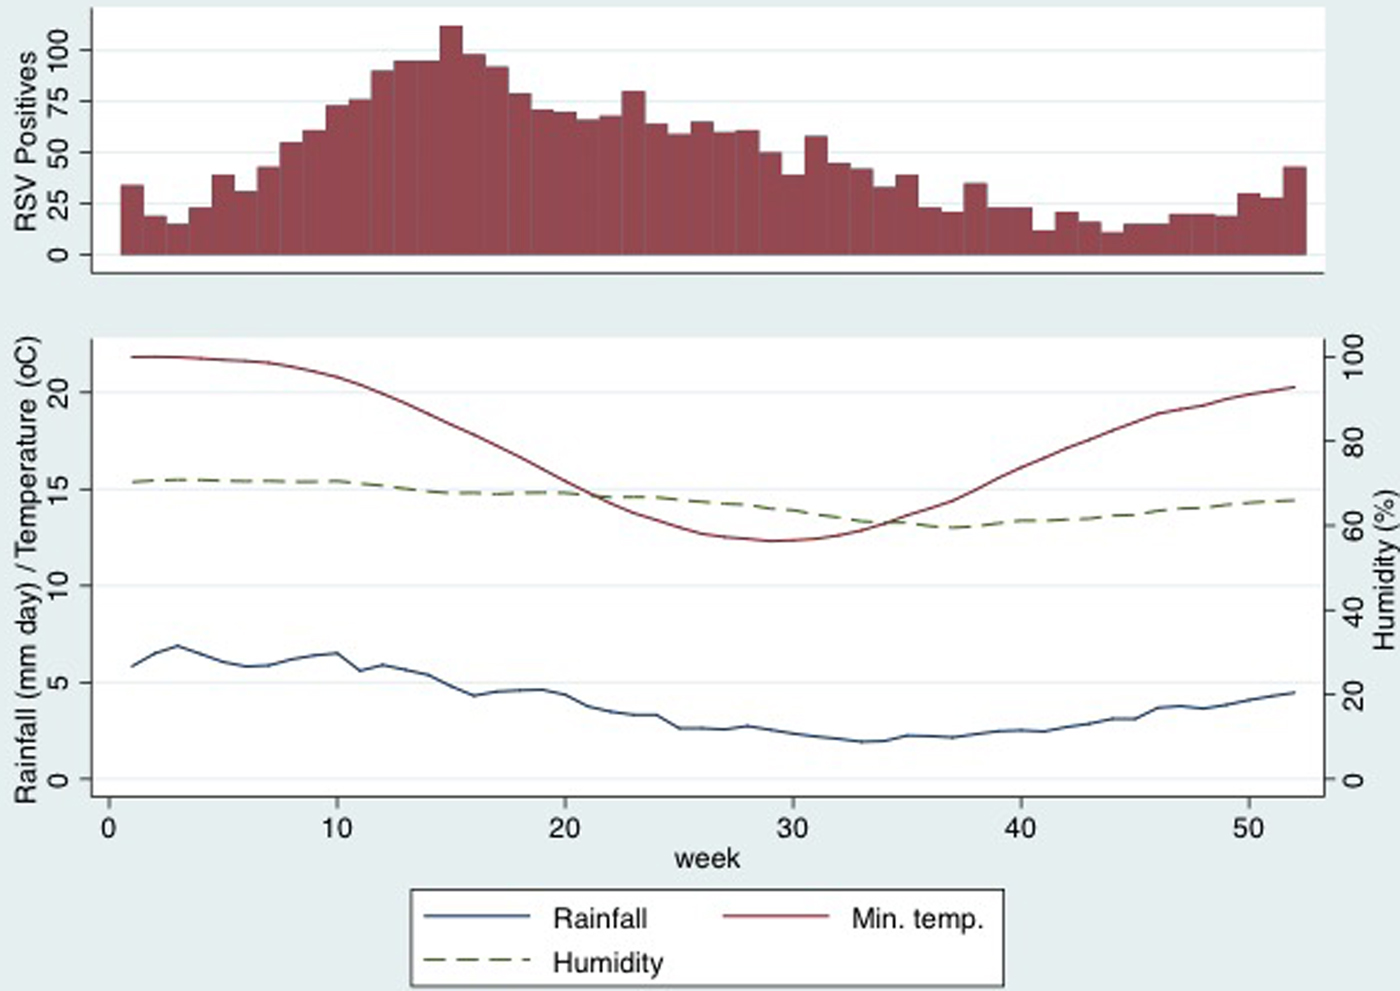
Fig. 2. Respiratory syncytial virus-positive swabs, rainfall, humidity and minimum temperature by calendar week.
Mean values of meteorological parameters over the study period are shown in Figure 2. Rainfall, humidity and temperature were all maximal in the months before the peak RSV incidence. Results of cross-correlations between weather exposures and RSV-positive results are shown in Table 1. RSV-positive specimens were most strongly correlated with rainfall (ρ = 0.40, 95% confidence interval (CI) 0.32–0.48) and humidity (0.38, 95%CI 0.29–0.46) 8 weeks earlier. The lag expressed in weeks indicated the time of maximal correlation between RSV activity and the weather exposure. The other meteorological variables that were correlated had longer lag times and, although there were strong correlations, the timing was thought to be too far from the increased RSV activity to have an impact on the seasonality and so these results are interpreted with caution. Figure 2 shows that rainfall and peak humidity preceded an increase in RSV-positive swabs. There was no distinct pattern seen with minimum temperature, dew point, daily global solar exposure and RSV activity.
Table 1. Spearman correlation between meteorological variables and respiratory syncytial virus detections

MJ, mega joules.
a Dew point is the measure of the moisture content of the air and is the temperature to which the air must be cooled in order for dew to form.
b Humidity is the measure of water vapour in the air.
c Daily global solar exposure is the total amount of solar energy falling on a horizontal surface per day. These values are usually highest in clear sun conditions during the summer.
The maximum correlation between tourist numbers and RSV detections (ρ = 0.41, 95% CI 0.32–0.48) was observed at a lag of 14 weeks, which is too large to be biologically plausible.
Discussion
The peak of RSV activity on the Gold Coast occurs in late autumn (April–May), approximately 8 weeks after the wettest and most humid time of the year. Allowing for an infectious period of 10–14 days (this includes both incubation period and virus shedding) and the time taken for older siblings to introduce RSV into households, this relationship between rainfall, humidity and RSV activity is plausible [Reference Jacoby, Glass and Moore22, Reference Munywoki23]. Mathematical modelling of transmission supports this timeframe with environmental drivers of RSV activity estimated to occur between 49 and 67 days before an RSV peak [Reference Paynter24]. Most studies that have described the seasonality of RSV have also demonstrated a correlation between 2 weeks and 2 months of the weather exposure [Reference Yusuf7, Reference Paynter12, Reference Fagan, McLeod and Baird15, Reference Haynes25]. In contrast, tourist numbers on the Gold Coast were not associated with the incidence of RSV in young children.
Worldwide there are growing data to support the idea that climate variations drive RSV epidemics. Subtropical locations (see Supplementary Table), have had their RSV seasonality explored and, based on the Köppen Climate Classification, have similar climates to the Gold Coast [Reference Yusuf7, Reference Tang and Loh9, Reference Haynes25–Reference Sung27]. These regions have shown either continuous RSV activity or distinct seasonal peaks, the timing of which varies despite similar climates, but in most cases begins in autumn. Other studies have demonstrated similar positive associations between RSV activity and peak rainfall and relative humidity, particularly in tropical regions, but also in some subtropical locations [Reference Yusuf7, Reference Paynter12, Reference Fagan, McLeod and Baird15, Reference Sung27, Reference Tang28]. This association seems to occur in climates with heavier annual rainfall, and the RSV season is prolonged when both monthly rainfall (>50 mm per month) and relative humidity are consistently high [Reference Yusuf7].
There remains some variation with cross-correlations between RSV and meteorological factors within similar climate zones. Studies from subtropical climates in South America and China report an association with relatively low temperatures; however, this was not apparent in our study. This may be because the average minimum temperature on the Gold Coast does not fall as low as temperatures in these other sites [Reference Hortal29–Reference Ji34]. One review of cities with similar climates found RSV activity peaked in cities when the mean temperatures were about 1–14°C in the coldest months, which is colder than the Gold Coast winter [Reference Yusuf7]. Surprisingly, in settings furthest from the equator and with extremely cold climates, such as Alaska and Winnipeg, Canada, RSV activity can occur year-round as it does in tropical climates [Reference Yusuf7]. There have also been conflicting results in the literature over correlations between RSV activity, ultraviolet (UV) B radiation and sunshine hours [Reference Tang and Loh9, Reference Welliver35]. It has been postulated that high levels of UV B radiation may reduce viability of RSV in the environment and in four sites, Buffalo, Buenos Aires, Winnipeg and Miami, UV B radiation levels were negatively associated with RSV cases, meaning that as UV B radiation decreased, RSV frequency increased [Reference Yusuf7]. However, studies from Bethel, Alaska showed no statistically significant correlation, and both positive and negative correlations have been found with sunshine hours [Reference Tang and Loh9]. Our study found only a very weak correlation with global solar exposure.
While meteorological factors are likely to be important, other drivers of RSV epidemics have been explored. Malnutrition correlates with RSV activity in low and low-middle income tropical countries and was even more significant than meteorological factors [Reference Paynter11]. However, in high-income countries such as Australia malnutrition is not likely to be a significant factor and meteorological factors are more likely to influence the timing of RSV epidemics [Reference Paynter11]. Nevertheless, confounding between environmental and behavioural variables is possible, such as indoor crowding occurring more frequently during rainy periods or colder weather [Reference Colosia36]. It has also been suggested that reduced vitamin D levels from increased cloud cover might result in a greater susceptibility to infection by respiratory viruses [Reference Tang and Loh9]. Viral evolution is another important consideration, where antigenic variability may subvert population immunity and drive RSV epidemics [Reference Matheson37]. This highlights that determinants of RSV transmission are complex and likely multifactorial from a combination of global environmental elements, such as the weather, as well as specific local regional, behavioural and virus-associated factors.
Determining the timing of palivizumab administration to infants at high risk of severe RSV infection is relevant for Australia, given its size (7.69 million km2) and diverse climatic conditions. Our study and review of the literature supports recommendations to take into account local epidemiological factors as seasonality varies according to climate and location. Nevertheless, in subtropical regions RSV epidemics can also on occasions have sustained peaks or even persistent activity, highlighting the importance of continuing to monitor RSV activity [Reference Halstead and Jenkins26, Reference Chiu38]. Based on our results, we believe that monthly doses of palivizumab for high-risk infants should be commenced in March, at the beginning of autumn on the Gold Coast, and continued over at least the next 5 months.
The strengths of this study include the large sample size, the 10-year time period that was analysed and where the same PCR diagnostic assay was used throughout. This is the first study in Australia to systematically evaluate RSV seasonality in a subtropical climate, and incorporates statistical cross-correlations with weather patterns. Although the association of RSV with autumn months was also observed previously in the subtropical city of Brisbane in South-East Queensland, the principal aim of that study was to describe upper airway virus–bacteria associations in children of all ages presenting to a tertiary paediatric ED with an acute respiratory illness and where cough was a major symptom [Reference O'Grady39]. Moreover, in that study the proportion of both RSV detected and young infants recruited was relatively low and the results may therefore not be generalisable to the broader population of children aged <5 years. A recent study from Western Australia also explored the seasonality of RSV across this large state (2.64 million km2) that has a large climatic variation [Reference Hogan14]. It included data from a subtropical region, but the results were analysed according to different health administration geographic regions and so results in each group could include a mix of cases from subtropical, grassland and temperate climate areas.
There are also some important limitations to consider. As the time-series was retrospective, it was not possible to determine the consistency of nasal swab testing for all children presenting with symptoms of acute respiratory infections, although no changes to this practice recommendation were made during the study period. There was an overall increase in presentations to the Gold Coast Hospital ED in this age group, which was probably due to several factors, including new hospital facilities opening and dedicated paediatric staffing levels increasing. There were also periods when surveillance may have been increased, such as during the 2009 H1N1 pandemic. Interestingly an increasing trend in testing rates was reported in a recent study from Western Australia where respiratory virus detections over a 12-year period were examined [Reference Lim40]. This showed an increase in the rate of virus detection from 36.3% to 44.4% over the study period, which was attributed to changing from rapid specific antigen-based testing to the more sensitive PCR diagnostic assays. While this may have important implications for accurately interpreting the burden of disease in future epidemiological studies, it will likely have less influence upon detecting RSV epidemics and associations with meteorological factors.
Conclusion
In conclusion, this is the first Australian study to systematically describe RSV seasonality in a subtropical climate and to measure the association with local meteorological conditions. Peak periods of RSV detection were strongly correlated with rainfall, and moderately correlated with relative humidity, 8 weeks earlier. Further understanding of RSV seasonality will help improve our knowledge of virus transmission in different environments, while also contributing to decisions on the timing of passive RSV immunoprophylaxis to selected high-risk infants, health care planning, good hygiene and infection control practices and informing the delivery of future vaccine strategies.
Supplementary material
The supplementary material for this article can be found at https://doi.org/10.1017/S0950268818000614
Acknowledgements
We would like to thank our colleagues in the Microbiology Department and the Paediatric Department at Gold Coast University Hospital for their valued input to this study.
Conflicts of interest
None.


