


INTRODUCTION
The publication of the Delis-Kaplan Executive Function System (D-KEFS; Delis et al., Reference Delis, Kaplan and Kramer2001) is a positive development in the assessment of executive functioning. The D-KEFS gathers together an extensive range of some of the best available measures of executive functioning, offers a carefully standardized administration, and provides norms based on a large, stratified, census-matched, sample. Some reviewers, however, have expressed concern over the reliability of D-KEFS scores (Baron, Reference Baron2004; Schmidt, Reference Schmidt2003; Strauss et al., Reference Strauss, Sherman and Spreen2006). Other reviewers (Homack et al., Reference Homack, Lee and Riccio2005; Shunk et al., Reference Shunk, Davis and Dean2006), and the authors of the test (Delis et al., Reference Delis, Kramer, Kaplan and Holdnack2004), have been more sanguine. Shunk et al. (Reference Shunk, Davis and Dean2006), for example, conclude that the D-KEFS is “psychometrically sound” (p. 275) and notes that low reliability “has been a popular criticism of the D-KEFS system but does not pose serious concern” (p. 277).
To date, the debate over the reliability of D-KEFS scores has focused on the reliability coefficients presented in the D-KEFS test manual. The present paper is concerned, not with existing reliability information, but with the reliability of the D-KEFS contrast scores. Contrast scores allow neuropsychologists to examine the discrepancies between related measures (for example, an individual's category fluency score can be compared to her/his letter fluency score). Like other D-KEFS measures, they are standardized to have a mean of 10 and standard deviation of 3.
The provision of contrast scores is in keeping with the process approach to neuropsychological assessment advocated by the test's authors (Delis et al., Reference Delis, Kaplan and Kramer2001). However, there are at least two reasons to be cautious about the use of contrast scores in neuropsychological decision making. First, although the rationale for the use of discrepancy scores may appear compelling, empirical studies of their ability to differentiate between healthy and impaired populations have often produced disappointing results (Smith et al., Reference Smith, Ivnik, Lucas, Morgan and Ricker2008).
Second, there is the danger that the reliability of discrepancy scores/contrast scores will be unacceptably low. When, as is the case with the D-KEFS contrast scores, the two components used to form the contrast have the same standard deviation, the reliability of the difference score is a simple function of the correlation between the two components and their reliabilities. Thus there are two sources of measurement error present in a contrast score rather than the one present in a simple score. Also, as contrast scores typically compare measures of two related constructs, the correlation between the components will often be moderate and may approach the reliabilities of the components in its magnitude. In this situation the variance of the contrast score will predominantly be measurement error variance.
In view of the foregoing concerns over contrast scores, it is important that neuropsychologists have access to information on the reliability and standard errors of measurement of the D-KEFS contrast scores. Unfortunately no such information is provided in the D-KEFS manual. This omission runs counter to expert advice. For example, Standard 2.1 of the authoritative Standards for Educational and Psychological Testing (Reference American Educational Research Association1999) states, “For each total score, subscore, or combination of scores that is to be interpreted, estimates of relevant reliabilities and standard errors of measurement … should be reported.” (p. 31). Standard 2.3 makes it explicit that difference scores (i.e., contrast scores) should not be regarded as exempt from these requirements. It states, “When test interpretation emphasizes differences between two observed scores of an individual …, reliability data, including standard errors, should be provided for such differences.” (p. 32). The primary aim of the present study is to attempt to provide the information recommended earlier by estimating the reliability of the contrast scores and thereby also providing accompanying standard errors of measurement.
METHOD
This research was approved by the School of Psychology Ethics Committee, University of Aberdeen, and was conducted in accordance with the Helsinki Declaration.
Reliability of Contrast Scores
When the two components have a common standard deviation, the formula for the reliability of a difference score (e.g., Crocker & Algina, Reference Crocker and Algina1986) is simply
where r XX and r YY are the reliabilities of the two components entering into to the difference (i.e., contrast) score, and r XY is the correlation between them. The reliability coefficients thus obtained can then be used, along with the standard deviation of contrast scores (which is 3 in all cases) to obtain standard errors of measurement.
Ideally, the reliabilities and correlation between the components of difference scores should be obtained from the same test session (i.e., internal consistency coefficients should be used). However, as the authors of the D-KEFS point out, the nature of many of the subtests preclude calculation of these coefficients (Delis et al., Reference Delis, Kaplan and Kramer2001) and therefore they used the test-retest method to estimate reliability for the majority of subtests.
The test-retest reliabilities of the two components of each of the contrast scores along with their intercorrelations were obtained from the D-KEFS technical manual for each of the three standardization sample age bands (8–19, 20–49, and 50–89 years). However, for the Verbal Fluency and Sorting subtests it was also possible to use internal consistency data on the pairs of components used to derive the contrasts. For these latter estimates, some pre-processing of the data was required: The internal consistency estimates in the test manual were presented for a finer gradation of age bands (16 in all) than that used elsewhere in the manual. These reliability estimates were averaged (via Fisher's z transformation) to obtain the averaged reliability within each of the three principal age groups.
In the case of the D-KEFS Color-Word Interference test, one of the contrast scores compares Inhibition/Switching with combined Naming + Reading. Test-retest reliability data are not presented for combined Naming + Reading. However, internal consistency coefficients are presented and so the reliability was estimated using the averaged internal consistency coefficients within each of the three age groups.
RESULTS AND DISCUSSION
Reliabilities for the Trail Making Test
It can be seen from Table 1 that the estimated reliabilities for the five Trail Making Test contrast scores show considerable variability. However, they are generally very low, ranging from −0.23 to .49. Note that many of the reliability coefficients take negative values. The term in the numerator for the reliability of a difference score (Formula 1) consists of the average of the reliabilities of the two components minus the correlation between them. Thus, when the correlation between the components exceeds the average reliability, the reliability of the difference score will take a negative value. When this occurs it is taken as an indication that the true reliability of the difference score is either zero or, at best, low.
Table 1. Estimated reliability of the 14 D-KEFS contrast scores in the three standardization sample age bands: The reliabilities of the components were based on test-retest reliability coefficients (for three of the contrast scores reliabilities were also estimated using internal consistency data, these are indicated by the suffix IC)
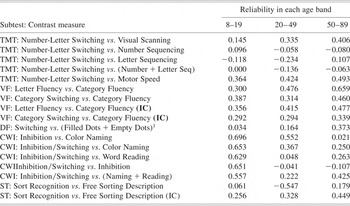
Note
TMT = Trail Making Test; VF = Verbal Fluency; DF = Design Fluency; CWI = Color-Word Interference; ST = Sorting Test. 1The reliabilities for Filled Dots + Empty Dots in each age band were calculated by the present authors using the formula for the reliability of a composite.
There are two main factors that contribute to the possibility of obtaining negative estimates. First, when the samples used to estimate the reliability of the scores and their correlations are modest in size, the sample estimates of the true reliabilities and correlations will be subject to considerable error. Thus, for example, if the sample reliability coefficients for the components are lower than the true reliabilities, the reliability of the contrast score will be underestimated; the underestimation will be particularly marked if, by chance, the sample correlation between the two components overestimates the true correlation.
Negative estimates of reliabilities can also be obtained when between-component items genuinely share more variance than do within-component items (the correlation will then exceed the averaged reliability). In this latter case the problem is one of construct validity rather than reliability. Both of these factors may contribute to the negative values obtained for the D-KEFS contrast scores. Certainly the sample sizes used to estimate the test-retest reliabilities were very modest (28, 35, and 38 for the 8–19, 20–49, and 50–89 age bands respectively). Moreover, some of the pairs of components have highly similar task demands. The differences between the tasks that the tests' authors believe to be crucial may in fact not be, whereas, within each task, the cognitive demands may change as the task progresses and this recruitment of different cognitive processes may be common to both components (hence the between-component variance may exceed the within-component variance).
Reliabilities of the Remaining D-KEFS Contrast Scores
The reliabilities of Verbal Fluency contrast scores are generally higher than those obtained for the Trail Making test (and none are negative). However, the reliabilities are still, in most cases, disappointingly low; they range from .29 to .66. The results obtained when the test-retest reliabilities of the components were used as inputs versus those obtained using the internal consistency coefficients do not differ dramatically, although (with one exception) the test-retest reliabilities yielded higher reliabilities.
Design Fluency has only one contrast score: the reliability is low in all three age groups (ranging from .3 to .37). For the five Color-Word Interference contrast scores the results are again disappointing. The most striking feature of these latter results is that the reliabilities of the contrast scores are generally low for the two older age groups (reliabilities range from − .11 to .55), whereas they are much higher for the youngest age group (where they range from .56 to .70).
The Sorting Test has only one contrast score (but two estimates of its reliability as internal consistency data were available). Although both sets of estimates are low, it can be seen that, in this case, the results are particularly poor for the test-retest reliabilities.
Averaged Reliability of D-KEFS Contrast Scores and Standards for Reliability
The average reliability (across all contrast scores and age bands) was 0.27 with a median of .30. Various systems for classifying the adequacy of the reliability of psychological tests have been proposed by experts in measurement. Of the 51 reliability coefficients calculated for the contrast scores in the present study, none met Nunnally and Bernstein's (Reference Nunnally and Bernstein1994) requirement of reliabilities of .90 or above. Moreover, none of the contrast scores can be classified as “reliable” (>.70) according to Sattler (Reference Sattler2001). Similarly, the reliabilities of all of the contrast scores were “unacceptable” according to Cicchetti's (Reference Cicchetti1994) classification system, that is, all fell below .70.
Standard Errors of Measurement for the D-KEFS Contrast Scores
The standard errors of measurement (SEM) for the contrast scores are presented in Table 2. The measurement error variance of test scores cannot exceed the total variance. Therefore, contrast scores with negative estimated reliabilities were assumed to have zero reliability and the SEM was set equal to the standard deviation of obtained scores (3) in such cases.
Table 2. Standard errors of measurement (SEM) for the 14 D-KEFS contrast scores in the three standardization sample age bands: Where the reliability of a contrast score was estimated to be negative the SEM was set equal to the standard deviation of the score (SEMs based on use of internal consistency data are indicated by the suffix IC)
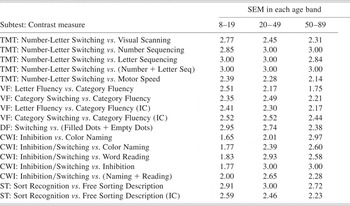
Note
TMT = Trail Making Test; VF = Verbal Fluency; DF = Design Fluency; CWI=Color-Word Interference; ST = Sorting Test.
The standard errors of measurement in Table 2 can be used to set confidence intervals on D-KEFS contrast scores. Experts on psychological measurement are unanimous in recommending that test scores should be accompanied by confidence intervals. These intervals serve the general purpose of reminding us that scores are fallible (i.e., they avoid reifying the observed score) and serve the specific and practical purpose of quantifying the effects of such fallibility (Crawford & Garthwaite, Reference Crawford and Garthwaite2008).
As can be anticipated from the foregoing results, the confidence intervals will be wide for most of contrast scores. That is, a high degree of uncertainty over an individual's true contrast score will be the rule rather than the exception. For example, the median reliability for the contrast scores was 0.30 (for the Letter Fluency vs. Category Fluency contrast in the 8–19 age group based on test-retest reliabilities). The accompanying standard error of measurement was 2.51. Suppose an individual's contrast score is 10. The SEM multiplied by 1.96 is 4.92: adding and subtracting this quantity from the obtained score (and rounding) gives a 95% confidence interval for the score of 5 to 15. Expressing this interval in the form of percentile ranks (as recommended by Crawford & Garthwaite, Reference Crawford and Garthwaite2008) the limits are from the 5th percentile to the 95th percentile.
Should the D-KEFS Contrast Scores be Interpreted?
The reliability of a difference score is constrained by the reliabilities of its components. Therefore, given that the reliabilities of many of the D-KEFS subtests are themselves modest (Schmidt, Reference Schmidt2003; Strauss et al., Reference Strauss, Sherman and Spreen2006), it was not expected that the contrast scores would be very reliable. However, the results were particularly disappointing. Indeed, based on the present analysis the majority of D-KEFS contrast scores should be considered to be uninterpretable. A reliability coefficient is an estimate of the proportion of test variance that is true variance and most of the D-KEFS contrast scores this proportion is low. That is, the indications are that most of the variance of these scores is simply measurement error variance.
We turn now to briefly consider of the types of evidence that might lead to a modification or even rejection of these preliminary, pessimistic conclusions. One possibility is that future reliability studies will provide more encouraging results. For example, an alternative approach to estimating the reliability and standard errors for the D-KEFS contrast scores would simply be to correlate the contrast scores obtained on two occasions; that is, to calculate test-retest reliabilities for the contrast scores (and thereby also obtain standard errors) just as was done for the other D-KEFS scores.
The estimates of reliabilities obtained using this approach are liable to be somewhat higher than those reported here because it does not involve mixing the estimate of the correlation between tests obtained from one test session with the estimates of reliability obtained from two sessions. However, the reliability estimates provided by this alternative approach are not liable to be dramatically different from those reported here and, unfortunately, for most of the contrast scores, dramatic differences would be required before the reliabilities could be considered adequate.
A demonstration that contrast scores have large effect sizes (or high sensitivity and specificity) when cognitively intact samples are compared to various clinical populations (e.g., patients with focal frontal lesions) would also provide support for the use of contrast scores. Such results are not impossible: It has been suggested that, paradoxically, unreliable scores can still, in theory, possess sufficient power to detect group differences (see Strauss, Reference Strauss2001 for a brief commentary on this controversial topic). However, classic treatments (e.g., Chapman & Chapman, Reference Chapman and Chapman1973) of the effects of the reliability of measures on the ability to differentiate between groups would argue against the likelihood of strongly positive outcomes.
In summary, at present it would be imprudent to use D-KEFS contrast scores in arriving at a formulation of an individual's cognitive strengths and weaknesses. The neuropsychological community should be willing to be convinced otherwise but, in view of the present results, the burden of proof must lie firmly with those who would advocate their use.
ACKNOWLEDGMENTS
The first author (JRC) undertakes consultancy for the Psychological Corporation (publishers of the D-KEFS). This work was undertaken while one of the authors (PHG) was a visiting academic at the University of New South Wales, Sydney, and was conducted without the support of a research grant or contract.


