


Hypertension (high blood pressure) is one of the leading public health problems worldwide( Reference Kearney, Whelton and Reynolds 1 ). More than a quarter of the global adult population, which is approximately one billion people, had hypertension in 2000. This proportion will increase to 29 % by 2025( Reference Kearney, Whelton and Reynolds 1 ). The report of the fourth Korea National Health and Nutrition Examination Survey (KNHANES) showed that the prevalence of hypertension increased from 24·6 % in 2007 to 26·3 % in 2008 among Korean adults who were older than 30 years of age( 2 ).
Hypertension is associated with an increased risk of various chronic diseases, including CHD, stroke and cardiovascular mortality( Reference Weitzman and Goldbourt 3 – Reference Inoue, Ohkubo and Kikuya 5 ), as well as some cancers( Reference Grossman, Messerli and Boyko 6 , Reference Soler, Chatenoud and Negri 7 ), all of which are leading causes of death among Koreans( 8 ).
Hypertension can be prevented, delayed and treated with pharmacological therapy and lifestyle changes, such as diet, physical activity and smoking cessation( Reference Dickinson, Mason and Nicolson 9 ). The Dietary Approaches to Stop Hypertension (DASH) diet, characterized by a low-fat and low-Na dietary pattern rich in fruits, vegetables and low-fat dairy products, helps lower blood pressure( Reference Sacks, Svetkey and Vollmer 10 ). Additionally, higher intakes of K, Ca, Mg( Reference Kotchen and McCarron 11 ), dietary fibre( Reference Streppel, Arends and van 't Veer 12 ) and whole grains( Reference Tighe, Duthie and Vaughan 13 , Reference Wang, Gaziano and Liu 14 ), as well as the Mediterranean diet (rich in olive oil, fruit and vegetables)( Reference Psaltopoulou, Naska and Orfanos 15 ), have been suggested to be associated with a lower risk of hypertension.
The use of DASH, Mediterranean and derived dietary patterns has emerged as an approach to examining the effects of overall diet consumption( Reference Hu 16 ) because the high intercorrelation between nutrients and foods often makes it difficult to identify the effects of single dietary components. Dietary pattern analysis reflecting real-world food habits allows the development of practical food-based dietary guidelines. To understand the dietary patterns associated with hypertension in Koreans, we attempted to identify the major dietary patterns using factor analysis and to examine the association between dietary pattern and hypertension and pre-hypertension in male and female Korean adults.
Methods
Study population
The current cross-sectional study used survey data from the fourth KNHANES (KNHANES IV) conducted in 2007 and 2008 by the Korea Centers for Disease Control and Prevention. The objectives, design and methods of the KNHANES have been described elsewhere( Reference Oh, Lee and Lee 17 ). In brief, the survey was conducted to monitor the prevalence of chronic diseases, to assess trends in nutritional status and behaviours and to analyse risk factors for chronic diseases from a representative sample of the non-institutionalized Korean civilian population. Information regarding health and nutritional status was collected using standardized health interviews, health examinations and dietary interviews.
Participants in the current study were restricted to male and female adults who were at least 20 years old. We excluded individuals who did not respond to a frequency questionnaire of sixty-three food items or had an implausibly high or low total energy intake (<2510 or >20 920 kJ/d (<600 or >5000 kcal/d)). To take into account any dietary modification among those who were aware of their hypertension, we excluded participants who reported a diagnosis of hypertension or hypertension medication use, as well as those who reported a change in their diet for any reason. As a result, a total of 5308 individuals were included in our study.
The Korea Centers for Disease Control and Prevention Institutional Review Board approved the study, and written informed consent was obtained from all study participants.
Case ascertainment and definition
Health-care professionals measured blood pressure using a standard mercury sphygmomanometer as a part of the health examination. Systolic blood pressure (SBP) and diastolic blood pressure (DBP) were measured three times after participants had rested for 5 min in a stable state. The average of the last two readings for SBP and DBP was used to determine the participants’ blood pressure stage. Participants were categorized according to the Seventh Report of the Joint National Committee on Prevention, Detection, Evaluation, and Treatment of High Blood Pressure (JNC 7)( Reference Chobanian, Bakris and Black 18 ). Normal blood pressure was defined as SBP < 120 mmHg and DBP < 80 mmHg; pre-hypertension as 120 ≤ SBP < 140 mmHg or 80 ≤ DBP < 90 mmHg; and hypertension as SBP ≥ 140 mmHg or DBP ≥ 90 mmHg.
Assessment of dietary and non-dietary factors
Types of alcoholic beverages (soju, rice wine and beer; the most commonly consumed types of alcoholic beverages) and other food items consumed were queried on a non-quantitative FFQ. The usual dietary pattern was derived using an FFQ of sixty-three food items to assess average food intake frequency. Participants were asked to indicate how frequently they consumed each food item over the previous year and the frequencies were placed into the following ten categories: do not eat or consume very little; 6–11 times/year; 1 or 2–3 time(s)/month; 1, 2–3 or 4–6 time(s)/week; and 1, 2 or 3 time(s)/d.
Sixty-three food items were assigned to thirty food groups based on the macronutrient composition and food preparation. Foods that did not fit into a group or distinctive foods (e.g. eggs, coffee and tea) remained as individual categories. The following food groups were defined: rice; other grains; instant noodles; noodles; rice cakes; bread; snacks; potatoes; legumes; red meats; poultry; processed meats/fish; eggs; fish; seafood; seaweed; salted fermented seafood; salted vegetables (kimchi); vegetables; mushrooms; fruits; dairy products; carbonated beverages; coffee; green tea; beer; soju; rice wine; fast foods (pizza and hamburgers); and fried foods.
BMI was calculated as weight/height2 (kg/m2). Total energy intake was calculated from one day's dietary intake data collected using the 24 h recall method. Participants were asked about their marital status, educational level, vitamin or mineral supplement use and smoking habits (age at which smoking started, average number of cigarettes smoked daily and duration of smoking). The number of pack-years of smoking was calculated by multiplying the number of packs of cigarettes smoked daily by the number of years of smoking history. Alcohol intake was calculated as the weekly servings of alcoholic beverages determined by multiplying the frequency of alcohol consumption by the number of alcoholic beverage servings consumed on one occasion. Levels of physical activity were derived based on self-reported responses about how often participants participated in moderate or vigorous activity during the week. Moderate activity at least 5 times/week or vigorous activity at least 3 times/week was defined as a high level of activity. A medium level was defined as moderate activity of 1–4 times/week or vigorous activity of 1–2 times/week. Less than 1 time/week of vigorous or moderate activity was defined as a low physical activity level( Reference Kushi, Fee and Folsom 19 ).
Statistical analyses
We combined the data from the first and second survey phases of KNHANES IV (KNHANES 2007 and 2008) for these analyses. Dietary patterns were generated using a factor analysis of the thirty predefined food groups. The factors were rotated with an orthogonal transformation using a varimax rotation to achieve a simpler structure with greater interpretability. A minimum eigenvalue of 1·5, the scree plot and the interpretability of the factors were used as criteria to determine the number of factors; as a result, three factors were retained. Food items with an absolute factor loading of 0·30 or greater were considered significant contributing groups to the factor.
A χ 2 test was used to compare the characteristics of participants with normal blood pressure, pre-hypertension and hypertension. Means and their standard errors were compared across the three groups using general linear models. Distributions for blood pressure, BMI and pack-years of smoking according to dietary pattern tertiles were compared using general linear models after adjusting for age, sex and total energy intake. We used polytomous logistic regression analyses to assess the associations of dietary pattern scores with pre-hypertension and hypertension. We divided the dietary pattern scores into quintiles. In the multivariate models, the following possible risk factors were considered: age, total energy intake, marital status, educational level, BMI, smoking status, alcohol consumption, supplement use and physical activity. Participants were assigned the median value for each category to test for trends across each quintile; this variable was treated as a continuous term in the model.
We examined whether dietary patterns in individuals with pre-hypertension or hypertension differed according to BMI and smoking status using the Wald test (based on the cross-product term). For an overall test for heterogeneity, the likelihood ratio test compared the model fit with the cross-product term of BMI or smoking status and the dietary pattern score with the model fit without the cross-product term.
All statistical analyses were performed with the SAS statistical software package version 9·2. P < 0·05 was considered statistically significant.
Results
Factor analysis, using the thirty food groups, revealed three major dietary patterns (Table 1). The three patterns were labelled as the following based on the frequently consumed food items: ‘whole food’, ‘Western’ and ‘drinking’. These patterns explained 4·08 %, 3·50 % and 1·67 % of the variation in food intake, respectively. Dietary pattern 1, which contained many diverse foods, was labelled as the whole food pattern. Dietary pattern 2 was characterized by high consumption of fast foods, processed meats/fish, fried foods, carbonated beverages, poultry, instant noodles, red meats, bread and snacks, but low consumption of rice, other grains, legumes and salted vegetables (kimchi); we labelled this pattern as the Western pattern. Dietary pattern 3, labelled as the drinking pattern, included high loadings of soju (a type of liquor), beer, rice wine, salted fermented seafood and coffee.
Table 1 Factor loadingsFootnote * for high-loading items (absolute value ≥0·30)
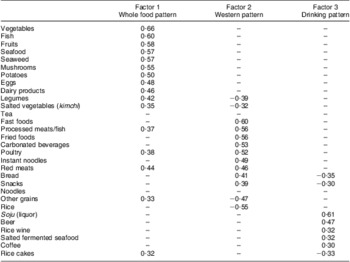
* The factor score for each pattern was estimated from the thirty predefined food groups weighted by their factor loadings.
Characteristics of Korean adults in the fourth KNHANES according to blood pressure status are shown in Table 2. Both pre-hypertensive and hypertensive participants were more likely to be older, male, divorced or widowed, smokers and have a higher BMI, a lower education level and a greater alcohol intake, but less likely to use supplements, compared with participants with normal blood pressure.
Table 2 Characteristics of participants according to hypertension status: Korean adults (n 5308) over the age of 20 years, Korea National Health and Nutrition Examination Survey IV, 2007 and 2008
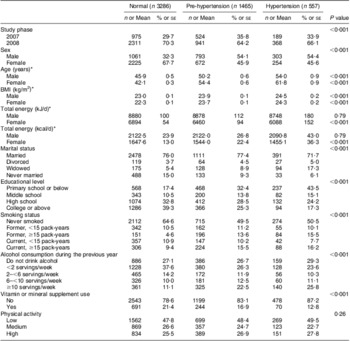
Sum of cases and non-cases in subgroups does not equal total number of participants because information was not available for a few participants.
*These data are presented as means with their standard errors; otherwise data are numbers and percentages.
Figure 1 shows the distributions of selected characteristics including blood pressure, BMI and pack-years of smoking according to dietary pattern score. Among those with a high whole food pattern score, SBP and pack-years of smoking were significantly lower compared with those having a low score (P trend < 0·001 and 0·004, respectively). For the Western dietary pattern, we found that there were no significant differences in SBP, DBP and BMI; however, pack-years of smoking were significantly associated with the Western dietary pattern (P trend <0·001). SBP, DBP, BMI and pack-years of smoking were significantly higher in those participants with a high drinking pattern score (all P trend ≤ 0·01). We found that those with a high whole food pattern score or a high Western pattern score were younger than those with a low score (P trend < 0·001). For drinking pattern, those in the second tertile of the score were oldest compared with those in the first or third tertiles (P < 0·001). When we explored energy intake by the three dietary patterns, those with a high whole food pattern score or a high Western pattern score consumed higher total energy (P trend <0·001 for whole food pattern and 0·06 for the Western pattern) compared with those with a low score. For the drinking pattern, energy intake was higher among those with a high score compared with those with a low score (P trend < 0·001). We examined the distribution of Na intake according to the three dietary patterns; those with a high whole food pattern or drinking pattern score consumed more Na than those with a low score (P trend < 0·001), whereas those with a high Western pattern score tended to consume less Na than those with a low score (P trend < 0·001).

Fig. 1 Selected characteristics ((a) systolic blood pressure (SBP), (b) diastolic blood pressure (DBP), (c) BMI and (d) smoking) according to dietary pattern tertile (![]() , lowest tertile;
, lowest tertile; ![]() , middle tertile;
, middle tertile; ![]() , highest tertile) among Korean adults (n 5308) over the age of 20 years, Korea National Health and Nutrition Examination Survey IV, 2007 and 2008. Values are means with their standard errors represented by vertical bars. P value indicates P for trend of covariates-adjusted mean value according to dietary pattern tertile. Covariates included study phase (2007, 2008), age (years; continuous), sex (male, female) and total energy (kJ/d; continuous)
, highest tertile) among Korean adults (n 5308) over the age of 20 years, Korea National Health and Nutrition Examination Survey IV, 2007 and 2008. Values are means with their standard errors represented by vertical bars. P value indicates P for trend of covariates-adjusted mean value according to dietary pattern tertile. Covariates included study phase (2007, 2008), age (years; continuous), sex (male, female) and total energy (kJ/d; continuous)
Table 3 presents the multivariate-adjusted odds of pre-hypertension and hypertension prevalence according to quintile of the three dietary patterns. In the age- and sex-adjusted model, the whole food pattern was inversely associated with pre-hypertension and hypertension prevalence. However, the association between the whole food pattern and pre-hypertension or hypertension became weakened and no longer significant after further adjustment for additional covariates. Similarly, the association was no longer significant for the Western dietary pattern after adjusting for covariates. Participants with a high drinking pattern score had significantly higher odds of pre-hypertension than those with a low score (OR = 1·56, 95 % CI 1·23, 1·99 for top v. bottom quintile; P trend = 0·001). We also found a significant upward trend in the prevalence of hypertension with an increasing drinking pattern score (P trend < 0·001). The association was stronger for hypertension than for pre-hypertension (OR = 3·05, 95 % CI 2·12, 4·40; P trend <0·001 for the top v. bottom quintile). We also examined gender-specific associations for each type of dietary pattern. We did not find any associations for the whole food pattern among either men or women. However, we found that men with a high Western pattern score had higher prevalence of hypertension compared with those with a low score (P trend = 0·02), which was not shown among women. A significant positive association between drinking pattern and prevalence of hypertension was observed among both men and women (P trend = 0·001 and 0·07, respectively; see Supplementary Materials, supplemental table).
Table 3 Odds ratios and 95 % confidence intervals of pre-hypertension and hypertension according to dietary pattern quintile: Korean adults (n 5308) over the age of 20 years, Korea National Health and Nutrition Examination Survey IV, 2007 and 2008

M, male; F, female.
*Age- and sex-adjusted: adjusted for study phase (2007, 2008), age (years; continuous), sex (male, female) and total energy (kJ/d; continuous).
†Multivariate-adjusted: adjusted for study phase (2007, 2008), age (years; continuous), sex (male, female), total energy (kJ/d; continuous), BMI (kg/m2; continuous), educational level (primary school or below, middle school, high school, college or above), marital status (married, divorced, widowed, never married), smoking status (never smoked, former <15 pack-years, former ≥15 pack-years, current <15 pack-years, current ≥15 pack-years), alcohol consumption (do not drink alcohol, <2 servings/week, 2–<6 servings/week, 6–<10 servings/week, ≥10 servings/week), vitamin or mineral supplement use (yes, no) and physical activity (low, medium, high).
‡Not adjusted for alcohol consumption.
We examined whether the association between dietary patterns and hypertension status differed according to BMI (<25 kg/m2, ≥25 kg/m2), smoking status (never smoked, ever smoked) or gender (Table 4). Neither BMI nor smoking status modified the association with the whole food pattern. The odds for pre-hypertension or hypertension with the Western dietary pattern varied according to BMI or smoking status. The association between the Western dietary pattern and pre-hypertension was more evident in participants with BMI ≥ 25 kg/m2 than in those with BMI < 25 kg/m2 (P interaction = 0·03). Lower odds of pre-hypertension or hypertension with lower Western dietary pattern score (below the median) was observed in ever smokers but not in those who had never smoked (P interaction = 0·003 or 0·002, respectively). The association between the drinking dietary pattern and pre-hypertension or hypertension was stronger in those with a smoking history than in those who had never smoked (P interaction = 0·03 or 0·003, respectively).
Table 4 Odds ratios and 95 % confidence intervals of pre-hypertension and hypertension according to dietary pattern by BMI and smoking status: Korean adults (n 5308) over the age of 20 years, Korea National Health and Nutrition Examination Survey IV, 2007 and 2008

*Adjusted for study phase (2007, 2008), age (years; continuous), sex (male, female), total energy (kJ/d; continuous), educational level (primary school or below, middle school, high school, college or above), marital status (married, divorced, widowed, never married), smoking status (never smoked, former <15 pack-years, former ≥15 pack-years, current <15 pack-years, current ≥15 pack-years), alcohol consumption (do not drink alcohol, <2 servings/week, 2–<6 servings/week, 6–<10 servings/week, ≥10 servings/week), vitamin or mineral supplement use (yes, no), and physical activity (low, medium, high).
†Adjusted for study phase (2007, 2008), age (years; continuous), sex (male, female), total energy (kJ/d; continuous), BMI (kg/m2; continuous), educational level (primary school or below, middle school, high school, college or above), marital status (married, divorced, widowed, never married), smoking status (pack-years; continuous), alcohol consumption (do not drink alcohol, <2 servings/week, 2–<6 servings/week, 6–<10 servings/week, ≥10 servings/week), vitamin or mineral supplement use (yes, no), and physical activity (low, medium, high).
‡Not adjusted for alcohol consumption.
Discussion
Consuming a diet high in alcohol and salted fermented seafood (a drinking dietary pattern) was associated with a higher prevalence of pre-hypertension and hypertension in the Korean population in this national cross-sectional study of 5308 Korean adults. Participants with a high drinking pattern score (fourteen drinks per week on average) were 3·05 times more likely to have hypertension than those with a low score. A whole food pattern was not associated with pre-hypertension or hypertension, whereas a Western pattern was associated with hypertension only among men. This gender difference could be partly explained by the fact that Korean men tend to eat out and therefore may be more exposed to a Western diet than women. In our study, men had higher Western pattern scores than women. When we restricted the population to those with BMI < 25 kg/m2 or never smokers, we found no association between the whole food pattern or Western pattern and prevalence of hypertension. However, the positive association between the Western pattern and prevalence of hypertension was stronger among ever smokers than never smokers, suggesting that we cannot rule out the possibility of residual confounding. However, this observation could be due to gender difference because smoking is more prevalent among men than women in Korea. For the drinking pattern and hypertension, a strong positive association among never smokers may support our finding of a high prevalence of hypertension with high drinking pattern scores. Our results warrant further replication.
The association between dietary patterns and hypertension, CVD or cardiovascular risk factors, such as high blood pressure, high serum lipids and poor glycaemic control, has been investigated in epidemiological studies( Reference Fung, Willett and Stampfer 20 – Reference Lee, Cai and Yang 24 ). A cross-sectional study of 39 252 Chinese men revealed that the ‘fruit and milk’ pattern was inversely related to SBP and DBP. The ‘fruit and milk’ pattern was also associated with a lower prevalence of both pre-hypertension and hypertension; these associations appeared to be stronger among drinkers( Reference Lee, Cai and Yang 24 ). In the European Prospective Investigation into Cancer and Nutrition (EPIC) Potsdam Study of 8552 women, no significant associations were observed between the incidence of hypertension and the ‘traditional cooking’ pattern or the ‘fruits and vegetables’ pattern. However, women who adhered to a DASH diet had a lower risk of hypertension than women who did not (hazard rate ratio = 0·51, 95 % CI 0·29, 0·89)( Reference Schulze, Hoffmann and Kroke 21 ). In a cross-sectional study of a Japanese population aged 40–69 years, the vegetable pattern (i.e. higher intakes of vegetables, potatoes, soya products, fruits, seaweeds, citrus, beans and dried fish) was associated with lower levels of SBP, DBP and pulse pressure in women( Reference Sadakane, Tsutsumi and Gotoh 23 ).
In a previous cross-sectional study of 1869 Korean males aged 20–65 years, no significant association was observed between dietary patterns and hypertension prevalence( Reference Kim 25 ). However, we found that a drinking dietary pattern was significantly associated with hypertension in the Korean population.
High alcohol consumption has been shown to be associated with blood pressure. In a cross-sectional study of 2609 US men and women, higher levels of alcohol consumption (≥2 drinks/d) have been associated with hypertension compared with those who did not drink or consumed very little alcohol. In that study, when analyses were restricted to current drinkers, daily drinkers exhibited a 65 % higher prevalence of hypertension v. those who drank less than once weekly( Reference Stranges, Wu and Dorn 26 ). A prospective study of 28 848 women from the Women's Health Study and 13 455 men from the Physicians’ Health Study without baseline hypertension suggested that alcohol intake exhibited a J-shaped relationship with hypertension in women; light-to-moderate alcohol consumption modestly lowered the risk of hypertension, whereas heavier consumption (4 drinks/d) significantly increased the risk( Reference Sesso, Cook and Buring 27 ). The Atherosclerosis Risk in Communities (ARIC) Study of 8334 of participants demonstrated that consumption of ≥210 g alcohol/week at baseline was associated with a high risk of hypertension (OR = 2·02, 95 % CI 1·08, 3·79 in white women and OR = 2·31, 95 % CI 1·11, 4·86 in black men)( Reference Fuchs, Chambless and Whelton 28 ). A meta-analysis of fifteen randomized controlled trials (n 2234) revealed that alcohol reduction was associated with a reduction in SBP and DBP by 3·31 mmHg and 2·04 mmHg, respectively. The mean percentage of alcohol reduction decreased blood pressure in a dose–response manner( Reference Xin, He and Frontini 29 ). In the previous Korean study based on the third KNHANES (2005), heavy alcohol intake was associated with significantly higher odds of hypertension prevalence( Reference Park, Kang and Park 30 ).
A suggested potential mechanism of alcohol-induced hypertension is that heavier alcohol consumption leads to an increase in blood pressure by influencing the heart rate, vascular smooth muscle, the sympathetic nervous system, the renin–angiotensin–aldosterone system or insulin sensitivity( Reference Klatsky 31 ). However, current evidence is not sufficient to explain the alcohol–hypertension relationship.
Notably, we found that those with a drinking dietary pattern had the tendency to consume more salted fermented seafood. Na intake in the Korean population was more than 4000 mg/d over the last decade, which is two times higher than the recommended daily Na intake( 32 ). Kimchi (Korean fermented vegetables) and salted fermented seafood have been highly correlated with the high total Na intake of the Korean diet( Reference Son, Park and Lim 33 ). Data from 24 h recall in the KNHANES (2008) showed that the top five foods contributing to Na intake were kimchi (20·0 %), salt (17·5 %), soya sauce (8·7 %), fermented soya paste (6·4 %) and ramen (noodle; 4·4 %)( 34 ). For processed meat, which is highly correlated to Na intake in Western populations, a relatively low contribution was observed in Koreans (e.g. contribution of processed ham = 0·7 %)( 34 ). High Na intake, defined as ≥2·4 g/d, accounted for 9–17 % of the population-attributable risk of hypertension in Western populations of Finland, Italy, the Netherlands, the UK and the USA( Reference Geleijnse, Grobbee and Kok 35 ). In addition, in both Chinese and Japanese populations, a high Na intake was one of the most important risk factors for hypertension( Reference Ueshima, Zhang and Choudhury 36 ). Likewise, our results suggest that a diet high in alcohol and salty foods may contribute to higher blood pressure in Koreans.
The present study has several limitations and strengths. First, because the study had a cross-sectional design, it is difficult to draw causal or directional inferences from our findings. However, we excluded participants who reported to have hypertension or those who reported dietary changes at the time of blood pressure examinations to eliminate possible reverse causation. Second, information on portion size was not collected. However, the frequency of consumption contributes more than portion size to the ranking of individuals in epidemiological studies using FFQ( Reference Heady 37 ); therefore, ranking according to pattern may have enabled us to capture associations in our study. In addition, our study may not be generalizable to other ethnic groups. However, our study provides important information about the role of dietary modifications to prevent hypertension for Koreans. Also, we investigated overall diet patterns using factor analysis. Dietary patterns provide a broader picture of food and nutrient consumption, and may thus have more practical applications than individual foods or nutrients( Reference Hu 16 ). Therefore, our study will be the basis for understanding diet among Koreans with hypertension. Additionally, trained health professionals directly assessed anthropometric measurements and blood pressure using standard protocols in this large representative sample of Korean adults.
Conclusion
Our study showed the relationship between a drinking dietary pattern and blood pressure. Understanding these associations has important implications for the prevention of hypertension in Korean populations, which have a high mortality from cerebrovascular diseases( 8 ). Therefore, we suggest that a reduction in alcohol drinking and salted fermented seafood consumption should be recommended as an important component of dietary modification for hypertension prevention in Koreans. Furthermore, our observation warrants a prospective study to evaluate the temporal relationship between dietary patterns and the occurrence of hypertension.
Acknowledgements
Sources of funding: This study was supported by the Sookmyung Women's University Research Grant (2013). Conflicts of interest: The authors declared no conflict of interest. Authors’ contributions: J.E.P. and J.E.L. designed the analysis; J.E.P. and H.J. analysed the data and drafted the manuscript; J.E.P., H.J. and J.E.L. interpreted the results and critically reviewed the manuscript.


