


Few studies have estimated the number of infections prevented or lives saved if hospitals applied best practices in infection prevention and control (IPC). More than 30 years ago, the Centers for Disease Control and Prevention’s Study on the Efficacy of Nosocomial Infection Control (SENIC) project made such an estimate.Reference Haley, Culver and White 1 The authors concluded that 30%–35% of most healthcare-associated infections (HAIs) were preventable with effective surveillance and control programs. Numerous studies have since examined interventions to reduce the most common HAIs: central-line–associated bloodstream infections (CLABSIs), catheter-associated urinary tract infections (CAUTIs), ventilator-associated pneumonia (VAP) and surgical site infection (SSI). Harbarth et al Reference Haley, Culver and White 2 performed a systematic literature review to describe multimodal intervention studies to give a crude estimate of the proportion of potentially preventable nosocomial infections almost 20 years later, in 2004. They concluded that great potential existed to decrease nosocomial infection rates, from a minimum reduction effect of 10% to a maximum effect of 70%, depending on the setting, study design, baseline infection rates, and type of infection. In 2011, a review by Umscheid et al Reference Harbarth, Sax and Gastmeier 3 confirmed that as many as 65%–70% of cases of CLABSI and CAUTI and 55% of cases of VAP and SSI might be preventable with current evidence-based strategies, with CLABSI having the highest number of preventable deaths and the highest cost impact. Irrespective of these consistent numbers on reported preventable proportions of infections in the past, the effect of interventions that aim to further reduce HAIs may diminish over time as quality initiatives and infection control programs improve, especially in higher income settings—a phenomenon known as the law of diminishing returns.
We therefore aimed to perform a systematic review and meta-analysis on the proportion of preventable HAIs among the adult patient population in different economic settings based on the literature published in 2005–2016.
Methods
Data sources and searches
For this systematic review and meta-analysis, we performed an electronic search of OVID Medline, EMBASE, CINAHL (The Cumulative Index to Nursing and Allied Health Literature), PubMed, and The Cochrane Library for articles published between January 1, 2005, and October 7, 2016, based on a previously defined protocol. The search strategy was developed with the help of an experienced librarian with expertise in literature searches for systematic reviews and meta-analyses. For the detailed search strategy, see Supplemental Table S1.
Study selection
We included all quasi-experimental studies, cohort studies, case-control studies, and randomized controlled trials evaluating multifaceted interventions to reduce CAUTIs, CLABSIs, SSIs, VAP, and hospital-acquired pneumonia in nonventilated patients (HAP) in acute-care or long-term care settings that reported infection rates as an outcome. Interventions were considered multifaceted if 2 or more interventions (eg, education AND surveillance, preoperative skin decolonization AND changes in the preoperative skin disinfection protocol) with the aim of reducing HAIs were performed. Surveillance of HAIs or audits were only considered interventions if these measures were combined with feedback. There was no restriction by study site, country, or follow-up period. Only studies published in English were considered eligible. Studies were excluded if they were cases series, case reports, outbreak reports, or ecological studies; if they included patients <16 years of age; or if they investigated only 1 specific intervention measure.
Two authors (P.W.S. and S.P.K.) screened the title and abstract of each reference identified by the search and applied the inclusion criteria. For possibly relevant articles, the full-text article was reviewed independently by the 2 authors. Final inclusion of studies was determined by agreement of both reviewers and involvement of a third author (H.S.) in cases of discrepancy. After in-depth discussion of the different opinions, the authors agreed unanimously on the final classification and inclusion of all studies.
Data extraction and quality assessment
Two authors (P.W.S. and S.P.K.) independently extracted data from published reports. In the case of missing data, no attempts were made to contact study authors, and these articles were subsequently excluded. Data extraction was performed using a standardized data collection form. The reviewers extracted data on study design, population and setting, interventions tested, and outcome measurement. Countries were classified by economic income group according to the World Bank list of economies (March 2017 version). 4 The primary outcome measure was the proportion of infected patients or the infection rate. Data were extracted as proportions if results were only reported as probability of events or as rates per number of device days. If rates were not reported per number of device days but were only reported per number of patient days, the latter was extracted.
To assess methodological quality and risk of bias in randomized controlled studies and controlled before-and-after studies, included articles were examined for (1) generation of allocation sequence, (2) concealment of allocation, (3) similarity of baseline outcome measurement, (4) similarity of baseline characteristics, (5) addressing incomplete outcome data, (6) prevention of knowledge of allocated interventions, (7) protection against contamination, (8) freedom of selective outcome reporting, and (9) freedom from other risks of bias.Reference Higgins and Green 5 , 6 For interrupted time-series analyses, we assessed (1) independency of other changes, (2) prespecification of the shape of the intervention effect, (3) likelihood of affection of data collection by the intervention, (4) appropriate analysis, (5) prevention of knowledge of the allocated intervention during the study, (6) addressing incomplete outcome data, (7) freedom of selective outcome reporting, and (8) freedom from other risk of bias.Reference Higgins and Green 5 , 6 Because uncontrolled before-and-after studies are generally considered low quality, no further quality assessment was performed for this type of study.Reference Higgins and Green 5
Data synthesis and analysis
For studies reporting only aggregated data without the possibility to calculate raw numbers, no data synthesis was performed. For studies reporting raw rates, we calculated the natural log of the risk ratio and variance to meta-analyze the extracted data and to obtain pooled risk ratio estimates. Data synthesis was performed using STATA version 11.1 software (StataCorp, College Station, TX). Because heterogeneity was anticipated between studies, random effects models using the method of DerSimonian and Laird, with the estimate of heterogeneity being taken from the inverse-variance fixed-effect model (for meta-analysis of rates) or the Mantel-Haenszel model (for meta-analysis of proportions) were used for all analyses to obtain a summary estimate (incidence rate ratio [IRR] or rate ratio [RR], as appropriate) of the average effect with its 95% confidence interval (CI). A continuity correction of 0.5 to the counts from both groups of the study were added where a study contained a zero count in either the control group or the intervention group.Reference Higgins and Green 5 , Reference Spittal, Pirkis and Gurrin 7
Statistical heterogeneity was initially inspected graphically in a forest plot. We quantified the degree of heterogeneity using the I 2 statistic and defined heterogeneitiy a priori as I 2>60%. Subgroup analyses for differences between country economic income categories were performed using fixed-effect models if criteria for heterogeneity were not met. P values<.05 were considered statistically significant.
Publication bias was investigated using a funnel plot in which the standard error of the effect estimate of each study was plotted against the estimate and was quantified using the Egger test.
Results
Study selection
The review process is summarized in Figure 1. Of the 5,226 articles retrieved with our search strategy, 208 were retained for full-text review, and 144 studies met the inclusion criteria and were included in the systematic review and meta-analysis.Reference Zingg, Cartier and Inan 8 –152 Included studies are described in Table 1. There were 138 quasi-experimental studies (95.8%): 1 controlled before-and-after study, 137 uncontrolled before-and-after studies.Reference Zingg, Cartier and Inan 8 – Reference van der Slegt, van der Laan, Veen, Hendriks, Romme and Kluytmans 15 , Reference Trussell, Gerkin and Coates 17 –44,46–49,51–59,61–120,122–133,135–140,142–152 The final group of articles also included 3 randomized controlled trials (2.1%),121,134,141 2 cluster-randomized controlled trials (1.4%),50,60 and 1 time-series analysis (0.7%).45 Moreover, 109 studies (75.7%) were performed in high income settings,Reference Zingg, Cartier and Inan 8 , Reference Yamamoto, Morimoto and Kita 10 – Reference Wahl, Arbabi, Zalewski, Wang and Hemmila 12 , Reference van Kasteren, Mannien and Kullberg 14 , Reference van der Slegt, van der Laan, Veen, Hendriks, Romme and Kluytmans 15 , Reference Trussell, Gerkin and Coates 17 , Reference Titsworth, Hester and Correia 18 , Reference Ternavasio-de la Vega, Barbosa Ventura and Castano-Romero 20 , Reference Taylor, Marten and Munsell 21 , Reference Tanner, Kiernan and Hilliam 23 – Reference Salama, Jamal, Al Mousa and Rotimi 30 , Reference Render, Hasselbeck, Freyberg, Hofer, Sales and Almenoff 34 –45,47,48,50–53,55–57,60,64–68,72–77,79–82,85–91,93–97,99–101,103–120,122,124–131,134,138,140,143,144,146–152 26 studies (18.1%) were conducted in upper middle income settings,Reference Yavuz, Tarcin and Ada 9 , Reference Viana, Bragazzi, Couto de Castro, Alves and Rocco 13 , Reference Tao, Hu, Rosenthal, Zhang, Gao and He 22 , Reference Rosenthal, Rodrigues and Alvarez-Moreno 31 – Reference Rosenthal, Guzman and Crnich 33 ,59,61–63,69–71,78,92,98,102,121,123,132,133,135,137,139,141,145 and 9 studies (6.3%) were conducted in lower middle income countries.Reference Tillekeratne, Linkin and Obino 19 ,46,49,54,58,83,84,136,142
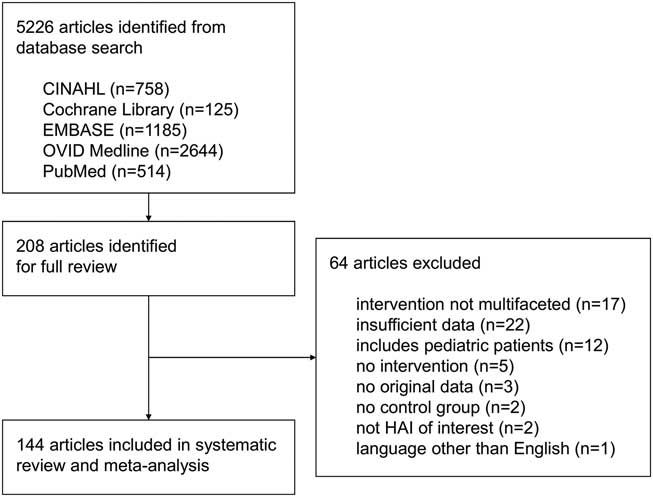
Fig. 1 Study selection. Note. HAI, healthcare-associated infection.
Table 1 Study Characteristics

Abbreviations: CLABSI, central-line–associated bloodstream infection; CAUTI, catheter-assoicated urinary tract infection; VAP, ventilator-associated pneumonia; UBA, uncontrolled before-and-after design; CBA, controlled before-and-after desgn; ICU, intensive care unit; ITS, interrupted time-series study; RCT, randomized controlled trial; VA, Veterans Administration; HH, hand hygiene; CVC, central venous catheter, CUSP, comprehensive unit-based safety program, including education and training, culture change, learning from experience, observation, implementation of evidence-based practice; CHG, chlorhexidine gluconate; IHI, Institute for Healthcare Improvement; MRSA, methicillin-resistant Staphylococcus aureus; PVP, polyvinylpyrolidone.
Catheter-associated urinary tract infection
One cluster-randomized controlled trial reported an IRR of 0.644 (95% CI, 0.456–0.910) associated with a multifaceted intervention to reduce CAUTI rates (Supplementary Fig. S1a).50 Data from 18 before-and-after studies were available for meta-analysis.Reference Ternavasio-de la Vega, Barbosa Ventura and Castano-Romero 20 , Reference Sutherland, Beloff and McGrath 26 , Reference Rosenthal, Ramachandran and Villamil-Gomez 32 ,46,52,58,61,71,78,79,83,102,116,129,135,137,142,149 Compared to standard of care, multifaceted interventions were associated with a pooled IRR of 0.543 (95% CI, 0.445–0.662), with overall heterogeneity of I 2=78.9%. Significant reductions in CAUTI incidence could be observed in all country economic income groups, although differences between subgroups could not be explored due to high heterogeneity (Fig. 2). The 7 studies reporting aggregated data on CAUTI rates demonstrated between 100% reduction and a statistically insignificant 22% increase from baseline (Supplementary Table S2).Reference Titsworth, Hester and Correia 18 , Reference Tillekeratne, Linkin and Obino 19 , Reference Parry, Grant and Sestovic 40 ,59,64,96,133

Fig. 2 Incidence rate ratios (IRRs) from fixed effects models for catheter-associated urinary tract infection (CAUTI) in uncontrolled before-and-after studies stratified by country economic income status. Data markers indicate IRRs and error bars indicate 95% confidence intervals (95% CI). Note. IV, inverse variance.
Publication bias was evident from visual inspection of the funnel plot (Supplementary Fig. S1b) and was confirmed using the Egger test (P=.002).
Central-line–associated bloodstream infection
In total, 30 before-and-after studies reported raw data on infection rates and were available for meta-analysis (Supplementary Fig. S2a).Reference Tang, Lin, Lin, Leung, Chuang and Lai 24 , Reference Salama, Jamal, Al Mousa and Rotimi 30 , Reference Render, Hasselbeck, Freyberg, Hofer, Sales and Almenoff 34 ,42,43,52,57,58,63,66,69,74,76,82,84,87,89,92,97,102,106,108,109,111,119,123,132,137,138,151 The pooled IRR of these studies was 0.459 (95% CI, 0.381–0.554), with an overall heterogeneity of I 2=86.8%. Reductions in CLABSI incidence could be observed in all country economic income groups, although differences between subgroups could not be explored due to high heterogeneity (Fig. 3). Changes in CLABSI rates ranged from a reduction of 100% to a statistically insignificant increase of 6% in 15 studies reporting aggregated data only (Supplementary Table S3).Reference Zingg, Cartier and Inan 8 , Reference Wahl, Arbabi, Zalewski, Wang and Hemmila 12 , Reference Reddy, Samuel, Smiley, Weber and Hon 36 , Reference Pronovost 38 ,59,60,64,99,103,107,115,125,139,143,148

Fig. 3 Incidence rate ratios (IRR) from fixed-effects models for central-line–associated bloodstream infection (CLABSI) in uncontrolled before-and-after studies stratified by country economic income status. Data markers indicate IRRs and error bars indicate 95% confidence intervals (95% CI). Note. IV, inverse variance.
Visual inspection of the funnel plot (Supplementary Fig. S2b) and the Egger test (P=0.071) revealed no publication bias.
Surgical site infections
Overall, 36 before-and-after studies and 1 RCT reported raw data on infection rates and were available for meta-analysis (Supplementary Fig. S3a).Reference Yavuz, Tarcin and Ada 9 – Reference Wick, Hobson and Bennett 11 , Reference van Kasteren, Mannien and Kullberg 14 , Reference van der Slegt, van der Laan, Veen, Hendriks, Romme and Kluytmans 15 , Reference Trussell, Gerkin and Coates 17 , Reference Taylor, Marten and Munsell 21 , Reference Tanner, Kiernan and Hilliam 23 , Reference Salim, Braverman, Berkovic, Suliman, Teitler and Shalev 29 , Reference Rauk 37 , Reference Prieto, Medina and López 39 ,51,55,56,65,67,72,77,80,86,88,91,93,94,100,104,105,110,114,117,118,124,130,134,145,147,150 The pooled RR of the before-and-after studies was 0.461 (95% CI, 0.389–0.546), with an overall heterogeneity of I 2=66.4%. A significant increase of SSI rates associated with a multifaceted intervention (RR, 1.565; 95% CI, 1.015–2.412) was reported in 1 RCT.134 Significant reductions in SSI rates could be observed in all country economic income groups, but differences between subgroups could not be explored due to high heterogeneity (Fig. 4). Supplementary Table S4 lists the 4 studies reporting aggregated SSI rates only. In these studies, SSI reductions ranged from 31% to 84%.45,68,122,139
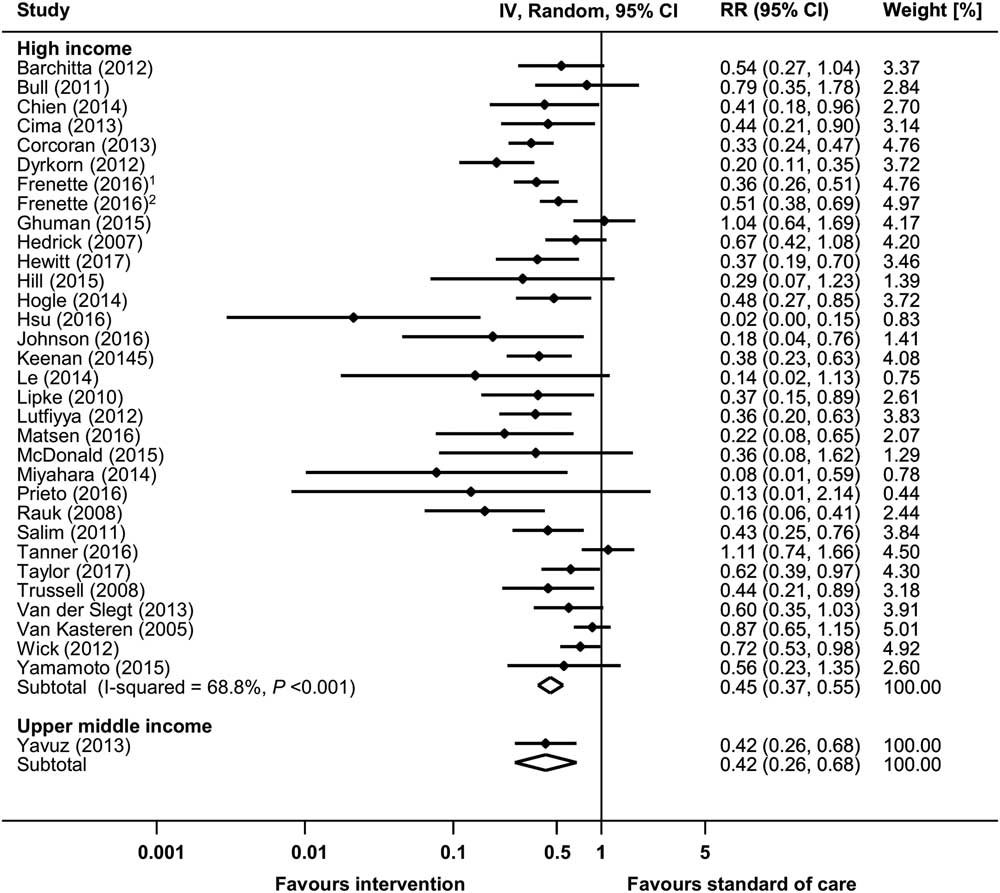
Fig. 4 Risk ratios (RRs) from random-effects models for surgical site infection (SSI) in uncontrolled before-and-after studies stratified by income status. Data markers indicate risk ratios and error bars indicate 95% confidence intervals (95% CI). Note. IV, inverse variance. (1Reference #104; 2Reference #105 in the online supplementary material.)
Publication bias was evident from visual inspection of the funnel plot (Supplementary Fig. S3b) and was confirmed using the Egger test (P=.004).
Ventilator-associated pneumonia
Raw data from 17 before-and-after studies were used to calculate the pooled IRR for VAP (Supplementary Fig. S4a).Reference Tao, Hu, Rosenthal, Zhang, Gao and He 22 , Reference Talbot, Carr and Parmley 25 , Reference Rosenthal, Rodrigues and Alvarez-Moreno 31 , Reference Rosenthal, Guzman and Crnich 33 ,44,54,58,62,70,76,81,85,95,98,101,102,137 The pooled IRR of these studies was 0.553 (95% CI, 0.465–0.657), with an overall heterogeneity of I 2=81.0%. Significant reductions in VAP incidence could be observed in all country economic income groups, although differences between subgroups could not be explored due to high heterogeneity (Fig. 5). Moreover, 5 before-and-after studies and 2 RCTs reported raw proportions of patients with VAP (Supplementary Fig. S5a).47,73,112,113,121,126,141 All but 1 of these studies, which was conducted in a upper middle income country,141 were performed in high income countries. The pooled RR (95% CI) of the before-and-after studies was 0.611 (95% CI, 0.414–0.900). The 2 RCTs showed a pooled RR of 0.509 (95% CI, 0.277–0.937).121,141 Data from 22 studies with aggregated data for VAP are shown in Supplementary Table S5.Reference Wahl, Arbabi, Zalewski, Wang and Hemmila 12 , Reference Viana, Bragazzi, Couto de Castro, Alves and Rocco 13 , Reference Shitrit, Meirson, Mendelson and Chowers 27 , Reference Sen, Johnston, Greenhalgh and Palmieri 28 ,35 ,41,48,49,52,53,59,64,75,120,127,128,131,136,139,140,144,152 Changes in VAP rates or proportions in these reports ranged between 100% reduction and a 17% increase (statistical significance not reported).
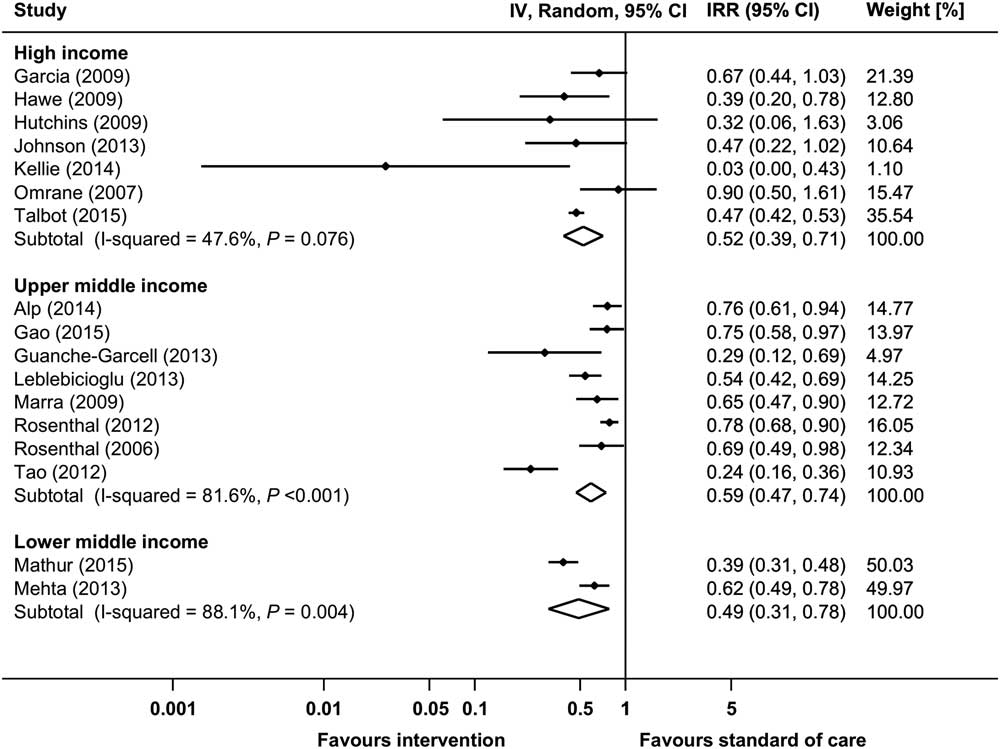
Fig. 5 Incidence rate ratios (IRRs) from random-effects models for ventilator-associated pneumonia (VAP) in uncontrolled before-and-after studies stratified by country economic income status. Data markers indicate IRRs and error bars indicate 95% confidence intervals (95% CI). Note. IV, inverse variance.
Visual inspection of the funnel plots (Supplementary Figures S4b and S5b) and the Egger test (P=.105 for studies reporting rates; P=.560 for studies reporting proportions) revealed no evidence for publication bias.
Healthcare-associated pneumonia
Only 2 uncontrolled before-and-after studies on HAP met the inclusion criteria.90,146 One study showed an adjusted OR of 0.16 (95% CI, 0.01–0.94) associated with a multifaceted intervention for prevention of postoperative pneumonia.90 Another study reported a significant reduction of 43.6% of HAP rates, from 0.78% (preintervention) to 0.44% (postintervention).146
Study quality
The risk of bias in all but 1 of the included studies was high. Uncontrolled before-and-after studies were a priori defined to be at high risk of bias.Reference Zingg, Cartier and Inan 8 – Reference van der Slegt, van der Laan, Veen, Hendriks, Romme and Kluytmans 15 , Reference Trussell, Gerkin and Coates 17 –44,46–49,51–59,61–120,122–133,135–140,142–152 All 5 randomized controlled trials and the controlled before-and-after study were considered at high risk of bias because study participants and study personnel were unblinded throughout (Supplementary Table S6).43,50,60,120,134,141 Risk of bias was unclear in the remaining 1 interrupted time-series analysis.45
Discussion
In our extensive systematic review of 5,226 screened and 144 included articles published over a 12-year period between 2005 and 2016, the pooled IRRs associated with multifaceted interventions for HAI reduction were 0.543 (95% CI, 0.435–0.662) for CAUTI, 0.459 (95% CI, 0.381–0.554) for CLABSI, and 0.553 (95% CI, 0.465–0.657) for VAP. The pooled RR was 0.461 (95% CI, 0.389–0.546) for interventions aiming at SSI reduction, and for VAP interventions, the pooled RRs were 0.611 (95% CI, 0.414–0.900) for before-and-after studies and 0.509 (95% CI, 0.277–0.937) for randomized controlled trials. Relative reductions of infection rates were independent of country economic income status, indicating that quality improvement projects with multifaceted interventions may result in substantial reducions of infection rates irrespective of the economic setting.
The proportion of HAIs that is preventable is still under debate.Reference Umscheid, Mitchell, Doshi, Agarwal, Williams and Brennan 3 Our observed ranges of reductions associated with the implementation of multfaceted, evidence-based interventions are in line with previous estimates.Reference Haley, Culver and White 1 – Reference Umscheid, Mitchell, Doshi, Agarwal, Williams and Brennan 3 Our results confirmed the findings by Harbarth et al Reference Haley, Culver and White 2 that the largest effect was attributed to interventions targeting CLABSI prevention. Interestingly, the avoidable proportion of HAI does not seem to decrease over time as would be predicted by the law of diminishing returns given the increasingly widespread availability and expected implementation of evidence-based practices for HAI reduction.153 However, for an accurate comparison, these findings must be considered in the context of changes in epidemiology over time. From 1997 to 2008, an increase of the percentage of the elderly (≥65 years of age) population from 12% to 37% was described in the United States, and a similar increase of this elderly fraction in hospitalized patients was reported.154 Increasing age is associated with a higher rate of hospitalization.155 Furthermore, aging predisposes to the development of chronic diseases, increasing the likelihood of multimorbidity.156 Later studies likely included a larger fraction of older and sicker patients—a vulnerable population prone to HAIs and increased morbidity and mortality resulting from HAIs. Therefore, it would seem that increasing implementation of evidence-based best practies has been met with global trends of aging and multimorbidity, which necessitate additional efforts to further reduce HAIs. Overall, the HAI target should likely be considered an ever-moving group of individuals at risk who enter and leave the healthcare system.
Our findings demonstrate that even in high income countries, where high adherence to current recommendations may be expected, there remains considerable room for improvment. The persistance of a 30%–50% potential reduction in HAI with the implementation of evidence-based strategies demonstrates that current recommendations have not been sufficiently implemented. Importantly, the quality of infection control measures cannot be inferred on country economic classification alone. However, due to the heterogeneity of studies included in our dataset and lack of information on process indicators, we were unable to determine whether the actual efforts to achieve a reduction of HAI differed between studies from different economies. Although many hospitals, particularly in high income settings, may claim that they adhere to current evidence-based standards, implementation science has demonstrated a large discrepancy between the intention to effect change by employing standard operating procedures and true implementation of such practices into daily practice.157,158 On the other hand, our results may also indicate that there is room for improvement after implementation of basic infection control measures that reduce HAI rates to levels that do not attract further attention.
Our systematic review and meta-analysis included multifaceted interventions only. Another highly interesting, and until now unresolved, question concerns the individual contribution of the single components of bundled interventions. Although not addressed in the current study, more profound knowledge would help guide bundle development by focusing on the most efficient elements of these interventions.
The studies reviewed in this analysis only covered known measures for IPC. The evolution of risk related to the acquisition of HAIs in medicine, however, is unknown. On one hand, medical innovations may reduce the risk of HAIs due to less invasive techniques (eg, minimal invasive surgery or noninvasive ventilation). On the other hand, novel technologies allowing interventions on patient populations that were previously ineligible for certain treatments due to impaired health status may be associated with an increased risk of HAIs. Even factors that may be perceived as unmodifiable today may be alterable in the future. Therefore, continuous efforts in the field of IPC are needed to keep up with medical progress. Such efforts must consider not only extrinsic factors (including medical devices) but also intrinsic factors (ie, host and microbes). In the future, IPC should and will be integrated more intrinsically in all medical procedures. In addition to the medical duty to prevent harm to patients, recent literature further illustrates that infection prevention programs are cost-effective when factoring in the incremental costs of HAIs to hospitals.Reference Umscheid, Mitchell, Doshi, Agarwal, Williams and Brennan 3 This particularly applies to settings were complications are not reimbursed or even associated with penalizations.159,160
The fact that we observed publication bias for studies on CAUTI and SSI and that risk of bias was high in 143 of 144 studies (99.3%) needs to be considered. An uncontrolled study design with before-and-after assessment of the intervention effect was used in most studies; thus, bias due to the influence of unmeasured extraneous factors that change over time cannot be excluded. Moreover, blinding was not performed in the 4 randomized controlled trials that were included, which may also have distorted the reported results. As in other fields of medicine, smaller intervention trials with negative results may remain unpublished.161 The HAIs addressed in this systematic review and meta-analysis mainly consist of device-associated infections. These infections, however, represent only a fraction of all HAIs. Data about the preventable proportion of non–device-associated infections are scarce; only 2 studies on HAP were included in our study. Lastly, the clear majority of the included papers reported on a single HAI or on only 1 type of SSI, which indicates that even though the interventions are multifaceted, their focus is nevertheless narrow. Additional, higher-quality data are clearly required to guide prevention efforts from a governance perspective.
The preventable proportion of HAIs reported by this systematic literature review and meta-analysis of 35%–55% suggests that there remains much to be desired in terms of implementation of evidence-based best practices. Our study findings should motivate healthcare institutions that aim to improve quality of patient care and to reduce infection rates to develop their own customized, multifaceted strategies to improve patient outcomes.
Supplementary material
To view supplementary material for this article, please visit https://doi.org/10.1017/ice.2018.183
Acknowledgments
Financial support
The study was funded by the Swiss Federal Office of Public Health. The funder of the study had no role in study design, data collection, data analysis, data interpretation, or writing of the report.
Conflicts of interest
All authors report no competing interests relevant to this article.


