


A growing body of research suggests that increasing dietary protein consumption beyond currently recommended amounts, that is 0·75–0·8 g/kg body weight/d in the UK/USA( 1 , 2 ); can aid in the maintenance/gain of skeletal muscle mass, optimise tissue reconditioning in response to exercise, and/or promote cardio-metabolic health and weight management( Reference Paddon-Jones, Campbell and Jacques 3 – Reference Wall, Morton and van Loon 6 ). Consequently, recommendations to increase dietary protein consumption in various populations, such as older adults, athletes, and those at risk of metabolic disease, are beginning to emerge( Reference Paddon-Jones, Campbell and Jacques 3 – Reference Wall, Morton and van Loon 6 ). However, this trend is occurring in the face of mounting challenges associated with the sustainability of increased production of animal proteins( Reference Ranganathan, Vennard and Waite 7 ). As a result, nutritional research is beginning to address the efficacy of alternative, plant-based protein sources( Reference Gorissen, Horstman and Franssen 8 , Reference van Vliet, Burd and van Loon 9 ).
Mycoprotein, a food source produced by continuous fermentation of the filamentous fungus Fusarium venenatum, represents an alternative dietary protein source which, compared with animal-derived sources, imposes a significantly lower environmental burden( Reference Denny, Aisbitt and Lunn 10 – Reference Turnbull, Leeds and Edwards 13 ). Interestingly, previous work has shown benefits of mycoprotein consumption on blood cholesterol and lipid profiles, satiety and glycaemic control in both healthy and metabolically compromised individuals( Reference Turnbull, Leeds and Edwards 13 – Reference Williamson, Geiselman and Lovejoy 18 ). However, the potential for mycoprotein to support muscle mass maintenance and/or reconditioning remains to be investigated.
Physiological regulation of skeletal muscle mass is controlled in large part by dietary protein intake( Reference Rennie, Edwards and Halliday 19 ). Dietary protein ingestion increases muscle protein synthesis rates and, to a lesser extent, inhibits muscle protein breakdown rates, thereby allowing net muscle protein accretion (the ‘anabolic response’). The postprandial elevation in muscle protein synthesis rates is driven by the rise in plasma essential amino acids( Reference Tipton, Gurkin and Matin 20 ) and leucine in particular( Reference Katsanos, Kobayashi and Sheffield-Moore 21 , Reference Wall, Hamer and de Lange 22 ), whereas the inhibition of protein breakdown is mainly attributed to hyperinsulinaemia( Reference Gelfand and Barrett 23 , Reference Greenhaff, Karagounis and Peirce 24 ). These postprandial periods offset the net loss of muscle protein which occurs during fasting periods. Accordingly, the potential utility (and amount required) of a specific dietary protein to support the maintenance, gain or reconditioning of muscle tissue is contingent on its ability to mount a sufficient anabolic response. The anabolic response, in turn, is dependent upon the dietary proteins bioavailability and insulinotropic properties. To date, data concerning these postprandial plasma profiles following mycoprotein ingestion are not available.
Mycoprotein is also a source of dietary purines, primarily present as nucleic acids. It has been proposed that dietary nucleic acid consumption should be limited due to concerns that excessive consumption can result in elevated serum uric acid concentrations( Reference Calloway 25 – 27 ), the latter representing an independent risk factor for the development of gout and an indicator of type 2 diabetes( Reference Duskin-Bitan, Cohen and Goldberg 28 ) However, these recommendations are based on studies that have fed large quantities of isolated, or yeast derived, nucleic acids above levels likely to be found under normal nutritional conditions( Reference Edozien, Udo and Young 29 , Reference Waslien, Calloway and Margen 30 ). Such findings require corroboration following the ingestion of nucleic acid containing whole food sources.
The aim of the present study was to provide a detailed acute postprandial plasma hyperaminoacidaemic and hyperinsulinaemic profile in response to the ingestion of graded quantities of mycoprotein compared with a reference, animal-derived protein source (milk protein). Due to mycoprotein naturally possessing a large fibre content, we chose to compare with milk protein on a gram for gram total food (i.e. mass matched) and gram for gram total protein (i.e. protein matched) basis. We hypothesised that hyperaminoacidaemia and hyperinsulinaemia would be more rapid with milk protein, though bioavailability of amino acids would be similar between protein sources, and increase in accordance with dose. As a secondary aim, we investigated the acute circulating serum uric acid and plasma clinical chemistry responses to the ingestion of increasing doses of mycoprotein.
Methods
Subjects and medical screening
We recruited fifteen healthy young men to participate in the present study. Before inclusion in the study, subjects completed a routine medical screening to ensure suitability for acceptance onto the study. This screening involved the determination of height, weight, BMI, resting blood pressure and body composition. Body fat and lean mass were determined by Air Displacement Plethysmography (BodPod; Life Measurement, Inc.). During the screening, subjects also completed a general health questionnaire. Exclusion criteria were a BMI below 18·5 or above 30 kg/m2, regular smoker, type 2 diabetes mellitus or CVD/complications. Following screening, three subjects either declined to participate or did not fit the inclusion criteria meaning that twelve healthy young (age: 28 (sem 2) years; BMI: 26 (sem 1) kg/m2) men were ultimately included in the present study. All subjects completed all aspects of the study and so all data throughout represent n 12. Included subjects’ characteristics and habitual diet are presented in Table 1. Subjects were also instructed to cease taking any nutritional supplements for 2 weeks before the study and until all study visits were completed. During the screening, subjects were provided with a 3-d food diary and were instructed by a nutritionist in how to complete the diary in as much detail as possible. Food and drink intake was recorded for 3 consecutive days including 2 week days and 1 weekend day. The habitual energy and macro/micro-nutrient intake of the habitual diet was subsequently calculated using dedicated nutritional software (Nutritics Professional Nutritional Analysis Software). All subjects were informed on the nature and risks of the experiment before written informed consent was obtained. The study was approved by the Department of Sport and Health Sciences, University of Exeter’s Ethical Committee and conducted in accordance with the Declaration of Helsinki.
Table 1 Participants’ characteristics and habitual diet (Mean values with their standard errors)
BW, body weight, En%, percentage of total energy intake.
Experimental overview and design
In a randomised, single-blind, cross-over design, subjects participated in 5 laboratory test days. During each visit subjects ingested a test drink containing 20 g milk protein (MLK20), a ‘mass matched’ bolus of mycoprotein (20 g; MYC20), a protein matched bolus of mycoprotein (40 g; MYC40), or 60 g (MYC60) or 80 g (MYC80) boluses of mycoprotein. Arterialised venous blood samples were collected in the fasted state and at regular intervals throughout a 4-h postprandial period to assess circulating amino acid, insulin and uric acid concentrations, and detail the plasma clinical chemistry profile. Indirect calorimetry and visual analogue scales (VAS) were used at regular intervals to determine whole body energy expenditure and subjective appetite scores, respectively.
Experimental visits
An overview of the experimental setup for each test day is illustrated in Fig. 1. Following inclusion into the study, volunteers attended the laboratory on five separate occasions, with each visit being separated by at least 3 d to ensure complete digestion, absorption and metabolism of the test meal. Volunteers were asked to abstain from strenuous physical activity and alcohol consumption for at least 48 h before each visit. For each test day, volunteers arrived at the laboratory at 08.30 hours in the fasted state, voided their bladder and rested semi-supine on a hospital bed for 30 min. Thereafter, resting whole body metabolic rate was determined using expired gas collections for indirect calorimetry via a mixing chamber which obtained 20 s averages (Cortex Metalyzer 2R gas analyser; Cortex). Expired gases were collected and recorded for a 15-min period, the last 5 min of which were used to obtain average V̇O 2 and V̇CO 2 values to determine substrate oxidation rates according to the non-protein stoichiometric equations detailed by Frayn( Reference Frayn 31 ). Total energy expenditure during this period was calculated as the sum of energy production from fat and carbohydrate, assuming that the oxidation of 1 g of TAG (862 g/mol) liberates 39·4 kJ and 1 g of glucose (180 g/mol) liberates 15·6 kJ of energy. This was then used to calculate resting 24 h energy expenditure at this given time point. Following this, volunteers completed a subjective appetite VAS( Reference Flint, Raben and Blundell 32 ). These 100 mm paper-based scales detailed questions regarding fullness, hunger, satisfaction, prospective food consumption and satiety which were anchored by diametrically opposed feelings of extremity. Volunteers reported on each scale their perceived feelings in the same order each time. Ratings were subsequently measured by the same researcher each time to minimise discrepancies and used to calculate an appetite score as reported previously( Reference Flint, Raben and Blundell 32 ). A cannula was inserted retrogradely into a superficial vein on the dorsal surface of the hand. This hand was kept in a hand-warming unit (air temperature 50–60oC) for 15 min to arterialise the venous drainage of the hand( Reference Gallen and Macdonald 33 ) after which a fasting (8 ml) blood sample was collected and a 2-ml flush of saline was used to keep the cannula patent for further blood sampling. Thereafter, volunteers ingested one of the test drinks (in a randomised, counterbalanced for order and single-blind (the volunteer) fashion) containing either MLK20, 20 (MYC20), MYC40, MYC60 or MYC80, within a total fluid volume of 650 ml. Volunteers were instructed to consume the test drink within 5 min, with the first visit providing the precise time to be repeated on subsequent visits to minimise any effect that speed of consumption may have on observed plasma amino acid kinetics. Completion of drink consumption signified the beginning of a 4-h postprandial testing period. Further indirect calorimetry measurements were taken for the final 15 min of each hour (with the final 5 min used to determine energy expenditure as described above) in order to quantify the thermic effect of protein ingestion. Given the error in such indirect calorimetry measurements being general accepted as 5–10 %( Reference Bader, Bosy-Westphal and Dilba 34 ), we assumed that we would detect a thermic effect of protein ingestion only if the value increased by >10 %. Further VAS scales were also completed every 30 min throughout the postprandial period. Additional arterialised venous blood samples were collected from the hand cannula at 15, 30, 45, 60, 90, 120, 150, 180, 210 and 240 min into the postprandial period, with additional 2 ml saline flushes used after each. Following the final blood collection the cannula was removed, volunteers were provided with a meal, and were then free to leave the laboratory.
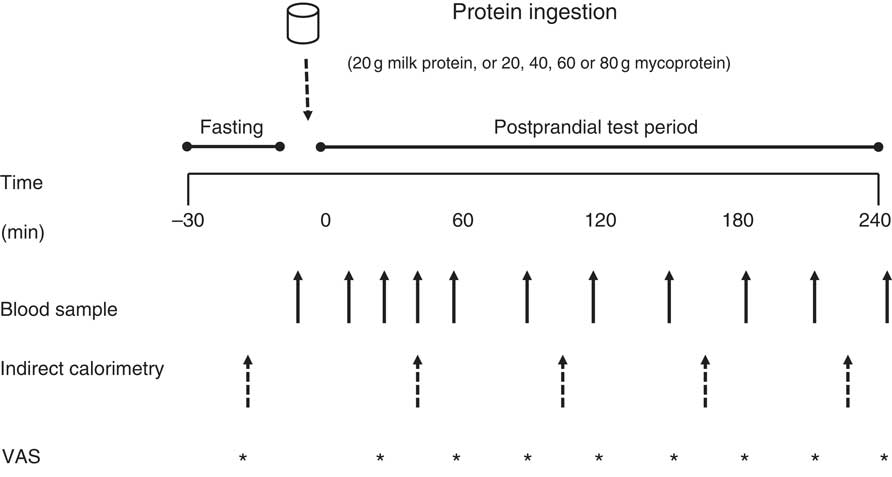
Fig. 1 Overview of the experimental protocol. VAS, visual analogue scale.
Test drink preparation and consumption
Isolated milk was obtained from a commercial supplier (Mega Milk Protein 85; Hench Nutrition Ltd) and freeze-dried mycoprotein was obtained for drink preparation from Marlow Foods Ltd. For detailed safety and nutritional information regarding the production and consumption of mycoprotein( Reference Miller and Dwyer 35 ). Test drinks were prepared by adding the requisite type/amount of protein to 300 ml water and 75 ml non-energetic artificial coconut or caramel flavouring (depending on volunteer preference but maintained the same for all visits within an individual; Jordan’s sugar free skinny syrups; The Protein Pick and Mix Ltd) and mixing thoroughly using a food blender. Water was then added to make up a total volume of 600 ml and mixed again. Following drink consumption by the volunteer an additional 50 ml of water was then added to ‘wash’ the bottle and ensure all protein was consumed, making a total volume of 650 ml consumed by a volunteer with each test drink. All drinks were well tolerated, consumed within the allotted time (i.e. 5 min) and no adverse effects, nauseas or sickness were reported during or after the test day. Following ingestion of each drink, volunteers were asked to identify which condition they thought they had received which was noted down without feedback. The overall success rate for volunteers correctly identifying the condition was 69 %. Individual condition success rates were as follows: MLK20, 78 %; MYC20, 67 %; MYC40, 78 %; MYC60, 67 %; MYC80, 56 %. The nutritional content and amino acid composition of the different drinks are presented in Table 2.
Table 2 Nutritional content of the test drinks
MLK20, 20 g milk protein; MYC20, 20 g mycoprotein; MYC40, 40 g mycoprotein; MYC60, 60 g mycoprotein; MYC80, 80 g mycoprotein; EAA, total essential amino acids; NEAA, total non-essential amino acids; BCAA, total branched chain amino acids.
Blood sample collection and analyses
Each blood sample, 4 ml, was collected into EDTA containing tubes (BD vacutainer LH; BD Diagnostics, Nu-Car) and centrifuged immediately at 3000 g at 4°C for 10 min. Blood plasma was obtained, then aliquoted and frozen at –80°C for subsequent analyses. The remaining 4 ml of each blood sample was collected into additional vacutainers (BD vacutainers SST II) which were left to clot at room temperature for at least 60 min and then centrifuged at 3000 g and 21°C for 15 min to obtain blood serum. Serum was then removed and aliquoted before freezing at –80°C for subsequent analyses.
Plasma amino acid profiles were determined via liquid chromatography-MS. Full details of the methods used are provided in the online Supplementary material. In brief, proteins were precipitated out from the samples. The supernatant was then filtered and derivitised with the addition of stable isotope-labelled amino acid internal standards ((L-amino acid mix; Sigma-Aldrich Co.). Thereafter, HPLC-ESI-MS/MS quantitative analysis of amino acids in plasma was performed using an Agilent 6420B triple quadrupole (QQQ) mass spectrometer (Agilent Technologies) hyphenated to a 1200 series Rapid Resolution HPLC system (Agilent Technologies). Data analysis was undertaken using Agilent Mass Hunter Quantitative analysis software for QQQ (version B.07.01). Accurate quantification used the stable isotope-labelled internal standards added during sample extraction.
Serum insulin concentrations were determined in duplicate using a commercially available ELISA assay kit (Oxford Biosystems Ltd) with a within-batch CV of 3·2 %. Serum uric acid concentrations were determined enzymatically via colorimetry (Cobas 8000 automated analyser; Roche Diagnostics) as described previously( Reference Town, Gehm and Hammer 36 ) with a within-batch CV of 2·6 %. Plasma glucose, urea, creatinine and additional electrolyte/clinical chemistry profiles were determined using an automated analyser (Stat profile pHOx ultra analyzer; Nova Biomedical).
Statistical analyses and data presentation
Due to this being the first study dedicated to assessing the plasma bioavailability of mycoprotein-derived amino acids in vivo following graded intakes, it was not possible to calculate an effect size and therefore perform a statistical power analysis to calculate the number of subjects required to observe significant effects. As such, we chose the number of subjects required based on our knowledge and experience of the variability in investigating the bioavailability of plasma amino acids derived from alternate dietary protein sources( Reference Wall, Hamer and de Lange 22 , Reference Pennings, Boirie and Senden 37 – Reference Tang, Moore and Kujbida 39 ), coupled with our hypothesis that a steep dose–response approach as used in the present study would result in disparate plasma amino acid profiles.
All data are expressed as means with their standard errors. Fasting and postprandial kinetic responses for each of the variables are displayed in two separate graphs to avoid congestion, and present a clear comparison in one graph of MLK20 v. its mass (MYC20) and protein (MYC40) matched conditions, and a second graph allowing the mycoprotein dose–response relationship to be visualised (i.e. comparing MYC20, MYC40, MYC60 and MYC80). However, for all parameters, all five conditions were compared within the same statistical test, and analysed with a two-way ANOVA with repeated measures (with condition and time as factors). In the event of a significant main effect, Bonferroni post hoc tests were applied to locate individual differences, with each postprandial value being compared with the corresponding fasting value so the impact of protein ingestion within each condition could be evaluated. Where AUC were calculated, a one-way ANOVA was performed to detect any significant effect of treatment. If a significant main effect was detected, multiple t tests were used to compare each condition with each other. Plasma biochemistry profiles, indirect calorimetry and VAS data were averaged as fasting, early postprandial (average of all data collected within the first 2 h post protein consumption) and late postprandial (average of all data collected 2–4 h post protein consumption) responses and analysed with a two-way ANOVA and Bonferroni post hoc tests as described above. Statistical significance was set at P<0·05. All calculations were performed by using GraphPad Prism version 7.0 (GraphPad Software).
Results
Plasma amino acid concentrations
Fasting and postprandial plasma amino acid concentrations are shown in Fig. 2 and 3. From similar fasting levels, plasma total amino acid concentrations (Fig. 2(A) and (B)) increased with protein ingestion (time effect: P<0·0001) and by differing degrees depending upon condition (time×treatment interaction effect; P<0·001). MLK20 exhibited the most rapid peak concentration (30 min) and remained elevated relatively briefly for only 45 min. Conversely, mycoprotein conditions generally showed a more delayed rise to peak concentrations, with a more sustained availability: MYC40, MYC60 and MYC80 peaked between 45 and 120 min, but stayed elevated above fasting levels for between 120 and 240 min. MYC20 did not show a significant rise in postprandial total amino acid concentrations. When expressed as an AUC (Fig. 2(C)), a significant treatment effect on 4 h postprandial total amino acid availability was detected (P<0·05) indicating a dose–response effect, with individual responses showing MYC60 and MYC80 were greater when compared with MYC20 (both P<0·05), and MYC80 greater when compared with MYC40 (P<0·05).
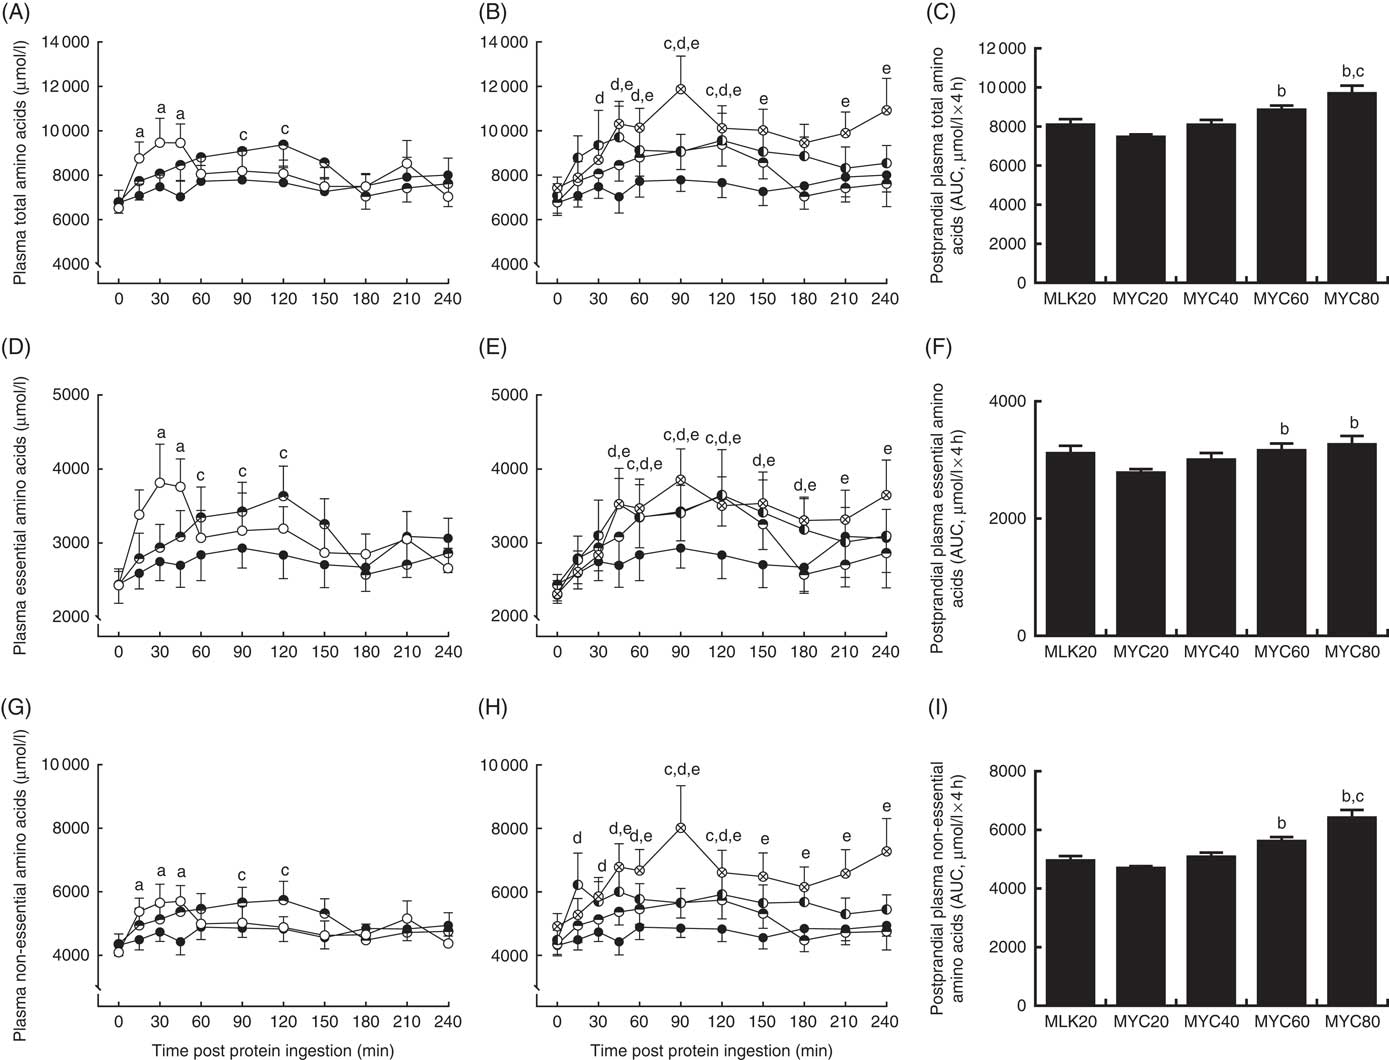
Fig. 2 Plasma total (A and B), total essential (D and E) and total non-essential (G and H) amino acid concentrations in the fasting state (t=0) and at regular intervals during a 4-h postprandial period following the ingestion of 20 g milk protein (MLK20), or 20 g (MYC20), 40 g (MYC40), 60 g (MYC60) or 80 g (MYC80) mycoprotein in healthy, young men (n 12). Values are means, with their standard errors represented by vertical bars. A, D, G: ![]() , MLK20;
, MLK20; ![]() , MYC20;
, MYC20; ![]() , MYC40 and B, E, H:
, MYC40 and B, E, H: ![]() , MYC20;
, MYC20; ![]() , MYC40;
, MYC40; ![]() , MYC60;
, MYC60; ![]() , MYC80. For each variable, data are separated into two graphs for clear comparison of relevant conditions, but all conditions were statistically analysed together with two-way repeated measures ANOVA and Bonferroni post hoc tests applied to locate individual differences: a, b, c, d and e indicate value different from corresponding fasting value for MLK20, MYC20, MYC40, MYC60 and MYC80 conditions, respectively. Data are also expressed as AUC for the total 4 h postprandial responses for total (C), essential (F) and non-essential (I) amino acids. Data were analysed for a main effect with a one-way ANOVA and individual t tests were applied to locate individual differences: a, b, c and d indicate value different from value for MLK20, MYC20, MYC40 and MYC60 conditions, respectively.
, MYC80. For each variable, data are separated into two graphs for clear comparison of relevant conditions, but all conditions were statistically analysed together with two-way repeated measures ANOVA and Bonferroni post hoc tests applied to locate individual differences: a, b, c, d and e indicate value different from corresponding fasting value for MLK20, MYC20, MYC40, MYC60 and MYC80 conditions, respectively. Data are also expressed as AUC for the total 4 h postprandial responses for total (C), essential (F) and non-essential (I) amino acids. Data were analysed for a main effect with a one-way ANOVA and individual t tests were applied to locate individual differences: a, b, c and d indicate value different from value for MLK20, MYC20, MYC40 and MYC60 conditions, respectively.

Fig. 3 Plasma total branched chain amino acid (A and B), leucine (D and E), isoleucine (G and H) and valine (J and K) concentrations in the fasting state (t=0) and at regular intervals during a 4-h postprandial period following the ingestion of 20 g milk protein (MLK20), or 20 g (MYC20), 40 g (MYC40), 60 g (MYC60) or 80 g (MYC80) mycoprotein in healthy, young men (n 12). Values are means, with their standard errors represented by vertical bars. A, D, G, J: ![]() , MLK20;
, MLK20; ![]() , MYC20;
, MYC20; ![]() , MYC40 and B, E, H, K:
, MYC40 and B, E, H, K: ![]() , MYC20;
, MYC20; ![]() , MYC40;
, MYC40; ![]() , MYC60;
, MYC60; ![]() , MYC80. For each variable, data are separated into two graphs for clear comparison of relevant conditions, but all conditions were statistically analysed together with two-way repeated measures ANOVA and Bonferroni post hoc tests applied to locate individual differences: a, b, c, d and e indicate value different from corresponding fasting value for MLK20, MYC20, MYC40, MYC60 and MYC80 conditions, respectively. Data are also expressed as AUC for the total 4 h postprandial responses for total branched chain amino acids (C), leucine (F), isoleucine (I) and valine (L). Data were analysed for a main effect with a one-way ANOVA and individual t tests were applied to locate individual differences: a, b, c and d indicate value different from value for MLK20, MYC20, MYC40 and MYC60 conditions, respectively.
, MYC80. For each variable, data are separated into two graphs for clear comparison of relevant conditions, but all conditions were statistically analysed together with two-way repeated measures ANOVA and Bonferroni post hoc tests applied to locate individual differences: a, b, c, d and e indicate value different from corresponding fasting value for MLK20, MYC20, MYC40, MYC60 and MYC80 conditions, respectively. Data are also expressed as AUC for the total 4 h postprandial responses for total branched chain amino acids (C), leucine (F), isoleucine (I) and valine (L). Data were analysed for a main effect with a one-way ANOVA and individual t tests were applied to locate individual differences: a, b, c and d indicate value different from value for MLK20, MYC20, MYC40 and MYC60 conditions, respectively.
Fasting levels of essential amino acids (Fig. 2(D) and (E)) were equivalent between conditions. Protein ingestion led to a rise in plasma essential amino acid concentrations (time effect; P<0·0001) which differed across conditions (time×treatment interaction; P<0·05). Specifically, plasma essential amino acid concentrations increased briefly from 30 to 45 min in MLK20 (P<0·05), were unaffected in MYC20 (P>0·05) and increased in a more sustained manner (but less rapidly compared with MLK20) in MYC40 (from 60 to 120 min; P<0·05), MYC60 (from 45 to 180 min; P<0·05) and MYC80 (from 45 to 240 min; P<0·05). The AUC of the essential amino acid response (Fig. 2(F)) to protein ingestion showed an effect of treatment (P<0·05) indicating a dose–response relationship, with MYC60 and MYC80 conditions being significantly greater compared with MYC20 (both P<0·05).
From equivalent fasting values, plasma non-essential amino acid concentrations (Fig. 2(G) and (h)) increased with protein ingestion (time effect; P<0·0001) in a varying manner depending upon condition (time×treatment interaction; P<0·01). Specifically, MLK20 showed a sharp, transient rise between 15 and 45 min (P<0·01) into the postprandial period, MYC20 did not change, MYC40 displayed a relatively slower increase (90–120 min), whereas MYC60 and MYC80 exhibited more sustained elevations (from 15 to 120 and 45 to 240 min, respectively (both P<0·05)). Non-essential amino acid AUC (Fig. 2(I)) also showed a significant dose–response relationship (P<0·05), with MYC60 showing a greater response compared with MYC20 (P<0·05) and MYC80 being higher than both MYC20 (P<0·05) and MYC40 (P<0·05).
Plasma total branched chain amino acids (Fig. 3(A) and (B)), from similar fasting values (MLK20: 488 (sem 31) µmol/l, MYC20: 442 (sem 51) µmol/l, MYC40: 459 (sem 41) µmol/l, MYC60: 497 (sem 57) µmol/l, MYC80: 526 (sem 52) µmol/l), showed a significant effect of time (P<0·0001) and a time×treatment interaction (P<0·0001). Postprandial branched chain amino acid concentrations in MLK20 were elevated above fasting levels from 15 to 90 min (P<0·05) and peaked at 45 min (848 (sem 102) µmol/l), did not change in MYC20 (though numerically peaking at 90 min; 581 (sem 54) µmol/l), were raised in MYC40 from 45 to 150 min (P<0·05) and peaking at 120 min (752 (sem 80) µmol/l), and were elevated in MYC60 and MYC80 from 45 to 240 min (P<0·05), both peaking at 120 min (831 (sem 109) and 943 (sem 102) µmol/l, respectively). Plasma postprandial branched chain amino acid concentration AUC (Fig. 3(C)) showed a clear dose–response relationship, with MYC20 displaying lower concentrations than MLK20 (P<0·05) and MYC40, MYC60 and MYC80 all showing greater responses compared with MYC20 (all P<0·05), and MYC80 also significantly higher than MLK20 (P<0·05).
When examining the branched chain amino acids individually, plasma leucine concentrations (Fig. 3(D) and (E)) were influenced by protein ingestion (time effect: P<0·0001) and condition (treatment effect: P<0·05), and a significant time×condition interaction (P<0·0001) was also detected. Specifically, from similar fasting levels (approximately 90 µmol/l), peak postprandial leucine concentrations increased to 201 (sem 24) (at 30 min), 118 (sem 10) (at 90 min), 150 (sem 14) (at 90 min), 173 (sem 23) (at 45 min) and 201 (sem 21) (at 90 min) µmol/l for MLK20, MYC20, MYC40, MYC60 and MYC80, respectively. Individual responses of leucine were similar (but more pronounced) to those observed for the above detailed sub-groups of amino acids. Specifically, MYC20 did not show any individual changes. MLK20 resulted in more rapid, but less sustained leucinaemia (from 15 to 90 min; P<0·05) compared with all mycoprotein conditions >20 g: MYC40, 45–150 min (P<0·05); MYC60, 30–180 min (P<0·05); and MYC80, 45–240 min (P<0·05). Postprandial leucine AUC (Fig. 3(F)) also showed a clear dose–response relationship (P<0·05). Specifically, the postprandial leucine response in MYC20 was lower compared with MLK20 (P<0·05), and responses in MYC40, MYC60 and MYC80 were all greater than MYC20 (all P<0·05), and MYC80 also showing a higher level compared with MLK20 (P<0·05) and MYC40 (P<0·05). Plasma isoleucine (time effect; P<0·0001, treatment; P<0·05), interaction P<0·0001) and valine (time effect; P<0·0001, treatment; P=0·015, interaction P<0·01) showed similar main effects to leucine, with individual differences, peaks, concentrations and AUC illustrated in Fig. 3(G)–(L)).
Serum insulin concentrations
Fasting and postprandial serum insulin concentrations are depicted in Fig. 4. Fasting levels did not differ between conditions (MLK, 10·4 (sem 1·9) mU/l; MYC20, 8·7 (sem 1·2) mU/l; MYC40, 8·9 (sem 1·6) mU/l; MYC60, 8·9 (sem 1·5) mU/l; MYC80, 9·0 (sem 1·4) mU/l; P>0·05). Significant effects of time (P<0·0001) and a treatment×time interaction (P<0·0001) were observed. MLK20 resulted in a rapid (at 15 min) but brief (until 30 min; P<0·001) rise in circulating insulin levels, which returned to fasting levels after 45 min. MYC20 did not alter serum insulin concentrations, though MYC40, MYC60 and MYC80 all increased circulating insulin concentrations at 15 min (all P<0·05) and remained elevated until 60 min (MYC40; P<0·01) to 90 min (MYC60 and MYC80; P<0·05). Peak insulin concentrations were observed at 15 min for the MLK20 (21·8 (sem 4·1) mU/l), MYC20 (10·6 (sem 1·6) mU/l) and MYC40 (16·2 (sem 2·9) mU/l) conditions, and after 45 min in MYC60 (19·3 (sem 2·8) mU/l) and MYC80 (22·9 (sem 3·2) mU/l), though the magnitudes of the peaks did not differ (P>0·05). When comparing the overall postprandial insulin response between conditions as an AUC (peaks above baseline) (Fig. 4(C)) MYC20 was lower compared with all other conditions (P<0·05). MLK20 was not different compared with MYC40, and MYC60 (P<0·01) and MYC80 (P<0·01) showed greater responses compared with MLK20, but were not different from MYC40 or from one another.
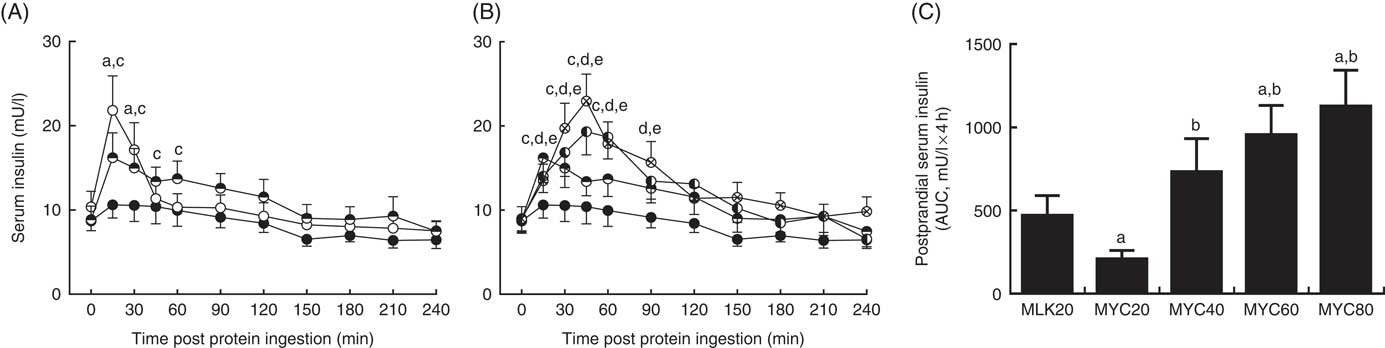
Fig. 4 Serum insulin (A and B) concentrations in the fasting state (t=0) and at regular intervals during a 4-h postprandial period following the ingestion of 20 g milk protein (MLK20), or 20 g (MYC20), 40 g (MYC40), 60 g (MYC60) or 80 g (MYC80) mycoprotein in healthy, young men (n 12). Values are means, with their standard errors represented by vertical bars. A: ![]() , MLK20;
, MLK20; ![]() , MYC20;
, MYC20; ![]() , MYC40 and B:
, MYC40 and B: ![]() , MYC20;
, MYC20; ![]() , MYC40;
, MYC40; ![]() , MYC60;
, MYC60; ![]() , MYC80. Data are separated into two graphs for clear comparison of relevant conditions, but all conditions were statistically analysed together with a two-way repeated measures ANOVA and Bonferroni post hoc tests applied to locate individual differences: a, b, c, d and e indicate value different from corresponding fasting value for MLK20, MYC20, MYC40, MYC60 and MYC80 conditions, respectively. Data are also expressed as AUC for the total 4 h postprandial response (C). Data were analysed for a main effect with a one-way ANOVA and individual t tests were applied to locate individual differences: a, b, c and d indicate value different from value for MLK20, MYC20, MYC40 and MYC60 conditions, respectively.
, MYC80. Data are separated into two graphs for clear comparison of relevant conditions, but all conditions were statistically analysed together with a two-way repeated measures ANOVA and Bonferroni post hoc tests applied to locate individual differences: a, b, c, d and e indicate value different from corresponding fasting value for MLK20, MYC20, MYC40, MYC60 and MYC80 conditions, respectively. Data are also expressed as AUC for the total 4 h postprandial response (C). Data were analysed for a main effect with a one-way ANOVA and individual t tests were applied to locate individual differences: a, b, c and d indicate value different from value for MLK20, MYC20, MYC40 and MYC60 conditions, respectively.
Serum uric acid concentrations
Serum uric acid concentrations in the fasting state and over a 4-h postprandial period following protein ingestion are depicted in Fig. 5. Fasting plasma uric acid concentrations were similar in all conditions (MLK20, 338 (sem 21) µmol/l; MYC20, 362 (sem 17) µmol/l; MYC40, 354 (sem 18) µmol/l; MYC60, 365 (sem 20) µmol/l; MYC80, 350 (sem 12) µmol/l; P>0·05). There were significant time (P<0·0001), treatment (P<0·01) and time×treatment interaction (P<0·0001) effects detected. In MLK20 and MYC40 fasting plasma uric acid concentrations remained unaltered across the postprandial period. MYC20 had minimal impact on serum uric acid concentrations, though there was a significant decrease at 150 min (P<0·05) only. With MYC60 uric acid concentrations increased modestly by 30 min (P<0·05), and remained elevated until 150 min before returning to fasting values, with the peak concentration of 387 (sem 20) µmol/l occurring 60 min after protein ingestion (P<0·0001). Similarly, MYC80 resulted in an increase in serum uric acid concentrations by 30 min (P<0·01) with levels again peaking at 60 min (at 378 (sem 13) µmol/l; P<0·0001) and, despite then decreasing back towards fasting levels, remaining elevated throughout the entire postprandial period (P<0·05).
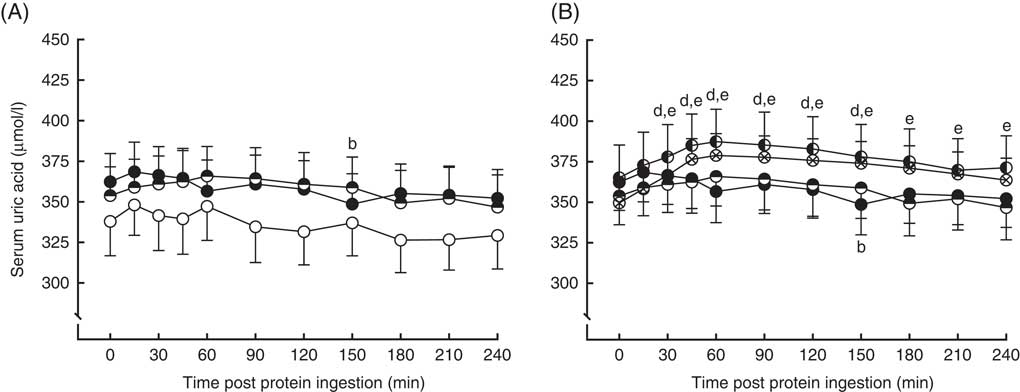
Fig. 5 Serum uric acid (A and B) concentrations in the fasting state (t=0) and at regular intervals during a 4-h postprandial period following the ingestion of 20 g milk protein (MLK20), or 20 g (MYC20), 40 g (MYC40), 60 g (MYC60) or 80 g (MYC80) mycoprotein in healthy, young men (n 12). Values are means, with their standard errors represented by vertical bars. A: ![]() , MLK20;
, MLK20; ![]() , MYC20;
, MYC20; ![]() , MYC40 and B:
, MYC40 and B: ![]() , MYC20;
, MYC20; ![]() , MYC40;
, MYC40; ![]() , MYC60;
, MYC60; ![]() , MYC80. Data are separated into two graphs for clear comparison of relevant conditions, but all conditions were statistically analysed together with a two-way repeated measures ANOVA and Bonferroni post hoc tests applied to locate individual differences: a, b, c, d and e indicate value different from corresponding fasting value for MLK20, MYC20, MYC40, MYC60 and MYC80 conditions, respectively.
, MYC80. Data are separated into two graphs for clear comparison of relevant conditions, but all conditions were statistically analysed together with a two-way repeated measures ANOVA and Bonferroni post hoc tests applied to locate individual differences: a, b, c, d and e indicate value different from corresponding fasting value for MLK20, MYC20, MYC40, MYC60 and MYC80 conditions, respectively.
Whole body energy expenditure
Resting 24 h energy expenditure in the fasting state and during the early (0–2 h) and late (2–4 h) postprandial period following the ingestion of dietary protein is displayed in Fig. 6. Fasting 24 h energy expenditure was equivalent between visits (MLK20, 9·9 (sem 0·4) MJ; MYC20, 9·4 (sem 0·4) MJ; MYC40, 9·8 (sem 0·5) MJ; MYC60, 9·3 (sem 0·3) MJ; MYC80, 9·1 (sem 0·5) MJ; P>0·05). Time (P<0·05) and time×treatment interaction (P<0·001) effects were observed such that protein ingestion resulted in a significant decrease in energy expenditure in MLK20 during the late phase (P<0·05), and an increase in energy expenditure in the MYC60 condition during the early postprandial phase (P<0·0001) and in the MYC80 condition during both the early (P<0·0001) and late (P<0·001) postprandial phases.
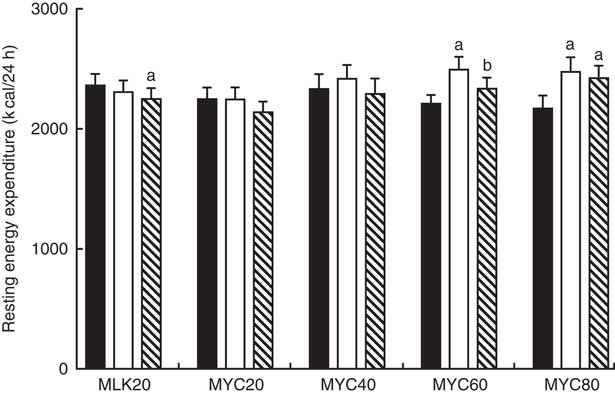
Fig. 6 Resting energy expenditure in the fasting (![]() ) state and during the early (
) state and during the early (![]() ) (i.e. 0·2 h) and late (
) (i.e. 0·2 h) and late (![]() ) (i.e. 2–4 h) phases of a 4-h postprandial period following the ingestion of 20 g milk protein (MLK20), or 20 g (MYC20), 40 g (MYC40), 60 g (MYC60) or 80 g (MYC80) mycoprotein in healthy, young men (n 12). Values are means, with their standard errors represented by vertical bars. Data were analysed with a two-way repeated measures ANOVA and Bonferroni post hoc tests applied to locate individual differences: a and b indicate value different from corresponding fasting or early postprandial value, respectively. To convert kcal to kJ, multiply by 4·184.
) (i.e. 2–4 h) phases of a 4-h postprandial period following the ingestion of 20 g milk protein (MLK20), or 20 g (MYC20), 40 g (MYC40), 60 g (MYC60) or 80 g (MYC80) mycoprotein in healthy, young men (n 12). Values are means, with their standard errors represented by vertical bars. Data were analysed with a two-way repeated measures ANOVA and Bonferroni post hoc tests applied to locate individual differences: a and b indicate value different from corresponding fasting or early postprandial value, respectively. To convert kcal to kJ, multiply by 4·184.
Appetite responses
In the fasting state, appetite scores were similar between all conditions at approximately 62 (P>0·05). Appetite score was affected by protein ingestion (time effect; P<0·0001) and condition (treatment effect; P<0·05), though only a trend for an interaction between time and treatment was observed (interaction effect; P=0·097). Specifically, all conditions showed a reduced appetite score 30 min following protein ingestion (all P<0·01) which persisted to 60 min in MLK20 (P<0·05) and MYC20 (P<0·01) conditions, and until 120 min in the MYC80 condition (P<0·001) before returning towards fasting levels. Compared with fasting values, all conditions showed a significantly greater appetite score for the final 60 (MLK20 and MYC20 conditions; P<0·01) or 90 min (MYC40 and MYC60 conditions; P<0·05) of the postprandial period, with the exception of the MYC80 condition where this increase in appetite was not evident. Fig. 7 depicts these data as fasting, mean early (30–120 min) and mean late (150–240 min) appetite responses.
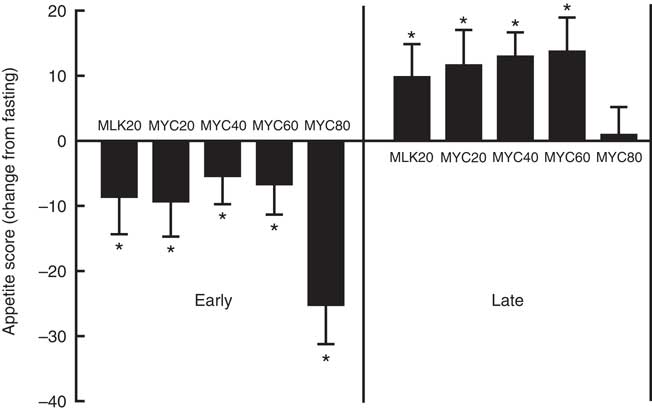
Fig. 7 Change (from fasting) in appetite score during the early (i.e. 0–2 h) and late (i.e. 2–4 h) phases of a 4-h postprandial period following the ingestion of 20 g milk protein (MLK20), or 20 g (MYC20), 40 g (MYC40), 60 g (MYC60) or 80 g (MYC80) mycoprotein in healthy, young men (n 12). Values are means, with their standard errors represented by vertical bars. Data were analysed with a two-way repeated measures ANOVA and Bonferroni post hoc tests applied to locate individual differences: * Significant change from fasting levels.
Plasma biochemistry profile
Plasma clinical biochemistry profiles are reported in Table 3. For written descriptions and statistical analyses of plasma biochemistry responses please see the online Supplementary material.
Table 3 Plasma clinical chemistry profiles in the fasting state and average values of samples collected during the early (0–2 h) and late (2–4 h) postprandial periods following the ingestion of 20 g milk protein (MLK20), or 20 g (MYC20), 40 g (MYC40), 60 g (MYC60) or 80 g (MYC80) mycoprotein in healthy, young men (n 12) (Mean values with their standard errors)
* Significant difference to corresponding fasting value.
† Significant difference to corresponding early postprandial phase value.
Discussion
In the present study we investigated the postprandial circulating amino acid and insulin responses to mycoprotein ingestion. We assessed mycoprotein both in comparison with a more typical animal-derived protein (milk protein), and in a dose–response manner, in young healthy men. Mycoprotein ingestion resulted in equivalent 4 h postprandial availability of serum insulin, and plasma total, essential, non-essential and branched chain amino acids when compared with milk protein. Mycoprotein, however, resulted in slower (and lower) peak plasma postprandial amino acid and insulin concentrations, likely explained by delayed digestion and absorption kinetics as a result of the high fibre content. Increasing the ingested dose of mycoprotein resulted in a corresponding increase in plasma amino acid availability and augmented the serum insulin response, with evidence to suggest these responses begin to plateau at a dose of 60–80 g.
We first compared the response of a ‘mass matched’ meal-like bolus of mycoprotein v. milk protein (i.e. MLK20 v. MYC20). Milk protein was selected as a reference protein due to its prevalence as a protein rich food (i.e. not a supplement) within most diets, as well as commonly studied as a near ‘gold standard’ protein source with respect to muscle protein anabolism( Reference Elliot, Cree and Sanford 40 , Reference Mitchell, McGregor and D’Souza 41 ). Despite the practical relevance of this comparison, due to its high fibre content, mycoprotein is <50 % protein (Table 2). Consequently, the greater plasma amino acid and insulin responses following mass matched milk protein ingestion (Fig. 2–4) were not surprising. When comparing milk and mycoprotein on a protein matched basis (i.e. MLK20 v. MYC40) the bioavailability of all amino acids (Fig. 2–3) and insulin (Fig. 4) were equivalent between conditions. Worthy of note, the similar branched chain amino acid and leucine load between the two proteins became equivalently available over the 4 h postprandial period. By way of comparison, previous investigations of other plant-based proteins (soy and wheat) have shown that their ingestion results in lower essential amino acid and leucine bioavailability compared with milk-derived (whey and/or casein) proteins on a gram for gram basis( Reference Gorissen, Horstman and Franssen 8 , Reference Tang, Moore and Kujbida 39 ). Collectively, and within the context of previous studies examining the muscle anabolic responsiveness to milk protein( Reference Elliot, Cree and Sanford 40 , Reference Mitchell, McGregor and D’Souza 41 ), our data infer that a 40-g bolus of mycoprotein provides sufficient hyperaminoacidaemia (and insulinaemia) to mount a robust muscle protein synthetic response in healthy individuals.
The speed and magnitude of the postprandial plasma amino acid (and leucine in particular) peak has been highlighted as a key parameter dictating the postprandial muscle protein synthetic response( Reference Wall, Hamer and de Lange 22 , Reference Pennings, Boirie and Senden 37 , Reference West, Burd and Coffey 42 ). The ingestion of milk protein resulted in a more rapid rise in plasma essential amino acids (30 v. 120 min, respectively) and leucine (30 v. 90 min, respectively) compared with 40 g mycoprotein. In addition, both of these responses were also of a greater magnitude, suggesting the milk may have the capacity to mount a greater muscle protein synthetic response. The differential digestion and absorption kinetics are likely explained by the additional fibre contained within mycoprotein, delaying gastric emptying( Reference Hlebowicz, Wickenberg and Fahlström 43 ) and/or intestinal amino acid absorption( Reference Rigaud, Paycha and Meulemans 44 ). Indeed, given the almost identical leucine and branched chain amino acid loads (and bioavailability) of mycoprotein, any superior anabolic potential of milk is likely directly attributable to the fibre induced slowing of the digestion and absorption kinetics. Presumably as a direct result of this, when matched for protein content, mycoprotein also led to a more modest insulin response compared with milk protein. It has previously been shown that insulin is permissive, rather than stimulatory, in mediating postprandial muscle protein synthesis rates( Reference Greenhaff, Karagounis and Peirce 24 , Reference Phillips 45 ). That is to say, any rise from basal insulin levels in the postprandial state seems sufficient to facilitate the muscle protein synthetic response, at which point amino acids alone provide the key nutritional signal dictating the magnitude of response( Reference Greenhaff, Karagounis and Peirce 24 , Reference Phillips 45 , Reference Gorissen, Burd and HM 46 ). As such, the insulin response to the ingestion of 40 g mycoprotein would be unlikely to limit postprandial muscle protein synthesis rates. It should be noted, however, that a greater insulin response (for instance with increasing dose or with carbohydrate co-ingestion) may further inhibit postprandial proteolysis and thus contribute to the net anabolic response( Reference Greenhaff, Karagounis and Peirce 24 ).
Despite the faster digestion absorption kinetics of milk protein, the relevance of rapid hyperaminoacidaemia to the anabolic response has recently been challenged( Reference Mitchell, Phillips and Williams 47 ). Mitchell et al. observed equivalent muscle protein synthetic responses following essential amino acid administration ingested either as a single 15 g bolus (i.e. rapid hyperaminoacidaemia) or in a pulsatile fashion (4×3·75 g every 45 min; i.e. slower, less pronounced hyperminoacidaemia), albeit in older men. These findings suggest that the overall amount and subsequent bioavailability of essential amino acids within a dietary protein source are of more relevance in determining the magnitude of the muscle protein synthetic response. This underlines the importance of our present finding that dietary amino acids derived from mycoprotein are equivalently bioavailable when compared on a gram for gram basis with those derived from milk protein (which is typically not the case concerning plant-based proteins( Reference Gorissen, Horstman and Franssen 8 , Reference van Vliet, Burd and van Loon 9 , Reference Tang, Moore and Kujbida 39 )). Furthermore, in Mitchell et al.’s study, though the 4-h period during which muscle protein synthesis rates were determined provided equivalent responses between bolus and pulse feeding, the final 2 h of the experimental period favoured the pulse approach, presumably due to the more sustained amino acid availability. As such, an important question remains: would the more slowly digested/absorbed, more sustained availability of amino acids (and insulin) following mycoprotein result in improved muscle anabolism compared with ‘faster’ proteins, particularly over more prolonged postprandial periods?
Coupled with comparing mycoprotein with a reference animal-derived protein, we also sought to assess the impact of graded doses of mycoprotein. We observed a clear dose–response relationship, with 60>40>20 g regarding total postprandial amino acid and insulin availability and magnitude of responses. Increasing the dose of mycoprotein up to 60 g did not delay the rise to peak in plasma concentrations, and in the case of total amino acids, non-essential amino acids and leucine, appeared to expedite the responses (30, 15 and 30 min, respectively, compared with 45–90 min for other mycoprotein conditions). Despite a more rapid peak than other mycoprotein conditions, 60 g led to sustained hyperaminoacidaemia for 3–4 h post ingestion, which would provide the relevant signalling amino acids as well as substrate to enable a sustained muscle protein synthetic response. The 60 g bolus also contains close to what is considered the optimal leucine content to facilitate a maximal muscle protein synthetic response (i.e. ≥2·5 g)( Reference van Vliet, Burd and van Loon 9 , Reference Katsanos, Kobayashi and Sheffield-Moore 21 , Reference Wall, Hamer and de Lange 22 ), and this became available rapidly and to an overall greater degree during the 4-h postprandial period compared with lower doses of mycoprotein or milk protein. It is generally regarded that a marked acceleration of whole body amino acid oxidation following protein ingestion is indicative of excessive amino acid availability( Reference Moore, Robinson and Fry 48 , Reference Zello, Wykes and Ball 49 ). Though amino acid oxidation rates were not measured in this study, the absence of any rise in plasma urea concentrations following the 60 g condition (Table 3) suggests minimal changes, and that the body protein pool would primarily be making use of this dietary protein for synthetic processes. In support of this assertion, studies that have established an approximate dose of 20 g whey or egg protein as sufficient for a maximal stimulation of muscle protein synthesis rates( 27 , Reference Zykova, Storhaug and Toft 50 ) have generally observed minimal increases in amino acid oxidation rates and plasma urea concentrations/production rates at these doses, with increases only evident with increasing amounts. Collectively, these data suggest that the ingestion of 60 g mycoprotein (i.e. 27 g protein) would be ample for the optimal stimulation of muscle protein synthesis rates in healthy young men.
Increasing the dose of mycoprotein ingestion from 60 to 80 g did not substantially alter postprandial amino acid availability. Indeed, no amino acid (or subgroup) showed a significantly greater AUC in the 80 g compared with the 60 g condition, and various amino acid peaks exhibiting delayed kinetics in the 80 g condition. Plasma urea concentrations rose sharply in both the early (8 %) and late (13 % ) postprandial periods following the ingestion of 80 g mycoprotein (Table 3), implying this large amount of protein was an ‘overload’ and required a marked rise in oxidation to restore blood homeostasis. This is in keeping with previous studies that have established similar metabolic effects of protein boluses in excess of what is required for optimally stimulating muscle protein synthesis rates( Reference Moore, Robinson and Fry 48 , Reference Witard, Jackman and Breen 51 ). Coupled with this, ordinary blood biochemistry was altered substantially (and differentially compared with other conditions) only in MYC80, also implying this was an excessive dose to support normal metabolism. Taken together, it seems likely that increasing the dose from 60 to 80 g of mycoprotein would not convey any benefits with respect to the stimulation of muscle protein synthesis rates in healthy young men. It should be noted, however, that most postprandial plasma amino acid parameters (with the exception of total essential amino acids) and insulin levels were numerically higher when compared with the 60 g mycoprotein condition, and remained consistently elevated for the entire 4 h postprandial period (selected as a typical ‘real world’ postprandial period before subsequent meal consumption) in the 80 g mycoprotein condition only. This may be of relevance when considering postprandial periods expected to extend beyond 4 h. For example, pre-sleep protein is an increasingly popular strategy for augmenting muscle protein synthesis rates during the extended overnight period( Reference Holwerda, Kouw and Trommelen 52 – Reference Wall, Burd and Franssen 56 ), an approach also shown to augment the adaptive response to prolonged training( Reference Snijders, Res and Smeets 57 ). Likely as a consequence of this extended overnight postprandial period, these studies have suggested that ‘slower proteins’ capable of facilitating more prolonged hyperaminoacidaemia, and in relatively larger doses, may be optimal for the stimulation of muscle protein synthesis rates. Consequently, this would provide a rationale for why a larger dose of mycoprotein (e.g. 80 g) may be a suitable dietary protein source to use as a pre-sleep strategy aimed at optimising overnight muscle protein synthesis rates. Additional considerations for the potential utility of the 80 g condition involve situations where the dose–response relationship is likely shifted to the right; for instance the presence of anabolic resistance to dietary protein with ageing( Reference Wall, Gorissen and Pennings 58 ) or disuse( Reference Wall, Dirks and Snijders 59 ).
Previous work has shown the ingestion of large quantities of nucleotides to result in acute hyperuricaemia above clinically accepted levels( Reference Edozien, Udo and Young 29 , Reference Waslien, Calloway and Margen 30 , 60 ), which has raised concerns over the chronic consumption of nucleotide containing protein sources( Reference Zykova, Storhaug and Toft 50 , Reference Villegas, Xiang and Elasy 61 ). Mycoprotein (and other plant-based protein sources) generally contain a lower nucleotide load compared with meat/fish-derived protein sources( Reference Hayman and Marcason 62 ). In keeping with this, we report that the ingestion of moderate doses of mycoprotein (≤40 g) does not modulate serum uric acid concentrations (Fig. 5) and, in the case of the 20 g dose, actually had a modest and transient lowering effect. The ingestion of 60 and 80 g resulted in elevated serum uric acid concentrations and, for the latter, this persisted for the 4-h postprandial period. These levels increased from approximately 350–370 to 380–390 µmol/l and thus did not approach a clinically significant concentration for men (i.e. >420 µmol/l)( Reference Duskin-Bitan, Cohen and Goldberg 28 , 60 ). It should also be noted that even with serum uric acid levels >420 µmol/l, this is only a recognised predictor of gout and/or metabolic complications when existing chronically and in the fasting state, rather than during daily oscillations in response to nutrition( Reference Duskin-Bitan, Cohen and Goldberg 28 ). Indeed, while circulating uric acid levels are elevated with gout, gout per se does not necessarily lead to elevated serum uric acid( Reference Duskin-Bitan, Cohen and Goldberg 28 ). As such, it remains to be established if hyperuricaemia is a cause or consequence of the clinical condition(s) that it predicts.
Research has highlighted the key role that dietary protein plays in weight management and the promotion of cardio-metabolic health( Reference Westerterp-Plantenga, Lemmens and Westerterp 63 ). Central to this role are the thermogenic and satiating properties that dietary protein possesses( Reference Westerterp-Plantenga, Lemmens and Westerterp 63 ). In line, we report that mycoprotein mounts a robust thermogenic effect, which we specifically detected at the 60 and 80 g doses (Fig. 6), and a satiating effect under all conditions, comparable to milk protein and sustained over the entire 4 h postprandial period only in the 80 g condition (Fig. 7). It could be speculated that, if consumed in sufficient quantities to elicit optimal aminoacidaemia to support muscle protein anabolism, any concerns with additional energy intake (when considering weight maintenance and metabolic health) would be offset by these satiating and thermogenic properties. Clearly further research is warranted to investigate the role of mycoprotein not only in muscle anabolism, but also in supporting weight maintenance and metabolic health.
To summarise our present data into practical relevance, based on the observed bioavailability we speculate that the ingestion of 40 g mycoprotein (i.e. 18 g total protein) would be sufficient to mount a robust muscle protein synthetic response, with the ingestion of 60 g mycoprotein (i.e. 27 g total protein) likely necessary to provide an optimal anabolic response. It is unlikely that consuming in excess of 60 g would confer any further benefits in healthy individuals. We conclude that mycoprotein represents a bioavailable and insulinotropic non-animal-derived dietary protein. Consumed in sufficient quantities, mycoprotein would be expected to support skeletal muscle anabolism and reconditioning and therefore have clear utility to muscle health in a variety of populations.
Acknowledgements
The authors would like to acknowledge Dr Marlou Dirks for her helpful discussions and edits of this manuscript, Professor Nicholas Smirnoff for lending his expertise and advice concerning the MS work and Dr Mike Jordan and Premier Analytical services for analysing the nutritional composition of the experimental proteins.
The project was sponsored by Marlow Foods Ltd (B. T. W. as grant holder). The University of Exeter (B. T. W.) were responsible for the study design, data collection and analysis, decision to publish and preparation of the manuscript. The private partners have contributed to the project through regular discussion. M. V. D. is supported through the aforementioned grant, S. P. K. is supported from an internal studentship grant in collaboration with Maastricht University.
The authors’ contributions were as follows: M. V. D., J. L. B., T. J. A. F. and B. T. W. designed the research; M. V. D., S. P. K. and B. T. W. conducted the human trials; M. V. D., S. P. K., D. L. S. and B. T. W. performed the biological analyses; M. V. D. and B. T. W. analysed the data, performed the statistical analyses and wrote the manuscript; all authors provided comments and intellectual input on the manuscript; B. T. W. has primary responsibility for the final content. All authors have read and approved the final version of the manuscript.
T. J. A. F. is an employee of Marlow Foods and J. L. B., D. L. S. and B. T. W. are employees of the University of Exeter. The authors declare that there are no conflicts of interest.
Supplementary material
For supplementary material/s referred to in this article, please visit https://doi.org/10.1017/S0007114517002409


