


The analysis of empirical dietary patterns derived using exploratory factor analysis has become increasingly popular in nutritional epidemiology. Factor analysis is a data reduction method, whereby many variables are reduced into a small number of factors that explain the underlying constructs or patterns in the original data. This is an attractive method for nutritional epidemiologists, as dietary assessments usually result in a very large number of correlated nutrition variables. While these create a rich data source, they also provide complex analytical challenges. The advantages of factor analysis have been discussed widely(Reference Newby and Tucker1, Reference Hu2), but arguably the most attractive feature is that it considers the whole diet and the potentially synergistic effects of foods and nutrients, rather than attempting to isolate the effects of individual nutrients or foods, which may be too small to detect(Reference Hu2). Furthermore, focusing on a small number of major dietary patterns in diet–disease analyses requires fewer statistical tests and leads to a reduced likelihood of chance findings.
Despite their limitations(Reference Sempos3), FFQ currently remain the most popular dietary assessment tool for large-scale epidemiological studies. The majority of studies reporting empirical dietary patterns have used FFQ data, yet relatively few studies have reported their relative validity, i.e. how well dietary patterns in a FFQ compare with dietary patterns using a more precise dietary method, such as a food record (FR). Those that have are largely limited to adult populations(Reference Hu, Rimm and Smith-Warner4–Reference Okubo, Murakami and Sasaki8), and very little is known about the relative validity of empirical dietary patterns in child or adolescent populations. Exploring dietary patterns during childhood and adolescence is important for understanding how they can affect short-term and long-term health, including adult health. There is also a lack of information on how empirical dietary patterns track from childhood into adulthood(Reference Mikkilä, Räsänen and Raitakari9), and this kind of information could assist in designing interventions to improve dietary intake. To explore the relative validity of empirically derived dietary patterns in young people, we compared dietary patterns using factor analysis in a FFQ with those identified in a 3 d FR in a cohort of Australian adolescents.
Subjects and methods
Study population
Participants were sourced from the Western Australian Pregnancy Cohort (Raine) Study, which has been described previously(Reference Newnham, Evans and Michael10). Briefly, the Raine Study commenced with 2900 women recruited at 16–20-week gestation between 1989 and 1991. There were 2868 live births and these children have been followed up at regular intervals from gestation onwards. The present analysis uses data collected at the 14-year follow-up.
FFQ
The first complete dietary assessment in this cohort was conducted at the 14-year follow-up, which occurred from 2003 to 2006 (mean age 14 (sd 0·2) years). All 2337 adolescents eligible for the follow-up, i.e. not deceased or withdrawn from the study at 14 years of age, were sent a semi-quantitative FFQ developed by the Commonwealth Scientific and Industrial Research Organization in Adelaide, SA, Australia(Reference Baghurst and Record11). The FFQ assessed usual dietary intake over the previous year, collecting information on the frequency of consumption of 212 individual foods, mixed dishes and beverages, and their usual serving sizes in relation to a standard serving size (in household units). Questions on fruit and vegetable intakes were asked separately for summer and winter. Nutrient intakes estimated by this FFQ have been evaluated against a 3 d FR in this cohort at 14 years of age(Reference Ambrosini, de Klerk and O'Sullivan12). Because of the age of the respondents and their potential difficulty in completing the FFQ, the primary caregiver was asked to complete the FFQ in association with the study adolescent. All FFQ were checked and missing data were clarified with the adolescent. Data entry, data verification and the estimation of average daily food and nutrient intakes were carried out by the Commonwealth Scientific and Industrial Research Organization. Intakes of all 212 foods were collapsed into thirty-eight food groups devised a priori (Appendix 1)(Reference Ambrosini, Oddy and Robinson13). A description of subjects who completed the FFQ has been published elsewhere(Reference Ambrosini, Oddy and Robinson13).
Food records
All subjects eligible for the follow-up at 14 years of age were invited to attend the Telethon Institute for Child Health Research, Perth, WA, Australia, for physical examinations. Those who presented were asked to complete a 3 d FR. The FR was designed to be completed by the adolescents with parental assistance if required. Written instructions and metric measuring cups and spoons were provided to assist with serving size estimations. Adolescents were also asked to record if any of the 3 d in their FR were, in their opinion, not representative of their usual eating habits. This was verified by a dietitian who checked all the returned FR and followed up queries by telephone(Reference Di Candilo, Oddy and Miller14). Of the 1286 subjects who agreed, 962 returned the FR (response fraction = 75 %). Of these, 858 completed a 3 d FR, thirty-five subjects completed a 1 or 2 d FR, forty-four subjects returned an incomplete FR (no full days recorded) and twenty-five subjects returned a blank FR.
All FR were entered into the FoodWorks diet analysis package(15) by a dietitian. Over 4000 foods and beverages were recorded in total. Each item recorded in the FR was matched with a FFQ item where possible and coded to the corresponding food group in Appendix 1. A small number of mixed dishes (n 26) were recorded in the FR without recipe details. These mixed dishes were separated into main components that could be assigned to a FFQ item. For example, a proportion of beef lasagne could be matched with ‘pasta’ and with ‘beef mince-based pasta sauce’ in the FFQ, which then contributed to the ‘refined grains’ and ‘red meat’ food groups, respectively. There were 354 foods that did not match a FFQ item, including various condiments, sauces, beverage bases, artificial sweeteners, gums and vegetables not listed in the FFQ (e.g. eggplant, fennel, artichoke). These foods were coded to the most appropriate food group, with the exception of artificial sweeteners, beverage bases, coconut products, oils and gum, as these did not match any of the a priori food groups. Total intakes for each food group (g/d) were calculated by summing food intakes within each of the thirty-eight food groups. Average daily nutrient intakes were estimated using Australian Food Composition Tables(16).
Biochemistry
Fasting blood samples were collected at the 14-year follow-up by a phlebotomist at the adolescent's home. Biochemical data included fasting serum glucose, total cholesterol, HDL-cholesterol, calculated LDL-cholesterol and TAG. Assays were conducted at PathWest Laboratories, Royal Perth Hospital, using standardised methodologies published elsewhere(Reference Huang, Mori and Burke17). Erythrocytes were isolated and fatty acids were determined using GC as previously described(Reference Murphy, Meyer and Mori18).
Ethics
The Raine Study was conducted according to the guidelines laid down in the Declaration of Helsinki and was approved by the ethics committees of King Edward Memorial Hospital for Women and Princess Margaret Hospital for Children, Perth, WA, Australia. Informed consent was obtained from the adolescent and their primary caregiver at each follow-up.
Statistical analysis
Daily energy intakes < 3000 or>20 000 kJ/d were considered implausible, as in our previous analyses(Reference Ambrosini, Oddy and Robinson13). Only complete 3 d FR were considered for this analysis, as a FR completed for less than 3 d may be less likely to reflect usual intake in adolescents(Reference Livingstone, Robson and Wallace19).
To identify dietary patterns, we conducted separate factor analyses (maximum-likelihood method) for the FFQ(Reference Ambrosini, Oddy and Robinson13) and the FR, using all thirty-eight food group intakes. All subjects who completed the relevant dietary assessment were included in each factor analysis to maximise the factor solution. Using PROC FACTOR in Statistical Analysis Systems software (SAS Institute, Cary, NC, USA)(20), the factor solutions were initially limited to factors with an eigen value >1 and scree plots were used to confirm the maximum number of factors to retain. For the FR factor analysis, it was necessary to downwardly adjust the minimum eigen value in order to retain factors explaining the most variance, as has been suggested by others(21). The factor solutions were rotated using the varimax option to improve interpretation and render independent dietary patterns. The final rotated factor solution provided factor loadings for each factor or dietary pattern. Food groups with very low loadings ( < |0·10|) on all factors were excluded from the final factor solution (i.e. tea, coffee, soya milk, unsaturated and saturated spreads). All food groups included in the final factor solution were used in calculating dietary pattern scores. All subjects received a z-score for each dietary pattern identified in the FFQ and FR and as such, mean dietary pattern scores for the sample were zero. There were no major differences in the factor solutions for boys and girls; therefore, the factor loadings presented are for boys and girls combined.
Three methods were used to examine the relative validity of dietary patterns. First, Spearman's rank correlation coefficients were calculated between dietary pattern scores from each dietary method, and between dietary pattern scores and biomarkers. Second, agreement between dietary pattern scores was determined according to (1) the mean agreement or the mean of differences between scores, e.g. Σ(Western scoreFFQ − Western scoreFR)/n, and (2) the 95 % limits of agreement (LOA), calculated as the mean agreement ± 1·96 (sd of differences), which shows the range in which 95 % of individual differences in dietary pattern scores fall and the spread of overall agreement for the sample(Reference Bland and Altman22). Finally, we calculated Spearman's correlation coefficients between dietary pattern scores and average daily nutrient intakes estimated by the FR, which were adjusted for total energy intake using the residual method(Reference Willett, Stampfer and Willett23). This enabled a comparison of dietary pattern scores according to the nutrient profile using the FR as a standard. An α-level of 0·05 was used for all statistical tests.
Results
A total of 1631 subjects completed the FFQ at the 14-year follow-up (response fraction = 70 %), and of these, eighteen subjects had implausible energy intakes. Of the 858 subjects who completed a 3 d FR, 822 were coded ‘representative of usual intake’ and were included in this analysis. None of the 822 subjects who completed a 3 d FR reported implausible energy intakes. Compared with other cohort members, χ2 tests showed that subjects who completed both dietary assessments (n 783) were more likely to have mothers with ≥ 10 years education (66 v. 58 %, P < 0·0001) and were less likely to be overweight (8 v. 12 % having a BMI>85th percentile for sex and age(Reference Kuczmarski, Ogden and Grummer-Strawn24), P = 0·03), or have a very low family income (16 v. 22 % with ≤ $30 000 AUD/year, P = 0·03).
Dietary patterns
Two major dietary patterns were identified in the FFQ. We subjectively named these patterns as ‘Healthy’ and ‘Western’ (Table 1). The ‘Healthy’ pattern was positively correlated with the intakes of all vegetable types, fresh fruit, legumes, fish (steamed, grilled or canned), whole grains, low-fat dairy and mineral water, and negatively correlated with the intakes of take-away foods, chips and crisps. The ‘Western’ pattern was positively correlated with the intakes of take-away foods, confectionery, soft drinks, crisps, refined grains, red meats, processed meats, fried potato (chips), potato (not fried), high-fat dairy, sauces and dressings, cakes and biscuits, added sugar, fried fish and poultry.
Table 1 Factor loadings for dietary patterns in the FFQ and 3 d food record (FR)

* Factor loadings ≥ |0·20|.
Two similar major dietary patterns were identified in the FR, although their factor loadings were generally weaker than those in the FFQ (Table 1). A ‘Healthy’ pattern similar to that in the FFQ was positively correlated with whole grains, most vegetable types, fresh fruit, fish (steamed, grilled or canned), mineral water and low-fat dairy. The second major dietary pattern in the FR was positively correlated with several foods that featured in the FFQ ‘Western’ pattern: take-away foods, fried potato (chips), soft drinks, crisps and confectionery. In addition, this pattern was negatively correlated with whole grains, fresh fruit, low-fat dairy and mineral water. We observed very similar patterns when the factor analysis was restricted to those foods in the FR that directly matched with the FFQ foods. In both the FFQ and FR factor analyses, other factors in addition to the ‘Healthy’ and ‘Western’ patterns were identified. However, these were minor; they explained small amounts of variance and loaded with few foods. We therefore excluded minor factors from our comparisons, as others have done(Reference Hu, Rimm and Smith-Warner4).
Correlations
There were modest correlations between dietary pattern scores from the FFQ and FR (‘Healthy’ r 0·43 and ‘Western’ r 0·27); however, these improved after adjustment for total energy intake (‘Healthy’ r 0·45 and ‘Western’ r 0·36) (Table 2). Correlations between the ‘Healthy’ pattern were stronger, with r 0·47 for boys and r 0·42 for girls (energy adjusted), whereas correlations between the ‘Western’ pattern were slightly weaker, with r 0·34 for boys and r 0·38 for girls.
Table 2 Correlation coefficients, mean agreement and limits of agreement (LOA) between dietary pattern scores from a FFQ and 3 d food record (FR)

* Spearman's rank correlation coefficient (all P < 0·001).
† Mean of differences between dietary pattern scores (FFQ − FR).
‡ LOA: mean agreement ± 1·96 (sd of differences between methods).
§ Difference between the upper and lower 95 % LOA.
∥ Partial Spearman's rank correlation coefficient, adjusted for total energy intake (all P < 0·001).
Erythrocyte n-3 and very-long-chain (VLC) n-3 fatty acids correlated with the scores from both dietary patterns (P < 0·01; Table 3). ‘Healthy’ pattern scores from both the FFQ and FR were positively associated with n-3 (r 0·17 and 0·13, respectively) and VLC n-3 (r 0·17 and 0·12), whereas ‘Western’ pattern scores from both the FFQ and FR were negatively correlated with n-3 (r − 0·09 and − 0·13, respectively) and total VLC n-3 fatty acids (r − 0·10 and − 0·15). A negative correlation was suggested between fasting glucose and ‘Healthy’ pattern scores from both the FFQ (r − 0·09) and FR (r − 0·06). Adjustment for sex made little or no difference to these correlations. There were no observed correlations between either dietary pattern and serum lipids (not shown).
Table 3 Correlations between biomarkers and dietary pattern scores from a FFQ and 3 d food record (FR)†

VLC, very long chain.
* P ≤ 0·01.
† Partial Spearman's correlation coefficients, adjusted for total energy intake.
‡ α-Linolenic acid (18 : 3n-3), parinaric acid (18 : 4n-3), EPA (20 : 5n-3), docosapentaenoic acid (22 : 5n-3) and DHA (22 : 6n-3).
§ EPA (20 : 5n-3), docosapentaenoic acid (22 : 5n-3) and DHA (22 : 6n-3).
Agreement
In nearly all comparisons, there was acceptable mean agreement between ‘Healthy’ scores and between ‘Western’ scores, i.e. mean agreement was not significantly different from zero (Table 2). However, mean agreement between the ‘Healthy’ pattern in girls (0·11) suggested that ‘Healthy’ pattern scores were, on average, slightly higher in the FFQ than in the FR. The 95 % LOA did not vary considerably by pattern, ranging from − 1·69 to 1·75 for the ‘Healthy’ pattern and from − 1·89 to 1·82 for the ‘Western’ pattern (Table 2). This is illustrated by the Bland–Altman plots for agreement (Fig. 1). Although the LOA were slightly narrower for the ‘Healthy’ pattern and for girls (both patterns; Fig. 1), these differences were marginal.

Fig. 1 Bland–Altman plots showing mean agreement (· - · - · - ·) and 95 % limits of agreement (—) between ‘Healthy’ ((a) boys and (b) girls) and ‘Western’ ((c) boys and (d) girls) dietary pattern scores in a FFQ and 3 d food record (FR).
Nutrient profiles
Correlations between nutrient intakes from the FR and dietary pattern scores from the FFQ and the FR are shown in Table 4. As there were no sex differences, a single table presenting the results for boys and girls combined is shown. As expected, the strongest correlations were between FR nutrients and FR dietary pattern scores. ‘Healthy’ pattern scores from both the FFQ and FR correlated positively with FR intakes of protein, folate, fibre, β-carotene, niacin, riboflavin, thiamin, vitamin C, Ca, Fe, Mg, and negatively with total, saturated and monounsaturated fat. ‘Western’ pattern scores from the FFQ and the FR were both positively correlated with FR intakes of total, saturated and monounsaturated fat, and negatively correlated with protein, fibre, folate, β-carotene, riboflavin, thiamin, Ca, Fe and Mg. The majority of statistically significant correlations were consistent for the FFQ and the FR. This suggests that the ‘Healthy’ and ‘Western’ dietary patterns had similar nutrient profiles when identified using the FFQ or the FR.
Table 4 Correlations between dietary pattern scores and energy-adjusted nutrient intakes from a 3 d food record (FR)†

* P < 0·05.
† Partial Spearman's correlation coefficients, adjusted for total energy intake in the FFQ.
Discussion
We identified two major dietary patterns in this cohort of adolescents: a ‘Healthy’ pattern and a ‘Western’ pattern, which are qualitatively similar to ‘Healthy’ or ‘Prudent’, and ‘Western’ patterns described in other studies(Reference Hu, Rimm and Smith-Warner4, Reference Khani, Ye and Terry5, Reference Crozier, Inskip and Godfrey7). Having compared these two dietary patterns in a FFQ and 3 d FR, we conclude that they are relatively valid, based on the similarities in nutrient profiles, the mean agreement and the 95 % LOA.
To our knowledge, no studies on the relative validity of dietary patterns in adolescents have been published to date. However, studies in adults have compared FFQ dietary patterns similar to the present study (‘Healthy’/‘Prudent’ and ‘Western’) with those in a FR(Reference Hu, Rimm and Smith-Warner4, Reference Khani, Ye and Terry5, Reference Crozier, Inskip and Godfrey7). In these studies, the factor loading matrices were largely similar across dietary methods, but they were not identical(Reference Hu, Rimm and Smith-Warner4, Reference Crozier, Inskip and Godfrey7), as we observed. For example, in the study by Hu et al. (Reference Hu, Rimm and Smith-Warner4), potatoes (excluding French fries) were positively loaded (0·40) onto a ‘Prudent’ pattern in a FR, but not in a ‘Prudent’ pattern observed in a FFQ. There were also inconsistencies for sweets and desserts (including cakes and biscuits), soups, poultry, fish and other seafood. Similarly, in the study by Crozier et al. (Reference Crozier, Inskip and Godfrey7), boiled potatoes, puddings and processed meats had moderate factor loadings in a ‘Western’ pattern in the FFQ but not in a FR. We also observed inconsistencies in the factor loadings for these foods.
In our FR dietary patterns, we noted that factor loadings were generally weaker compared with the FFQ, and as a result, we observed fewer foods with moderate loadings. This most likely reflects the methodological differences between the FR and the FFQ. The FFQ collected information on the usual dietary intake over the past year, while the FR measured food eaten over a 3 d period; therefore, a smaller range of foods are likely to be reported in an individual's FR and across all FR because there were fewer subjects who completed a 3 d FR. In addition, factor analysis solutions depend on the correlation matrix of food intakes. Therefore, some differences would be expected between factor loading matrices from different dietary assessments, or from repeated dietary assessments based on different numbers of subjects.
The correlations between dietary pattern scores from a FFQ and FR in adult studies range from 0·34 to 0·67 for the ‘Healthy’/‘Prudent’ patterns and from 0·35 to 0·51 for the ‘Western’ patterns(Reference Hu, Rimm and Smith-Warner4, Reference Khani, Ye and Terry5, Reference Crozier, Inskip and Godfrey7), which are comparable with those observed in the present study. However, correlation coefficients can be misleading, whereas the mean agreement and 95 % LOA are better indicators of how well two measurements compare(Reference Bland and Altman25). The 95 % LOA between the dietary patterns that we observed were acceptable, but slightly narrower for the ‘Healthy’ pattern. Few studies have used LOA, but similar findings were reported in a study of pregnant women where the 95 % LOA between a FFQ and FR were − 1·58 to 1·58 for a ‘Prudent’ pattern and − 2·22 to 2·22 for a ‘Western’ pattern(Reference Crozier, Inskip and Godfrey7). Although we observed some differences between boys and girls, these were relatively minor. Mean agreement suggested that, on an average, girls had higher ‘Healthy’ pattern scores in their FFQ. This may reflect real differences in eating patterns, or alternatively, girls may be more concerned about their body image and be more conscientious about reporting their diet, which could lead to overestimation of ‘healthy food’ intakes. We have previously reported poorer agreement between nutrient intakes in the FFQ and FR among girls(Reference Ambrosini, de Klerk and O'Sullivan12).
Examining nutrient profiles is a useful way to compare dietary patterns from different dietary methods. Nutrient profiles are informative because they describe the product of a dietary pattern, i.e. nutrient intake. So far, we have observed only one other study, that of Hu et al. (Reference Hu, Rimm and Smith-Warner4), that has compared the nutrient profiles of dietary patterns. They too reported that the nutrient profiles for ‘Prudent’ and ‘Western’ dietary patterns were similar in a FFQ and FR(Reference Hu, Rimm and Smith-Warner4). As seen for the ‘Healthy’ pattern in the present study, their ‘Prudent’ pattern was positively correlated with fibre, folate, Ca, carotene and Mg intakes, and negatively correlated with total and saturated fat intakes in both a FFQ and FR. Their ‘Western’ pattern was also positively correlated with total and saturated fat, and negatively correlated with fibre, folate, Ca, carotene and Mg intakes.
When comparing the dietary patterns with biomarkers, we observed statistically significant correlations for n-3 and VLC n-3 fatty acids. These showed consistent associations with the ‘Healthy’ (positive) and ‘Western’ (negative) patterns in both the FFQ and FR. This consistency further supports the similarity in ‘Healthy’ and ‘Western’ dietary patterns observed using these two dietary methods. We have previously reported that fish and dairy products were the main sources of n-3 and VLC n-3 fatty acids, respectively, in this cohort at 14 years of age(Reference O'Sullivan, Ambrosini and Beilin26), and these foods feature in the ‘Healthy’ dietary pattern. Interestingly, despite having a high factor loading for fried fish, the ‘Western’ dietary pattern was negatively associated with erythrocyte n-3 and VLC n-3 fatty acids. This corresponds with data from a US population-based cohort study showing that n-3 fatty acid intake correlated with intakes of grilled and baked fish, but not with intakes of fried fish(Reference Mozaffarian, Lemaitre and Kuller27).
The present study benefits from a large sample size (n 783) and good response fractions (70 and 75 % for the FFQ and FR, respectively). Together, the observed ‘Healthy’ and ‘Western’ dietary patterns accounted for a large proportion of the variation in food intakes (53–84 %). However, there are several potential limitations to the study. A 3 d FR has been shown to be an appropriate method of assessing usual diet in children(Reference Crawford, Obarzanek and Morrison28). However, adolescents may show high levels of variation in their recorded food intake, and a 3 d FR may have been insufficient to capture usual food intake in this cohort(Reference Livingstone, Robson and Wallace19). It should also be acknowledged that the FR is not an error-free comparison method. Under-reporting in FR is common, particularly among adolescents and children(Reference Livingstone, Robson and Wallace19). However, we attempted to minimise under-reporting by checking the FR for representativeness and by following up incomplete or ambiguous information directly with respondents. We also found that subjects differed in some ways to the rest of the cohort, which may limit the application of these findings. Finally, factor analysis is subjective; the number of factors to retain in the factor solution is arbitrary. However, the significant advantage of dietary patterns is that they take account of the whole diet and can provide an overall picture of total dietary exposure. While dietary pattern analysis is unlikely to replace the reductionist approach of analysing individual nutrients and foods, it serves as a useful complementary method for diet–disease analyses.
In conclusion, ‘Healthy’ and ‘Western’ dietary patterns identified using a FFQ in this cohort of adolescents are relatively valid in comparison with a 3 d FR. These findings support the use of dietary patterns identified using factor analysis and FFQ data to describe usual dietary intake in this adolescent population. We plan to examine longitudinal relationships between these dietary patterns and various health outcomes in this cohort using data collected at the 17-year follow-up and later.
Acknowledgements
We are extremely grateful to all the families who took part in the present study and the whole Raine Study team, which includes data collectors, cohort managers, data managers, clerical staff, research scientists and volunteers. We also wish to acknowledge the Commonwealth Scientific and Industrial Research Organization. This work was supported in part by the Raine Medical Research Foundation at the University of Western Australia, the National Health and Medical Research Council of Australia (Program Grant ID 003209), the Telstra Foundation, the Western Australian Health Promotion Foundation, the Australian Rotary Health Research Fund, the Heart Foundation of Australia and Beyond Blue, the Telethon Institute for Child Health Research and the UK Medical Research Council. W. H. O. was supported by a National Health and Medical Research Council Career Development Award (ID 323204). G. L. A. provided the idea for the analysis and wrote the manuscript. N. H. d. K., L. J. B. and W. H. O. designed and conducted the original research. T. A. O. and G. L. A. cleaned the dietary data. T. A. M. was responsible for all biochemical assays and interpretation of biochemical data. G. L. A. and N. H. d. K. analysed the data. All authors were responsible for critical reviews and final approval of the manuscript. G. L. A. and W. H. O. had primary responsibility for the final content. All authors declare that they have no conflicts of interest.
Appendix 1. Food groups used in the factor analyses*
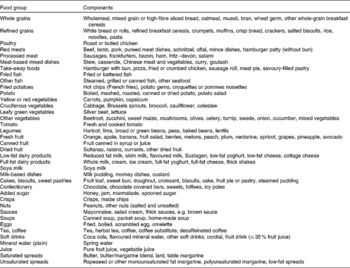
* Reproduced with permission from Ambrosini et al. (Reference Ambrosini, Oddy and Robinson13)


