


Over the last decades, nutritional research has provided data strongly suggesting beneficial health effects from a plant-based diet(Reference Andersen, Jacobs and Carlsen1–Reference Wright, Mayne and Swanson9). A typical plant-based diet provides thousands of phytochemicals(8) that may modify a multitude of cellular processes(Reference Cabrera, Artacho and Gimenez10–Reference Wang and Stoner13). In our effort to elucidate the effects of dietary phytochemicals on health and disease, we have developed an FFQ for the assessment of phytochemical-rich food and beverages in a habitual diet. Assessment of long-term dietary intake using methods of self-reporting has generally been associated with a substantial degree of measurement errors(Reference Willett14). Self-reporting challenges the participants' memory and ability to take into account the variability in intake, from day to day or by season. Because of these obvious sources of errors, dietary assessment methods should always be validated before use. Dietary validation studies aim to estimate the association between dietary assessment data and the subjects' true intake(Reference Ocke and Kaaks15), and are usually performed comparing the test method with a more valid reference method. Measuring biomarkers of intake in biological samples is an objective method to assess dietary intake, although individual differences in digestion, absorption, distribution, metabolism and excretion should be taken into account(Reference Jenab, Slimani and Bictash16). Flavonoids and carotenoids are widely distributed phytochemicals in fruit and vegetables that are regularly consumed by humans. Several studies have investigated the use of plasma carotenoids and urinary flavonoids as biomarkers of fruit and vegetable intake(Reference Andersen, Veierod and Johansson17–Reference Mennen, Sapinho and Ito26). Of the more than 700 natural carotenoids identified thus far, α-carotene, β-carotene, β-cryptoxanthin, lutein, lycopene and zeaxanthin represent more than 95 % of total blood carotenoids(Reference Maiani, Caston and Catasta27). The type and amount of carotenoids differ among fruit and vegetables, thus different populations may have different plasma carotenoid profiles depending on what type of fruit and vegetables they consume(Reference Al-Delaimy, Slimani and Ferrari28). The motivation for using urinary flavonoids as biomarkers came from earlier observations showing that the sum of flavonoids is associated with the consumption of fruit and vegetables(Reference Brevik, Rasmussen and Drevon18, Reference Krogholm, Haraldsdottir and Knuthsen20, Reference Nielsen, Freese and Kleemola22, Reference Mennen, Sapinho and Ito26). Urinary flavonoids reflect low(Reference Krogholm, Haraldsdottir and Knuthsen20) and high intakes(Reference Brevik, Rasmussen and Drevon18, Reference Nielsen, Freese and Kleemola22) as well as moderate changes in fruit and vegetable consumption(Reference Brevik, Rasmussen and Drevon18).
Using more than one reference method in the validation study enabled us to apply the method of triads for evaluating the intakes of fruit and vegetables from the FFQ(Reference Ocke and Kaaks15, Reference Kaaks29). Moreover, measuring two biomarkers of intake made it possible to fulfil the assumption of two independent reference measures of intake(Reference Kaaks29). The aim of the present study was thus to evaluate the relative validity of fruit, juice and vegetable intake from the FFQ, using the method of triads, first by applying data from weighed food records (WR) and plasma carotenoids and, second, by using urinary flavonoids and plasma carotenoids.
Materials and methods
Subjects and study design
The validation study was designed to include a representative sample of Norwegians aged 18–80 years. A total of 4500 randomly selected inhabitants of the Norwegian capital and surrounding area (administered by the National Tax Office/Population Registration Office) received a written invitation to participate in the project. Exclusion criteria were pregnancy, weight loss of more than 5 kg during the last 6 months before the study and participation in drug testing trials. In total, 504 subjects responded to the invitation, and after a screening interview, 346 participants were enrolled in the study (8 % participation rate). They received the FFQ and written instructions by mail and were asked to fill in the FFQ at home. Within 2 weeks, the participants attended a physical examination where overnight fasting blood samples were collected, the FFQ was returned and the participants were randomly assigned to three sub-studies: 168 participants were assigned to sub-study I and given instructions on how to carry out the 7 d WR; 114 participants were assigned to sub-study II and asked to collect 24 h urine samples (Fig. 1). The remaining sixty-four participants were assigned to carry out an energy intake validation study. The results from the latter sub-study are published elsewhere(Reference Carlsen, Lillegaard and Karlsen30). The three parallel studies were designed to minimise the workload of the participants. Data collection was carried out from September 2006 until October 2007. The present study was conducted according to the guidelines laid down in the Declaration of Helsinki, and all procedures involving human subjects were approved by the Regional Ethics Committee for Medical Research. Written informed consent was obtained from all subjects.

Fig. 1 Study design and flow chart. Of the 504 respondents, 346 were found to be eligible for participation. Randomisation into three sub-studies resulted in 168, 114 and sixty-four participants assigned to carry out weighed food records (WR), 24 h urine sampling or energy expenditure measurements, respectively. Only the results from sub-studies I and II are included in the present study.
The semi-quantitative FFQ
The fourteen-page questionnaire was designed to capture the habitual food intake among Norwegian adults during the preceding year. The FFQ was an extended and revised version of the semi-quantitative FFQ used in the Norwegian nationwide survey NORKOST 1997 (NFFQ)(Reference Solvoll31). The original NFFQ was a validated, 180-item optical readable FFQ, developed to cover total energy intake of the population(Reference Johansson and Solvoll32–Reference Andersen, Solvoll and Johansson35). Based on our extensive screening of antioxidant contents in food and beverages(Reference Carlsen, Halvorsen and Holte36), the NFFQ was updated with questions about food products and food categories assumed to be important sources of dietary antioxidants in Norway. The new FFQ included 270 food items, grouped together according to the Norwegian meal pattern. The additional questions included nineteen questions about different berries, four about fruit, six about vegetables, two about chocolate, ten about nuts and seeds, twenty-seven about spices and herbs, three about coffee and two about tea intake. Questions concerning seasonal variation in berry intake were also included. The options of frequency of consumption of particular food items ranged from several times a day to once a month, with options of portion sizes based on household units such as slices, glasses, cups, pieces, spoons and teaspoons. The amounts of the portion sizes were based on portions estimated by WR from previous surveys(Reference Solvoll31). The FFQ was scanned, and the image files were transferred into data files using Cardiff Teleform 2006 software. The data files were checked for completeness, and daily intakes of fruit and vegetables were computed using the food database AE-07 and KBS software system (KBS, version 4.9, 2008) developed at the Department of Nutrition, University of Oslo, Norway. The food database AE-07 is based on the 2006 edition of the Norwegian food composition table (www.norwegianfoodcomp.no). In the present study, fruit intake is the sum of fresh, dried and canned fruit and fruit juice intake. Berries and berry products were not included. The intake of vegetables was assessed by twenty-seven questions about different vegetables, including vegetables in compound dishes such as casseroles, pizza, tacos and soups. Vegetables from compound dishes were estimated from standardised recipes.
The 7 d weighed food records
The WR registration was divided into two periods of four and three subsequent days, 7 d apart, covering all days of a week. The participants were equipped with a food registration diary and a scale (Phillips 2393/95, 1–5 kg) and were instructed to weigh and register everything that they ate and drank during the registration period. After completion, the records were returned to the Department of Nutrition, University of Oslo, by mail. Daily intakes of fruit and vegetables were computed using the food database AE-07 and KBS software system (KBS, version 4.9, 2008) and included all vegetables reported as single items or as part of mixed dishes. The records were checked for completeness, and twenty-one participants were excluded due to incomplete registrations. Thus, WR data from 147 participants were included in the analyses.
Blood and urine samples
Overnight fasting blood samples were collected, and plasma, serum and WBC samples were immediately prepared and stored at − 70°C unless immediately analysed. Urine samples were collected twice, 6 months apart; one sample was collected on a weekday and the other on a weekend. All weekdays were evenly represented; for the weekend days, more urine samples were sampled on Saturday than on Sunday. The participants were asked to discard the first morning urine and from then on to collect all urine for 24 h up to and including the morning urine the next day. The urine samples were collected in 3000 ml dark plastic bottles containing 240 mg ascorbic acid powder. After the first void of urine, the participants added 10 ml of 1 m-HCl as the stabilising agent. The urine samples were brought to the laboratory by the staff. Total volume was registered, and 10 ml aliquots of the samples were stored at − 70°C until analysis. The completeness of the urine samples was verified using the para-amino benzoic acid (PABA) method(Reference Bingham and Cummings37, Reference Bingham, Cassidy and Cole38). The participants took three tablets each containing 80 mg PABA: one tablet at breakfast, one at the mid-day meal and one at the evening meal. PABA in the urine was measured using a colorimetric method(Reference Bingham and Cummings37). Urine samples containing 80–110 % of the PABA consumed were classified as acceptable(Reference Jakobsen, Pedersen and Ovesen39), whereas samples outside this range were not included in further analyses. Acceptable PABA checks in urine samples from both time points were found for eighty-five participants.
Determination of flavonoids in urine
The flavonoids apigenin, eriodictyol, hesperidin, kaempferol, naringenin, phloretin, quercetin and tamarixetin/isorhamnetin were quantified in the urine samples by HPLC–atmospheric pressure chemical ionisation–MS/MS at AS Vitas (Oslo, Norway; www.vitas.no). The procedure was adapted from Nielsen et al. (Reference Nielsen, Freese and Cornett40) with minor modifications. In brief, 2 ml urine were filtered, and internal standards were added and enzymatically treated with glucuronidase and sulphatase to remove sugars conjugated to the flavonols. After incubation (45°C, 500 rpm for 1 h) and subsequent cooling to room temperature, residual proteins were precipitated by the addition of ice-cold methanol and centrifugation. After evaporation with hot N2, the residue was dissolved in 150 μl of 35 % methanol in water. Then, 100 μl was injected directly into the HPLC–MS/MS system. The mean value for both urine samples was used in the subsequent validation analyses.
Determination of plasma carotenoids
α-Carotene, β-carotene, β-cryptoxanthin, lutein, lycopene and zeaxanthin in plasma were determined by HPLC. Proteins were precipitated and removed by the addition of 4·5 volumes of isopropanol followed by centrifugation at 3000 g at 4°C for 15 min. The internal standard astaxanthin was added with isopropanol. The clear supernatant (25 μl) was used for analysis. The mobile phases consisted of A (20 % water and 24 % acetone in ethanol) and B (acetone). The gradient conditions were as follows: from 2 to 100 % B within 20 min, followed by 100 % B for 15 min. Detection was performed at 453 nm using a variable wavelength detector. Plasma calibrators quantified against the National Institute of Standards and Technology 968c Standardized Reference material served as standards.
Statistical methods
Age and BMI were normally distributed and are presented as means. Plasma carotenoid concentrations, amount of urinary flavonoids and fruit and vegetable intakes were not normally distributed and are presented as medians. Differences in intake estimates from the FFQ and the WR were tested using non-parametric statistical methods. To investigate the relationship between the intakes from the FFQ and the WR, the Spearman correlation coefficient was calculated. To investigate the relationship between fruit and vegetable intakes and biomarkers, data were ln-transformed, and Pearson's correlation coefficients were calculated for intakes from the FFQ and urinary flavonoids and for the intakes estimated from the FFQ and the WR. The correlations between plasma carotenoid concentrations and the other variables were performed using partial correlation, adjusting for BMI. Correlations are presented with 95 % CI(Reference Field41).
The method of triads was used to estimate the validity coefficients (VC) between theoretical true intake and intakes estimated from the FFQ, the WR and the biomarkers(Reference Ocke and Kaaks15, Reference Kaaks29). Let Q, R and M be the measurements of dietary intake from the FFQ, the WR and the biomarker, respectively, and let T denote the true unknown long-term dietary intake. When using two biomarkers, let R be the first and M be the second biomarker. The VC can be estimated as follows:
where r is the correlation coefficient(Reference Ocke and Kaaks15, Reference Kaaks29). This technique assumes that random errors in the dietary assessments are uncorrelated, and that positive linear correlation exists between estimates of the dietary intake and true intake(Reference Kaaks29, Reference Daures, Gerber and Scali42). The 95 % CI for the estimates of the VC were obtained using the percentile bootstrap method(Reference Kaaks29, Reference Efron and Tibshirani43) with 1000 bootstrap samples. The 95 % CI are thus based on the intervals from the 2·5 to the 97·5 percentile of the VC found by using the 1000 bootstrap samples. A well-known problem with the method of triads is that the VC estimates may become larger than 1(Reference Ocke and Kaaks15). Another problem is that the VC cannot be estimated using equations (1)–(3) due to the square root in the formulas, when the estimated correlation is negative. None of these problems were present when estimating the VC from our data, but they were for several of the bootstrap samples. The reason for these problems is the fairly crude estimation method. To avoid these problems, we used maximum-likelihood estimation for factor analysis models, which is the basis for the method of triads(Reference Brantsaeter, Haugen and Rasmussen44). Thus, when calculating the CI, the VC for the bootstrap samples were found based on maximum-likelihood estimation. Both the maximum-likelihood estimation and the bootstrap analyses were performed using open-source statistical software R, version 2.7.0(45). All other statistical analyses were performed using SPSS for Windows release 16.0 (SPSS, Inc., Chicago, IL, USA). Results were considered to be statistically significant at P < 0·05. Significant levels are two-sided.
Based on results from other recent validation studies using plasma carotenoids and urinary flavonoids as biomarkers of fruit and vegetable intake(Reference Brevik, Rasmussen and Drevon18–Reference Nielsen, Freese and Kleemola22, Reference Mennen, Sapinho and Ito25, Reference Mennen, Sapinho and Ito26), as well as the observed correlations in the present sub-studies, the following combinations of biomarkers were used in the method of triads: β-cryptoxanthin as the biomarker for fruit (including juice) intake; the sum of α-carotene and β-carotene as the biomarker for vegetable intake; the sum of α-carotene, β-carotene and β-cryptoxanthin as well as the sum of urinary flavonoids as the biomarkers of fruit, juice and vegetable intake. Because of the lack of a valid biomarker for the intake of berries and berry products, these intakes were excluded from the calculations.
Results
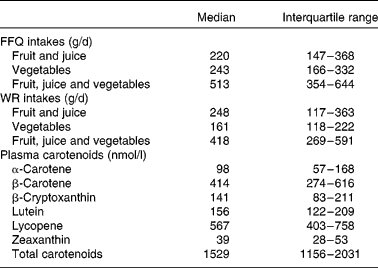
A total of 282 subjects were included in sub-studies I and II (Fig. 1). After completion of data sampling, we had valid datasets from 147 participants in sub-study I and from 85 in sub-study II, of whom 110 were male and thirty-two were current smokers. Mean age and BMI were 47 (95 % CI 45, 49) years and 24·7 (95 % CI 24·2, 25·2) kg/m2, respectively. Intakes of fruit (including juice) and vegetables from the FFQ and the WR and plasma carotenoid concentrations from sub-study I are presented in Table 1. The total intake of fruit (including juice) did not differ significantly between the FFQ and the WR (P = 0·74). In contrast, intake of vegetables was significantly higher when estimated by the FFQ compared with the WR (P < 0·001); the median absolute difference between the two methods was 67 g/d or 39 % of WR intake. Furthermore, total intake of fruit and vegetables was significantly higher when estimated by the FFQ than by the WR (P < 0·001). Spearman's correlations between the two dietary measurement methods were 0·57 (P = 0·000), 0·38 (P = 0·000) and 0·49 (P = 0·000) for intake of fruit (including juice), vegetables and total fruit, juice and vegetable intake, respectively.
Table 1 Intakes of fruit and vegetables estimated from the FFQ and the 7 d weighed food records (WR) and plasma carotenoid concentrations in sub-study I
(Median values and interquartile ranges, n 147)
Correlations between plasma carotenoids and intakes from the FFQ and the WR are given in Table 2. For most of the correlations, the intakes of fruit and vegetables from the FFQ showed higher correlations with the plasma carotenoids than the intakes from the WR. Significant correlations were observed between intakes of fruit (including juice) from both the FFQ and the WR and plasma β-cryptoxanthin, whereas intakes of vegetables from the FFQ and the WR correlated significantly with plasma α-carotene and β-carotene concentrations. The total intake of fruit, juice and vegetables from the FFQ showed stronger correlations and correlated with more plasma carotenoids than the corresponding intake estimates from the WR (Table 2).
Table 2 Correlation coefficients between plasma carotenoid concentrations and dietary intakes from the FFQ and weighed food records (WR) in sub-study I†
(Partial correlation coefficients and 95 % confidence intervals, n 147)

FJ, fruit and juice; V, vegetables; FJV, fruit, juice and vegetables; α+β, α-carotene+β-carotene; α+β+β, α-carotene+β-carotene+β-cryptoxanthin.
Correlation coefficients were statistically significant: *P < 0·05, **P < 0·01, ***P < 0·001.
† Data ln-transformed, partial correlation coefficients adjusted for BMI.
Intakes of fruit (including juice) and vegetables from the FFQ, plasma carotenoid concentrations, urinary flavonoids and corresponding correlations in sub-study II are presented in Table 3. The intake of fruit (including juice) showed significant correlations with apigenin, eriodictyol, hesperidin, naringenin, tamarixetin/isorhamnetin and total flavonoids in urine. Vegetable intake correlated significantly with apigenin, tamarixetin/isorhamnetin and total flavonoids in urine, whereas total intake of fruit, juice and vegetables correlated significantly with most of the urinary flavonoids (Table 3). All plasma carotenoids except lycopene showed significant correlations with intakes of fruit (including juice) and total fruit, juice and vegetable intake (Table 3). However, intake of vegetables correlated significantly only with α-carotene, β-carotene, lutein and total carotenoids.
Table 3 Dietary intakes from the FFQ, flavonoids in 24 h urine samples and plasma carotenoid concentrations in sub-study II
(Median values, interquartile ranges (IQR), correlation coefficients and 95 % confidence intervals, n 85)

FJ, fruit and juice; V, vegetables; FJV, fruit, juice and vegetables.
Correlation coefficients were statistically significant: *P < 0·05, **P < 0·01, ***P < 0·001.
† Flavonoid correlations: ln-transformed data, Pearson's correlations.
‡ Carotenoid correlations: ln-transformed data, partial correlation adjusted for BMI.
The VC for the FFQ and the reference methods in both sub-studies are shown in Table 4. The VC for the intake of vegetables from the FFQ were 0·61 and 0·60 in sub-studies I and II, respectively. The corresponding VC for intake of fruit (including juice) from the FFQ were 0·75 and 0·67, whereas the VC were 0·88 and 0·94, respectively, for total intake of fruit, juice and vegetables from the FFQ.
Table 4 Validity coefficients (VC) for the FFQ, weighed food records (WR), plasma carotenoid concentrations and urinary flavonoids in sub-studies I and II
(Validity coefficients and 95 % confidence intervals)
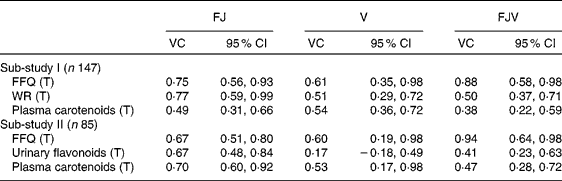
FJ, fruit and juice; V, vegetables; FJV, fruit, juice and vegetables; T, true intake.
Of the participants, thirty-four reported habitual use of food supplements containing different amounts of carotenoids and/or flavonoids. No significant differences in plasma carotenoid concentrations or urinary flavonoids were observed between users and non-users of supplements, except for α-carotene, which was significantly higher for users than for non-users (P = 0·04). Correlations between intake estimates and biomarkers did not change significantly with or without supplement users, and therefore supplement users were included in all analyses.
Discussion
The major strength of the present validation study is that we have applied two independent sets of biomarkers for the dietary intake of fruit and vegetables in combination with the method of triads. The average intake of fruit and juice from the FFQ was similar, whereas the average intake of vegetables was higher compared with the WR. The VC for intakes of fruit, juice and vegetables from the FFQ were high.
Comparisons of FFQ and weighed food record estimates
The FFQ provided similar data on median intake of fruit, whereas the intake of vegetables was higher compared with the WR. There may be several explanations for this. The questions concerning fruit and fruit juice consumption in the FFQ were presented in portion sizes such as pieces or glasses, which may be easier to recall than vegetable portion sizes, which may vary more, and often are integrated parts of whole dishes. In addition, the relatively large number of questions about different types of vegetables, nineteen in total, may lead to the observed high intake of vegetables. WR have been widely accepted as a preferred reference method in the validation of FFQ because the assessment errors are mostly independent(Reference Willett14, Reference Cade, Thompson and Burley46). However, prolonged recording may reduce the recorded intake because the registration itself may be too demanding for the subjects(Reference Kristjansdottir, Andersen and Haraldsdottir47), causing changes in behaviour and dietary intake(Reference Cade, Thompson and Burley46), and consequently under-reporting of food intake(Reference Cade, Thompson and Burley46, Reference Kristjansdottir, Andersen and Haraldsdottir47). We did not observe any reduction in the intake of vegetables registered from day 1 to 7 in the WR; thus it seems unlikely that there was under-reporting of vegetable intake in the WR due to participant burden.
Fruit and vegetable intake and plasma carotenoids
The strongest correlations between intakes from the two dietary assessment methods and plasma carotenoids were observed between intakes of fruit and the plasma concentration of β-cryptoxanthin. Citrus fruit and juices are major dietary sources of β-cryptoxanthin(Reference Maiani, Caston and Catasta27) and are frequently consumed by the participants in the present study population (35 % of the total fruit and vegetable consumption, data not shown). The positive association between plasma β-cryptoxanthin and the intake of fruit and vegetables in the present study is in agreement with earlier studies, showing β-cryptoxanthin to be a consistent biomarker for fruit and vegetable intake(Reference Brevik, Andersen and Karlsen19, Reference Jansen, Van Kappel and Ocke21, Reference Campbell, Gross and Martini23, Reference Kristjansdottir, Andersen and Haraldsdottir47, Reference Block, Norkus and Hudes48). Intake of vegetables from the FFQ showed good and significant correlations with α-carotene and β-carotene, in accordance with earlier studies(Reference Andersen, Veierod and Johansson17, Reference Campbell, Gross and Martini23, Reference Van Kappel, Steghens and Zeleniuch-Jacquotte49, Reference Al-Delaimy, Ferrari and Slimani50). An earlier Norwegian study showed a proportionally larger response in serum concentrations of α-carotene than other carotenoids to variations in fruit and vegetable consumption(Reference Brevik, Andersen and Karlsen19). Important sources of α-carotene are carrots, red and green pepper and bananas(Reference Maiani, Caston and Catasta27); all are frequently consumed in Norway.
Fruit and vegetable intake and flavonoids in urine
Earlier dietary intervention studies have shown that small changes in the intake of fruit and vegetable are reflected in the amount of flavonoids excreted in urine(Reference Brevik, Rasmussen and Drevon18, Reference Krogholm, Haraldsdottir and Knuthsen20, Reference Nielsen, Freese and Kleemola22, Reference Mennen, Sapinho and Ito25, Reference Mennen, Sapinho and Ito26). In the present study, the amount of total urinary flavonoids showed good correlation with the total intake of fruit, juice and vegetables. The highest correlations were observed between the intake of fruit (including juice) and the amount of the two citrus flavonoids hesperidin and naringenin in urine, which are specific biomarkers for grapefruit and orange intake(Reference Ito, Gonthier and Manach24, Reference Gattuso, Barreca and Gargiulli51, Reference Erlund, Meririnne and Alfthan52). Furthermore, the observed values of urinary flavonoids in the present study were in the same range as reported from earlier intervention studies(Reference Brevik, Rasmussen and Drevon18, Reference Krogholm, Haraldsdottir and Knuthsen20, Reference Nielsen, Freese and Kleemola22), thus showing that the FFQ can discriminate between intakes in the normal everyday range of fruit and vegetable consumption.
The method of triads and validity coefficients
Originally, the method of triads was used with one biomarker and two dietary assessment methods(Reference Ocke and Kaaks15, Reference Andersen, Veierod and Johansson17, Reference Kaaks29, Reference Daures, Gerber and Scali42, Reference McNaughton, Marks and Gaffney53). However, the assumption of total independence between the errors of the two dietary assessment methods was in many cases unrealistic(Reference Kaaks and Ferrari54). The present study is one of a few studies(Reference Brantsaeter, Haugen and Rasmussen44) combining two independent and specific biomarkers of fruit and vegetable intake when validating the intakes of fruit and vegetables from an FFQ and applying the method of triads. The main advantage of dietary biomarkers is that they are objective measures and independent of the biases and errors associated with dietary assessment methods(Reference Ocke and Kaaks15, Reference Jenab, Slimani and Bictash16, Reference Kaaks29). In the present study, the triad testing showed that the VC were high for the intakes from the FFQ. We also observed generally higher VC for the FFQ than for the WR and the plasma and urinary biomarkers. The VC for the plasma carotenoids were, with one exception, lower than the VC for the dietary assessment methods. Andersen et al. (Reference Andersen, Veierod and Johansson17) also observed this when using an FFQ and WR together with plasma carotenoids; the VC for the assessment methods often were higher than the VC for the biomarker. This may be explained by individual differences in digestion, absorption, distribution, metabolism and excretions of carotenoids(Reference Jenab, Slimani and Bictash16). We speculate that the lower VC for the intake of vegetables from the FFQ compared with the intake of fruit and juice observed in the present sub-studies may reflect difficulties associated with reporting vegetable portion sizes and frequency of consumption, especially for vegetables that are part of mixed dishes.
Strengths and limitations of the validity study
The strength of the present validation study is the use of two biomarkers as independent reference methods for the assessment of the VC. Moreover, we used the mean of two 24 h urine samples for the determination of urinary flavonoids, instead of a single urine sample. By using independent reference methods and repeated measures of biomarkers, we tried to optimise the measures of the reference methods for application in the method of triads.
The biomarkers used in the present study are concentration biomarkers; thus they cannot be translated into absolute levels of intake(Reference Bingham, Luben and Welch55) but are instead used to evaluate the relative intakes of fruit, juice and vegetables. However, when using biomarkers of nutrient intake, it is important to keep in mind all the factors that influence the concentration of the biomarker. The intake of specific flavonoids and carotenoids varies widely between countries and cultures(Reference Rasmussen and Breinholt56, Reference O'Neill, Carroll and Corridan57). Thus, different sets of biomarkers may reflect different dietary sources in different studies, complicating direct comparison of results and designs across studies and countries. The bioavailability of carotenoids is influenced by systemic factors such as age, sex, genotype, physiological state, chronic or acute disease and intestinal digestion and absorption(Reference Al-Delaimy, Slimani and Ferrari28, Reference Al-Delaimy, Ferrari and Slimani50, Reference Castenmiller and West58, Reference Gibson59) in addition to food processing and diet composition(Reference Maiani, Caston and Catasta27, Reference van het Hof, West and Weststrate60). Plasma carotenoid concentrations are also influenced by smoking(Reference Alberg61), as well as by intake of carotenoid supplements(Reference Maiani, Caston and Catasta27). Likewise, the bioavailability of flavonoids varies with food matrix, genetic profile and the composition of intestinal microflora(Reference Crozier, Jaganath and Clifford62). Moreover, the absorption of flavonoids varies between individual flavonoids, depending on the molecular structure(Reference Rasmussen and Breinholt56), and the citrus flavanoids are more accessible to absorption and excretion than many other flavonoids(Reference Rasmussen and Breinholt56). The good association observed for hesperidin and naringenin in contrast to the poor association observed for quercetin in the present study is in agreement with previous studies(Reference Rasmussen and Breinholt56).
The invited study population was a random sample of the Norwegian adult population, but the participation rate was low. The age distribution in the study population was not significantly different from the general population but included fewer smokers (3 %) and slightly more women than in the general population (2 %). The last nationwide dietary survey in Norway in 1997(Reference Johansson and Solvoll32) showed that the average daily intake of fruit, berries, juice and vegetables was 357 g/d, whereas the corresponding numbers were approximately 500 and 420 g/d, estimated from the FFQ and the WR, respectively. This discrepancy is probably due to a higher intake of fruit and vegetables among our participants than the general population.
It is important to note the different reference periods for test and reference methods. The FFQ considers intake during the preceding year, the WR during 7 d, the plasma carotenoids mostly represent the preceding weeks of dietary exposure(Reference Castenmiller and West58), whereas the urinary flavonoids represent an even shorter time period, of days and hours(Reference Kanaze, Bounartzi and Georgarakis63). The observed half lives of plasma carotenoids suggest that repeated consumption of carotenoids results in fairly constant plasma carotenoid patterns for up to 1 year(Reference Cantilena, Stukel and Greenberg64). MacDonald et al. (Reference Macdonald, Hardcastle and Duthie65) observed that β-carotene and β-cryptoxanthin were suitable markers of long-term fruit and vegetable intake for up to 2 years. Despite different time frames, significant correlations were observed between the FFQ and the two biomarkers in the present study. However, higher correlations might have been found with an increased number of urine and blood samples, distributed over the same time period as covered by the FFQ. Overall, the present results suggest that the use of two independent biomarkers of fruit and vegetable intake in the method of triads is suitable for the evaluation of dietary assessments.
Conclusions
The FFQ provided estimates of fruit intake similar to the intakes from the WR. Moreover, based on the positive associations between the FFQ estimates, the biomarkers and the WR and the FFQ VC, the FFQ was found valid and suitable for ranking of subjects according to their usual intake of fruit and vegetables. Thus, the FFQ may be implemented as a dietary assessment tool for measuring fruit, juice and vegetable intake in future nutritional epidemiological studies.
Acknowledgements
The present study was supported by Aktieselskabet Freia Chocolate Fabrik's Medical Foundation, Throne-Holst Foundation for Nutrition Research, the Research Council of Norway and the Norwegian Cancer Society. Elin Bjørge Løken and Jannicke Fredriksen are acknowledged for assistance with the Food Database AE-07; Gunnar Åmlid for valuable help with Cardiff Teleform 2006 software; Vitas AS and Thomas Gundersen for the analyses of flavonoids in urine. R. B. and C. A. D. are shareholders in Vitas AS. The other authors declare that they have no competing interests. M. H. C. carried out the redesign of the FFQ, study design, data collection, statistical analyses and preparation of the manuscript. I. T. L. L. contributed to the study design, data collection and manuscript revision. A. K. carried out the analyses of plasma carotenoids and contributed to the study design, data collection and manuscript revision. J. M. G. estimated the CI in the method of triads. R. B. and C. A. D. contributed to funding, study design and manuscript revision. L. F. A. contributed to the study design, design of the FFQ, statistical analyses and manuscript revision. All authors read and approved the final manuscript.


