


Phytosterols or plant sterols (PS) are minor constituents and essential phytochemicals that are present in plant foods such as nuts, peanuts, sesame seeds, soyabean seeds and grains, as well as their products. The most common PS in foods are sitosterol (SS), campesterol and stigmasterol, representing about 50–65, 10–40 and 0–35 % of the total PS fraction, respectively(Reference Bradford and Awad1). PS are well-known cholesterol-lowering agents(Reference Abumweis, Barake and Jones2), and several theories have been proposed to explain their action(Reference Rozner and Garti3). Some studies have shown that PS compete with and displace cholesterol from bile salt/phospholipid micelles, the form from which cholesterol absorption occurs. SS has increased affinity for biliary micelles compared with cholesterol, so SS uptake by micelles is energetically favoured(Reference Awad, Chen and Fink4). Unlike cholesterol, PS are poorly absorbed, and the small absorbed amount is actively re-excreted into the bile, resulting in low serum levels of these sterol molecules. Notwithstanding the low plasma concentration, due to their similarities with cholesterol, PS can be incorporated into cell membranes and affect their composition and functionality(Reference Awad, Chen and Fink4).
Besides the cholesterol-lowering effect, PS have been shown to inhibit the growth and development of tumours(Reference Tapiero, Townsend and Tew5) at concentration levels within the physiological human blood range. Normal PS blood concentration in humans is about 10–15 μm, and it doubles when a vegetarian or a PS-rich diet is consumed(Reference Awad, Smith and Fink6, Reference Windler, Zyriax and Kuipers7). The anti-neoplastic activity of PS is accounted for by their incorporation into the cell membranes, resulting in the alteration of membrane fluidity, membrane-bound enzyme activity and signal transduction(Reference Ju, Clausen and Allred8).
Although, to date, clinical studies have demonstrated no obvious side effects of dietary PS, apart from a reduction in carotenoid blood levels(Reference Jones and AbuMweis9), the similarity between anti-neoplastic and cholesterol-lowering concentrations deserves attention. Few studies have addressed the effect of PS on non-neoplastic cells. Awad et al. (Reference Awad, Smith and Fink6) showed in an in vitro study that SS inhibited smooth muscle cell proliferation. Rubis et al. (Reference Rubis, Paszel and Kaczmarek10) evidenced strong cytotoxic properties of SS at a very low concentration (2 μm) in human abdominal aorta endothelial cells. These effects, keeping a balance between the proliferation and apoptosis of endothelial cells, have been considered positive in atherosclerosis prevention(Reference Mayr and Xu11). Notwithstanding, they further raise concerns about the possibility of the detrimental effects of PS on other non-neoplastic cell types and, therefore, on their long-term use as nutritional hypolipidaemic agents.
To further clarify this important issue, in the present study we evaluated the effect of the supplementation of a mixture of soyabean-derived PS, in which the main component was SS, using primary cultures of neonatal rat cardiomyocytes as a model of non-neoplastic cells. We chose primary cultures of cardiomyocytes for two main reasons. First, we wanted to avoid the use of immortalised cell lines derived from neoplastic cells. Second, the heart is considered to be the target organ for subchronic toxicity of PS(Reference Kim, Kang and Shin12). Due to the recommendation of high PS intake for a long time in primary and secondary cardiovascular prevention(Reference Marangoni and Poli13), the clarification of the effect of PS on cardiac cells is extremely important.
We supplemented cardiomyocytes with two different PS concentrations, both within the range of plasma concentration considered effective for the cholesterol-lowering effect(Reference Vanstone, Raeini-Sarjaz and Parsons14). To exclude that the observed effects, if any, could be accounted for by PS oxidation products (POP), which are negatively perceived in terms of health(Reference Hovenkamp, Demonty and Plat15), the POP content in the PS mixture used for supplementation was also determined.
The present results represent the first report of PS incorporation in cardiac cells and show evidence of the possibility of a negative effect related to their incorporation. It is important to consider that cultured cardiomyocytes represent a model system in which cells do not feel the effects of digestion, absorption, metabolism and hepatic detoxification. Results obtained in cultured cells do not unambiguously reflect what happens in the human body. Notwithstanding, they can focus on the activity of specific bioactive compounds and can represent the starting point for future clinical investigation.
Experimental methods
Materials
Horse serum, fetal calf serum, Ham F10 and other biochemicals, as well as the PS mixture (derived from soyabeans) used for supplementing cells, were from Sigma-Aldrich (St Louis, MO, USA). Chemicals and solvents, unless specified, were of analytical grade and purchased from Carlo Erba Reagenti (Rodano, Italy), Merck (Darmstadt, Germany) and Sigma-Aldrich. Dihydrocholesterol (assay 94·8 %), employed as an internal standard for the quantification of PS, and campesterol, stigmasterol and SS, used for the identification of PS compounds, were from Sigma-Aldrich. 19-Hydroxycholesterol from Steroloids (Newport, RI, USA) was employed as an internal standard to quantify POP in the PS mixture adopted for cell supplementation. Deionised water was obtained from a water purification system, Elix 10 (Millipore, Bedford, CT, USA).
Methods
Quantification of phytosterols and phytosterol oxidation products in the phytosterol mixture
Soyabean-derived PS mixture powder (10 mg) employed for cell supplementation was dissolved in 10 ml n-hexane–i-propanol (4:1, v/v). Dihydrocholesterol (0·2 mg) in n-hexane–i-propanol (4:1 (v/v), c = 1·9 mg/ml) was added as an internal standard to 1 ml of the PS solution. After silylation being performed according to Sweeley et al. (Reference Sweeley, Bentley and Makita16) and the addition of 4 ml of n-hexane, samples were centrifuged at 1000 g for 3 min. The resulting solution (1 μl) was analysed using a GC/MS apparatus model, GCMS-QP2010 Plus (Shimadzu, Tokyo, Japan). Gas chromatographic conditions were as follows: injector temperature, 310°C; oven temperature, from 265 to 310°C at 0·80°C/min, finally held at 310°C for 10 min; gas carrier (He) velocity, 30·0 cm/s. The separation was carried out on a fused silica capillary column Zebron ZB-5 (30 m × 0·25 mm internal diameter, 0·25 μm film thickness) coated with 95 % dimethyl–5 % diphenyl polysiloxane (Phenomenex, Torrance, CA, USA). Instrumental conditions employed for the MS detector were as follows: acquisition mode, total ion current; ion source temperature, 230°C; interface temperature, 210°C; detector voltage, 0·95 kV; scan range, from 40 to 600 m/z; scan speed, 1250 u/s; solvent delay time, 10 min. Data were filed and processed by the software GCMSsolution version 2.50 SU1 from Shimadzu. PS identification was achieved by comparing peak mass spectra with those obtained from a standard mixture containing campesterol, stigmasterol and SS and with the data reported by Pelillo et al. (Reference Pelillo, Iafelice and Marconi17). Quantification of identified PS was done relative to dihydrocholesterol.
To evaluate the content of POP in the soyabean-derived PS mixture, 10 μg of 19-hydroxycholesterol in n-hexane–i-propanol (4:1, v/v) were added as the internal standard (c = 0·1 mg/ml) to 3 ml of the aforementioned PS solution in n-hexane–i-propanol. After drying and the addition of 1 ml of n-hexane–ethyl acetate (95:5, v/v), POP were purified by solid-phase extraction(Reference Rose-Sallin, Huggett and Bosset18) using aminopropyl-bonded phase cartridges (STRATA NH2, 500 mg stationary phase, 3 ml reservoir volume) from Phenomenex. To evaluate the recovery of the procedure, 9 μg of dihydrocholesterol in n-hexane–i-propanol (4:1 (v/v), c = 0·07 mg/ml) were added to the POP-containing fraction, which was then silylated(Reference Sweeley, Bentley and Makita16), and centrifuged at 1000 g for 3 min after the addition of 300 μl of n-hexane. The resulting solution (1 μl) was analysed by GC/MS under the same conditions as reported earlier. POP were identified by comparing the peak mass spectra with those reported by Dutta(Reference Dutta, Guardiola, Dutta, Codony and Savage19). Quantification of identified POP was done relative to 19-hydroxycholesterol.
Cell culture
Heart cells were obtained from the ventricles of 2–4-d-old Wistar rats as reported(Reference Danesi, Di Nunzio and Boschetti20). This investigation conforms to the Guide for the Care and Use of Laboratory Animals published by the US National Institutes of Health (publication no. 85-23, 5 revised 1996). The study was approved by the Ethical Committee for Animal Care of the University of Bologna (Italy) (protocol no. 58897-X/10). Apart from cell growth determination, due to technical reasons, cells were seeded at 1 × 10⁶ cells/ml concentration. At 24 h after seeding (T0), cardiomyocytes were divided at random in control, grown in a control medium (Ham F10 plus 10 % fetal calf serum plus 10 % horse serum), and supplemented and grown in the same medium supplemented with PS (3 or 6 μg/ml). The PS stock solution (600 μg/ml) was prepared by dissolving the mother solution (derived from soyabeans, and containing 45 % SS, 35 % campesterol and 5 % stigmasterol, as determined) in 100 % ethanol. Control cells received a similar amount of ethanol ( < 0·01 %, v/v) to avoid interference due to the vehicle. Media were changed every 2 d, the last change being 48 h before the experiment. Before each determination, at each time point, viable cells were counted by trypan blue dye exclusion. On day 6 (T144), control cardiomyocytes were at complete confluence, as assessed by cell counting and by protein determination with the method of Bradford(Reference Bradford21).
Cell count: trypan blue exclusion test
The trypan blue exclusion test was performed by adding 25 μl of 0·1 % trypan blue solution to 100 μl of cells suspended in PBS. The cells that excluded the dye were counted on a haemocytometer as described(Reference Ahmad, White and Chang22).
Identification and quantification of phytosterols in cardiomyocytes by GC/MS
On day 6 (T144), cells were washed three times in PBS and scraped off in cold n-hexane–isopropanol (4:1, v/v). PS were recovered from lipids after a cold saponification(Reference Sander, Addis and Park23), using dihydrocholesterol as the internal standard. Before GC/MS analysis, the trimethylsilyl derivatives of PS were obtained as reported by Sweeley et al. (Reference Sweeley, Bentley and Makita16). The derivatised sample (1 μl) was analysed under the same conditions as reported previously. PS identification was achieved by comparing peak mass spectra with a standard mixture containing campesterol, stigmasterol and SS and with the data reported by Pelillo et al. (Reference Pelillo, Iafelice and Marconi17). Quantification of identified PS was done relative to dihydrocholesterol.
Cytotoxicity
According to the cytotoxicity assay techniques, cytotoxicity was evaluated as cell metabolic activity using the 3-(4,5-dimethyldiazol-2-yl)-2,5-diphenyltetrazolium bromide (MTT) colorimetric assay(Reference Wichmann, Daegelmann and Herbarth24). At T144, after a washing with 0·9 % NaCl, 1 ml of MTT reagent diluted in Roswell Park Memorial Institute (RPMI)-1640 medium modified without phenol red (1 mg/ml) was added to each dish, and the cell cultures were incubated for 3 h at 37°C. After removal of the medium, the cells were lysed with isopropanol for 15–20 min. Formazan production, which is proportional to cell vitality, was determined spectrophotometrically at 560 nm.
Cell growth curve
Cells were seeded in twenty-four-well plates at a concentration of 2 × 10⁵/well. For each time point, two to four replicates were performed. Viable cells were counted each day for the following 6 d (T0, T24, T48, T96, T120 and T144).
Cell cycle
Cells were seeded in duplicate in six-well plates. At each time point (T0, T12, T24, T48, T72, T96 and T144), cardiomyocytes were washed with PBS, harvested and resuspended in 500 μl of a solution (0·1 % sodium citrate, 0·1 % Triton X-100 in PBS) containing propidium iodide (PI, 50 μg/ml), as described(Reference Nicoletti, Migliorati and Pagliacci25). Cell cycle analysis was performed by cytofluorimetric detection of DNA content with a FACSCalibur Cytometer (Becton Dickinson, Mansfield, MA, USA) after staining with PI.
Apoptosis
Cells were plated in duplicate in six-well plates. At each time point (T0, T12, T24, T48, T72, T96 and T144), after counting for viable cells, cell number was normalised to 5 × 10⁵, and apoptosis was verified using two different methods. In the first one (PI uptake), cells were washed with PBS, harvested and resuspended in 500 μl of PI buffer(Reference Nicoletti, Migliorati and Pagliacci25). PI-stained cells were analysed by flow cytometry as described previously; apoptotic cells were counted as the percentage of sub-G1 cells. In the second one (Annexin-V binding), cells were washed with PBS, harvested and resuspended in 100 μl of Annexin-V-Fluos and PI-labelling solution (Roche, Penzberg, Germany) for 15 min. The stained cells were analysed by flow cytometry with a FACSCalibur Cytometer (Becton Dickinson); apoptotic cells were counted as the percentage of Annexin-V-positive, PI-negative cells.
Cell membrane damage: lactate dehydrogenase release in media
Cells were seeded in duplicate in six-well plates. To evaluate the possible damage to cell membrane integrity, the release of the lactate dehydrogenase enzyme in the media was determined. At each time point (T24, T48, T96 and T144), lactate dehydrogenase activity in the media was determined spectrophotometrically by measuring NADH levels at 340 nm(Reference Korzeniewski and Callewaert26).
Statistical analysis
The reported data are the means of at least three samples obtained from independent cell cultures. Statistical analysis was carried out by one-way ANOVA using Tukey's post-test. P values less than 0·05 were considered significant.
Results
The composition of the supplemented PS solution was analysed before experiments and is reported in Fig. 1. The total POP content in the PS mixture was low (0·124 (sd 0·012) g/100 g), and the amount of single POP identified is shown in Fig. 2. As regards the performance of the analytical methods employed in the present study, the determination of PS after cold saponification ensured a good reproducibility, with a relative standard deviation associated with total PS amount, which was usually less than 5 %. POP purification in the cell feeding mixture by solid-phase extraction showed a high recovery percentage (85·9 (sd 1·5) %) and an acceptable reproducibility (approximately 9 %) with regard to the amount of total oxidised sterols detected.

Fig. 1 Gas chromatographic trace of trimethylsilyl ethers of sterols contained in the phytosterol mixture. Peak identification: internal standard (IS, dihydrocholesterol); 1, cholesterol; 2, brassicasterol; 3, campesterol; 4, campestanol; 5, stigmasterol; 6, stigmastanol; 7, clerosterol; 8, sitosterol; 9, sitostanol; 10, avenasterol; 11, fucosterol; 12, Δ7-sitosterol. For analytical conditions, see the Methods section.

Fig. 2 Gas chromatographic trace of trimethylsilyl ethers of phytosterol (PS) oxidation products purified from the PS mixture. Peak identification: internal standard 1 (IS1, dihydrocholesterol); IS2, 19-hydroxy cholesterol; 1, 7α-hydroxy campesterol; 2, 7α-hydroxy stigmasterol; 3, 7α-hydroxy sitosterol; 4, sitotrienol; 5, 7β-hydroxy sitosterol; 6, 7-ketocampesterol; 7, 7-ketostigamsterol; 8, 7-ketositosterol. Peaks marked with an asterisk were non-oxidised sterols. Other peaks were not identified. For analytical conditions, see the Methods section.
Incorporation of supplemented PS by cardiomyocytes was verified at T144. On that day, control cardiomyocytes were at complete confluence, as determined by microscopy. To evaluate whether PS-supplemented cardiomyocytes also reached confluence at T144, cells were counted and protein content was determined, showing no differences among groups (Table 1). As shown in Fig. 3, cardiomyocytes actively incorporated the supplemented PS, in a dose-dependent manner (r 2 0·92). Cholesterol content significantly decreased in PS-supplemented cardiomyocytes compared with controls, with no difference between the two supplemented groups. According to the composition of the supplemented PS solution, SS appeared to be the most incorporated one, followed by campesterol and stigmasterol (Fig. 4). Fig. 5 illustrates the different chromatographic traces of PS extracted from cardiomyocytes grown in non-supplemented and supplemented media.
Table 1 Cell number and protein content at day 6 (T144) in the different experimental conditions*
(Mean values and standard deviations of at least three samples obtained from independent cell cultures)
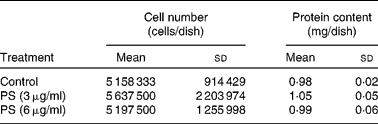
PS, phytosterol.
* No differences in cell number and protein among the different experimental conditions were determined by one-way ANOVA.

Fig. 3 Total phytosterol (PS) and cholesterol content of unsupplemented and supplemented cardiomyocytes. PS and cholesterol concentrations were determined as described in the Methods section. Results are expressed as μg/dish and are means of at least three samples obtained from independent cell cultures, with standard deviations represented by vertical bars. Mean percentage changes with respect to unsupplemented cells are reported above the corresponding bar. Statistical analysis was carried out by one-way ANOVA (PS: P < 0·001, cholesterol: P < 0·01) using Tukey's post-test (control v. PS: * P < 0·05, ** P < 0·01, *** P < 0·001; 3 μg/ml v. 6 μg/ml: PS P < 0·001, cholesterol: NS). □, Control; ![]() , PS (3 μg/ml);
, PS (3 μg/ml); ![]() , PS (6 μg/ml).
, PS (6 μg/ml).

Fig. 4 Distribution of the different phytosterols (PS) in unsupplemented and supplemented cardiomyocytes. PS incorporation was determined as described in the Methods section. Results are expressed as μg/dish and are means of at least three samples obtained from independent cell cultures, with standard deviations represented by vertical bars. Mean percentage changes with respect to unsupplemented cells are reported above the corresponding bar. Statistical analysis was carried out by one-way ANOVA (campesterol, P < 0·001; stigmasterol, P < 0·001; sitosterol, P < 0·001; avenasterol, P < 0·01) using Tukey's post-test for evaluating differences between PS-supplemented cells and control (* P < 0·05, ** P < 0·01, *** P < 0·001) and between the two PS concentrations used (campesterol, P < 0·001; stigmasterol, P < 0·01; sitosterol, P < 0·001; avenasterol, NS). ND, not determined. □, Control; ![]() , PS (3 μg/ml);
, PS (3 μg/ml); ![]() , PS (6 μg/ml).
, PS (6 μg/ml).

Fig. 5 Gas chromatographic traces of trimethylsilyl ethers of sterols recovered from the lipid fraction of unsupplemented and phytosterol (PS)-supplemented cardiomyocytes. Cardiomyocytes were grown in unsupplemented (trace A), 3 μg/ml PS-supplemented (trace B) and 6 μg/ml PS-supplemented (trace C) media. Peak identification: internal standard (IS, dihydrocholesterol); 1, cholesterol; 2, campesterol; 3, campestanol; 4, stigmasterol; 5, stigmastanol; 6, clerosterol; 7, sitosterol; 8, sitostanol; 9, avenasterol. For analytical conditions, see the Methods section.
To verify the possible interference between the observed PS incorporation and cardiomyocyte metabolic activity, the MTT assay was also performed at T144. MTT conversion to formazan appeared reduced in supplemented cardiomyocytes compared with controls, independent of PS concentration in the media (Fig. 6).

Fig. 6 Metabolic activity in unsupplemented and phytosterol (PS)-supplemented cardiomyocytes. 3-(4,5-Dimethyldiazol-2-yl)-2,5-diphenyltetrazolium bromide (MTT) conversion to formazan, as a measure of metabolic activity, was determined as reported in the Methods section and expressed as the percentage of the value obtained in unsupplemented cells (assigned as 100 %). Values are means of at least three samples obtained from independent cell cultures, with standard deviations represented by vertical bars. Mean percentage changes with respect to unsupplemented cells are reported above the corresponding bar. Statistical analysis was carried out by one-way ANOVA (P < 0·001) using Tukey's post-test (control v. PS: *** P < 0·001; 3 μg/ml v. 6 μg/ml: NS).
The pro- or anti-apoptotic effects of PS were investigated using two different independent methods: PI uptake (data not shown) and Annexin-V (Fig. 7). One of the earliest features of apoptosis is a morphological change in the plasma membrane. This involves the translocation of the membrane phospholipid phosphatidylserine from the internal layer to the external layer of the cell membrane. In the presence of Ca ions, Annexin-V has a high specificity and affinity for phospholipid phosphatidylserine. The translocation of phospholipid phosphatidylserine precedes detectable nuclear changes such as DNA degradation, allowing early apoptotic cells to be discerned. Apoptotic cells become Annexin-V-positive after nuclear condensation has started, but before the cell becomes permeable to PI. As a result, early apoptotic cells can be Annexin-V-positive and PI-negative. After having evidenced no differences at any time point in the number of apoptotic cells with PI staining, to be sure that PS supplementation did not cause apoptosis, we measured it with the Annexin-V assay. Even in this case, no differences between the control and supplemented cells were detected.

Fig. 7 Apoptotic effect of phytosterol (PS) supplementation evaluated using Annexin-V at different time points. Values are means of at least three samples obtained from independent cell cultures, with standard deviations represented by vertical bars. Mean percentage changes with respect to unsupplemented cells are reported above the corresponding bar. No differences in the number of apoptotic cells were detected among groups at any time point by one-way ANOVA. □, Control; ![]() , PS (3 μg/ml);
, PS (3 μg/ml); ![]() , PS (6 μg/ml).
, PS (6 μg/ml).
Lactate dehydrogenase release in the media was also evaluated, and no differences were detected among groups at any time point (data not shown).
Regarding the cell cycle, the distribution of cell populations was similar in both the control and PS-supplemented cells (Fig. 8), but significant differences were observed in the growth curve. Performing this analysis, for technical reasons, cells were seeded at a lower concentration to prevent them from reaching confluence in an early stage, therefore hiding possible differences in cell growth. As evidenced in Fig. 9, the supplemented cardiomyocytes grew more slowly than the controls.

Fig. 8 Cell cycle distribution in control and phytosterol (PS)-supplemented cardiomyocytes at different time points. The bar graph shows the distribution of cells among the different phases of the cell cycle: G0/G1 phase, quiescent cells; S phase, DNA replicating cells; G2/M phase, cells with two full complements of DNA or at the mitotic phase. Values are means of at least three samples obtained from independent cell cultures, with standard deviations represented by vertical bars. No differences in the cell cycle distribution were detected among groups at any time point by one-way ANOVA. ![]() , G1 phase;
, G1 phase; ![]() , S phase; □, G2 phase.
, S phase; □, G2 phase.

Fig. 9 Cell growth analysis in unsupplemented and phytosterol (PS)-supplemented cardiomyocytes. Cell growth analysis was performed as reported in the Methods section, and cells counted at different time points. Values are means of at least three samples obtained from independent cell cultures, with standard deviations represented by vertical bars. Mean percentage changes with respect to unsupplemented cells are reported above the corresponding bar. Statistical analysis was carried out by one-way ANOVA (P < 0·05) using Tukey's post-test (control v. PS: * P < 0·05; 3 μg/ml v. 6 μg/ml: NS). ●, Control; ![]() , PS (3 μg/ml); ■, PS (6 μg/ml).
, PS (3 μg/ml); ■, PS (6 μg/ml).
Discussion
In neoplastic cells, PS anti-proliferative activity is accounted for by their incorporation into cell membranes(Reference Awad, Downie and Fink27), but the effects of PS incorporation into normal cells have been described in few studies, and never into cardiac cells. In the present study, following supplementation, a dose-dependent incorporation of PS by cardiomyocytes was clearly evidenced. It was accompanied by a decrease in cholesterol content.
Although it has been reported that SS induces apoptosis in cancer cells through caspase activation(Reference Awad, Roy and Fink28), we did not observe apoptosis in cardiomyocytes. Recently, Bao et al. (Reference Bao, Li and Deng29) showed evidence that SS did not activate the caspase-dependent pathway in non-neoplastic macrophages. The observed death of these cells was caspase-independent, involving necroptosis and autophagy, and was induced by SS concentration higher than those used in the present study.
The reduction in MTT into formazan pigment predominantly depends upon mitochondrial reductase activity and is also correlated with the mitochondrial metabolic capacity(Reference Gomez, Alekseev and Aleksandrova30). The lower MTT conversion observed in PS-supplemented cells suggests that the study compounds more efficiently target mitochondria, including cytochrome activity, than plasma membrane integrity. This is in agreement with our data on lactate dehydrogenase release.
Mitochondrial metabolism provides the heart with very high amounts of ATP daily(Reference Opie and Weinberg31), and the importance of intermediary metabolism to sustain the function of the heart has long been appreciated. The decrease in MTT reduction activity in PS-supplemented cardiomyocytes could suggest that cardiac energy metabolism is switched from the β-oxidation of fatty acids to glycolysis(Reference Kakinuma, Miyauchi and Yuki32), and Taegtmeyer(Reference Taegtmeyer33) has proposed that metabolic changes often antedate functional contractile changes in the heart. The reduced cell metabolic activity could also explain the results obtained on the cell growth curve. Further studies focused on mitochondrial metabolic activity, as well as on the evaluation of PS incorporation into mitochondria, are needed before unambiguously concluding that PS alter mitochondrial function and cardiac cell energy metabolism.
The replacement of cholesterol by PS could also have caused the observed slowing down of cell growth and the reduction in metabolic activity, which could rely on the PS increase, cholesterol decrease, or both. High sterol concentration within the cells is cytotoxic, and the enzyme acyl-CoA cholesterol acyltransferase represents one of the most important mechanisms for reducing excess sterols, preventing cytotoxicity(Reference Chang, Chang and Cheng34, Reference Tabas35). Previous studies have shown that PS are relatively poor substrates for acyl-CoA cholesterol acyltransferase(Reference Temel, Gebre and Parks36, Reference Liu, Chang and Westover37). According to the present results, Melchert et al. (Reference Melchert, Liu and Granberry38) showed evidence that the decrease in cell cholesterol content, due to the inhibition of cholesterol synthesis by statins, reduces growth and MTT reduction in cardiac myocytes, without significant changes in PI staining. Furthermore, replacement of cholesterol molecules by PS increases ion permeability(Reference Vemuri and Philipson39) and modifies the activity of enzymes such as Na+/K+-ATPase(Reference Naito, Nagata and Takano40) in biomembranes.
Another possible explanation of the present results could be related to PS oxidation. POP are formed during the processing and storage of foods. Although the currently available observations do not suggest that dietary POP, in relatively low concentrations such as those reported in human plasma, may exert in vivo deleterious effects similar to those attributed to oxycholesterol(Reference Hovenkamp, Demonty and Plat15), whether they affect human health is still unknown. Particularly, PS oxidation processes could take place in cells, producing not only harmful epoxy forms but also generating free radicals(Reference Rubis, Paszel and Kaczmarek10). Although POP were present in low amounts in the PS mixture used for cell supplementation, negative effects of PS could be in part dependent on POP production within the cell. Further studies are in progress to clarify this point.
A very recent study has shown evidence that β-SS at concentrations similar to those used in the present study inhibited vascular smooth muscle cell proliferation, interrupting the progress of the cell cycle, without affecting MTT conversion(Reference Chien, Lee and Liang41). It is therefore evident that the effects of PS can vary among cell types. The present study is the first report on the incorporation of PS in cardiac cells and on its consequent effect. Although PS supplementation appeared less deleterious than in neoplastic cells, the present results deserve important consideration. It is important to note that we grew cardiomyocytes in PS-supplemented media, so reproducing more closely the in vivo situation when consuming a PS-rich diet. In other studies, higher PS concentrations were supplemented to cells for a short time period.
Although, at present, it is difficult to translate the obtained results to the health of heart tissue, the slowed cardiac cell growth and metabolic activity could represent a potential hazard. The present results are far from giving unambiguous answers to this important concern, but they represent the starting point for future research. In their light, as already suggested by Lizard(Reference Lizard42), further investigations, evaluating the biological impact of long-term exposure to physiologically relevant PS concentrations in human subjects, are needed. They could verify the existence of a potential hazard due to the wide use of these bioactive compounds in the prevention and treatment of hypercholesterolaemia.
Acknowledgements
The authors declare that there are no conflicts of interest. The present study was supported by grants of Fondazione Cassa di Risparmio di Cesena (Italy) and of Italian MIUR (RFO). The authors' contributions were as follows: F. F., E. B., M. D. N., V. Ve., V. Va. and A. A. performed the analysis together with F. D., who also did the data analysis and contributed to the drafting of the manuscript; M. F. C. and A. B. designed and supervised the study, and wrote the manuscript together with A. P.


