At the global level, cereals and starch-based staples outweigh all other foodstuffs as sources of daily dietary energy. Among these foods, white bread prepared with wheat flour is the most frequently consumed cereal product(1), and, in turn, it is the main contributor to the glycaemic index (GI) of the human diet(Reference Fardet, Leenhardt and Lioger2). It is well known that white bread starch is rapidly digested and absorbed, eliciting high glucose and insulin responses(Reference Juntunen, Niskanen and Liukkonen3), and this characteristic makes bread a high-GI food (>70)(4). As bread is the most relevant source of available carbohydrates (CHO) in the diet and as lowering dietary GI is considered favourable to health, many studies have been carried out in order to decrease the GI of bread. The most relevant strategy that has been applied so far is the addition of fibre-rich flours or pure dietary fibre, which also adds nutritional value to bread. In fact, besides putatively influencing the glycaemic response, this approach enables the amount of dietary fibre offered to the population to be increased. However, the effectiveness of dietary fibre in bread in reducing the GI is controversial. Thus, the key issues of the present review are whether dietary fibre is able to reduce bread GI, which are the main mechanisms involved and which other approaches can be alternatively used for this purpose.
Glycaemic index concept
The GI is a parameter used to rank CHO food items based on their glycaemic potential(Reference Jenkins, Wolever and Taylor5). Food items with a high GI quickly raise blood glucose levels, which results in a higher insulin demand and secretion compared with low-GI foods. This index is measured in human volunteers following a standardised method(6). The use of the GI method for classifying CHO-rich foods was endorsed in 1997 by the FAO of the UN and the WHO. In 2003, the GI classification system differentiated CHO sources as low ( < 55), medium (55–69) or high GI ( ≥ 70)(Reference Brand-Miller, Hayne and Petocz7). By definition, the GI provides a measure of equi-CHO quality but not quantity. As both quantity and quality (i.e. nature or source) of CHO influence the glycaemic response, the concept of glycaemic load (GL) was introduced to calculate the overall glycaemic effect of a portion of food. This is defined as the product of the GI of a food and the amount of available CHO in a specific serving(Reference Salmerón, Manson and Stampfer8, Reference Salmerón, Ascherio and Rimm9), where the higher the GL, the greater the expected elevation in blood glucose. Venn et al. (Reference Venn, Wallace and Monro10) introduced a GL classification system for categorising food as having a low ( ≤ 10), medium (>10 to < 20) or high GL ( ≥ 20).
As evidence exists for a causal relationship between postprandial glucose regulation and improvements in many pathways thought to be involved in disease states, in 1997, during the FAO/WHO Expert Consultation in Rome, low-GI CHO were recommended for their physiological effects in reducing blood glucose concentration and insulin secretion, which are both associated with a reduced risk of developing non-insulin diabetes(11). Afterwards, the impact of dietary GI on human health was at length investigated and debated. In 2006, the Dietary Carbohydrates Task Force of the International Life Sciences Institute (ILSI) Europe debated the scientific evidence relating the dietary glycaemic response to health and disease. The task force concluded that low-GI and -GL diets are beneficial for the health of people with impaired glucose metabolism; in particular, the larger the divergence of glucose metabolism from the norm, the larger the impact of low-GI and -GL interventions(Reference Howlett and Ashwell12). However, it was still unclear whether or not they would be of benefit to healthy people. Moreover, unavailable CHO (e.g. dietary fibre), independent of GI, seems to have at least as big an effect on health outcomes as GI itself(Reference Howlett and Ashwell12). In 2010, the European Food Safety Authority concluded that although there is some support for the role of GI and GL in the treatment of type 2 diabetes and some evidence to suggest that lowering the GI and GL may have favourable effects on some metabolic risk factors such as serum lipids, the evidence regarding their role in the prevention of diet-related diseases is still inconclusive(13).
The glycaemic index of bread
At the global level, cereals and starch-based staples outweigh all other foodstuffs as sources of daily dietary energy. According to the latest FAO estimates, these foods provide 53 % of the world's average daily energy intake(1). Some types of cereals (e.g. rice) are commonly eaten in boiled form without further processing, other than milling, but most other cereals are usually processed for direct consumption and, in many diets, the main processing feature is the making of bread: leavened (Europe and North America) or unleavened wheat bread (the Near East, North Africa and parts of South Asia); maize bread (the Near East) and white and yellow maize unleavened bread (‘tortilla’, Latin America); millet and sorghum unleavened bread (India and Pakistan); barley bread (North Africa and the Near East); rye bread (Northern and Eastern Europe); cassava bread (Latin America and the Caribbean)(1).
Bread is a solid-like porous matrix with a quality that is dependent on several factors. The basic ingredients, the additives and the technological/processing aids, and the bread-making process, all influence the overall quality of fresh and stored breads to a variable extent. Generally, four different groups of dough development can be characterised, although there are numerous possible overlaps between the individual groups: (1) ‘straight dough bulk fermentation’ is characterised by resting periods for the dough in bulk after mixing and before dividing; (2) if one part of the dough receives a longer fermentation period before being added back to the remainder of the ingredients, the process is called ‘sponge and dough’; (3) dough prepared using the ‘rapid processing’ method has either a very short or no bulk fermentation step after mixing and before dividing; (4) ‘mechanical dough development’ is where the dough is directly portioned after mixing without resting. Dough development is solely facilitated by the input of energy through mixing(Reference Cauvain, Cauvain and Young14). In addition, the baking process is of great importance for the quality of baked goods. Due to the heat in the baking oven, all components undergo fundamental chemical and physical changes. Gases will expand, proteins coagulate, starch gelatinises, water evaporates and enzymes or microbes die. These processes lead to a stable structure of the baked goods, allowing bread to be sliced or spread. A longer shelf life, a higher volume, porosity and reduced elasticity, easier digestibility, and changes in colour, smell and taste have contributed to the popularity of baked goods and are the key factors for why this process is permanently modified and controlled. Nowadays, functional ingredients that aim to improve bread quality by affecting the growth of yeast (yeast food), improving the flour (gluten network) or conditioning the dough (enhancement and control of gas production or gas retention) are added.
Apart from the local specific production, white bread prepared with wheat flour is the most frequently consumed type of bread(1), and, in turn, it is the main contributor to dietary GI(Reference Fardet, Leenhardt and Lioger2). It is well known that white bread is a rapidly digested and absorbed food that elicits high glucose and insulin responses(Reference Juntunen, Niskanen and Liukkonen3). The baking process, mechanical kneading and the respiration of baking yeasts mean that bread is easily destructured in the mouth and stomach(Reference Fardet, Leenhardt and Lioger2). This reduction in particle size of the bread favours the subsequent accessibility of starch to pancreatic α-amylases in the small intestine. Moreover, another reason for the relatively high GI of white wheat breads is the fact that starch is highly gelatinised during the baking process (at a temperature of 250°C), making it particularly accessible to salivary and pancreatic α-amylases(Reference Fardet, Leenhardt and Lioger2). Therefore, the highly porous structure and highly gelatinised starch cause the high GI of bread (>70), so that when white bread is used as a standard food in the GI determination instead of glucose, the GI is set at 100. On the GI database, there are twenty white breads prepared with wheat flour with a mean GI of 75 (ranging from 59 to 89)(4).
Strategies for reducing the glycaemic index of bread
As bread is the starch-based staple most frequently consumed in the diet and as the consumption of low- to moderate-GI ( < 70) foods is considered favourable to health(11), many studies have been conducted in order to decrease bread GI. The main strategy used, which also has a good impact on nutritional status, is the addition of fibre-rich flours or of pure dietary fibre. In fact, besides having a positive effect on glycaemic response, this strategy also helps to introduce more dietary fibre into the diet.
The definition of dietary fibre has been much debated and is related to both physiological considerations and to methods that can be used for measuring dietary fibre in foods. To date, different definitions are available. For the American Dietetic Association(15), dietary fibre is primarily the storage and cell-wall polysaccharides of plants that cannot be hydrolysed by human digestive enzymes. The international definition of dietary fibre adopted in June 2009 by the Codex Alimentarius Commission(16) is more restricted. The Commission considers that the term ‘dietary fibre’ should be reserved for the cell-wall polysaccharides of vegetables, fruits and whole grains, the health benefits of which have been clearly established, rather than synthetic, isolated or purified oligosaccharides and polysaccharides with diverse, and in some cases unique, physiological effects. Thus, the Scientific Update agreed to define ‘dietary fibre’ as ‘intrinsic plant cell-wall polysaccharides’. In the same year, the European Food Safety Authority defined dietary fibre as non-digestible (in the human small intestine) CHO plus lignin(17). As a consequence, it is not trivial to evaluate whether an ingredient, such as psyllium, added to bread could be effectively considered as dietary fibre.
Moreover, despite the observed association between dietary fibre and the reduction of disease risks (obesity(Reference Maki, Beiseigel and Jonnalagadda18–Reference Liu, Willett and Manson21), insulin sensitivity(Reference Pereira and Ludwig22–Reference Rave, Roggen and Dellweg26), diabetes(Reference Weickert and Pfeiffer27–Reference de Munter, Hu and Spiegelman30), CVD(Reference Brown, Rosner and Willett31–Reference Jensen, Koh-Banerjee and Hu35), CHD(Reference Bazzano, He and Ogden36, Reference Pereira, O'Reilly and Augustsson37) and cancer(Reference Dahm, Keogh and Spencer38–Reference Schatzkin, Park and Leitzmann44)), the ideal type of fibre and the amount that should be consumed are still not clearly defined. Water-insoluble forms of fibre have been recommended for their effects in promoting colonic mucosal health through causing various changes in bowel function, such as increasing faecal bulk or reducing transit time through the gut. Conversely, solubility in water, viscosity and fermentability are commonly believed to be more influential at the metabolic level by decreasing blood cholesterol or glucose concentrations. Both types of fibre increase stomach distension, which increases satiety and slows nutrient absorption. In any case, regardless of the physiological effect, fibre from cereal seems to be more effective than that from fruit and vegetables in relation to diabetes(Reference Weickert and Pfeiffer27), body weight(Reference Du, van der and Boshuizen19), insulin sensitivity(Reference Weickert, Mohlig and Schofl45), small-intestinal cancer and total and cause-specific deaths(Reference Schatzkin, Mouw and Park41, Reference Park, Subar and Hollenbeck46). On the other hand, fibre from fruit and vegetables is more helpful in preventing stomach cancer and colorectal cancer(Reference Tabernero, Serrano and Saura-Calixto39, Reference Bravi, Scotti and Bosetti43). In this case, the healthier effect of dietary fibre from fruits and vegetables has been partly attributed to the polyphenols associated with these fibre types.
Although the terms soluble and insoluble are widely used throughout the literature, the FAO/WHO proposed that the distinction between soluble and insoluble fibre should be phased out(11). Initially, the two terms distinguished the physiological properties of dietary fibre, allowing a simple division into those that principally had effects on glucose and lipid absorption from the small intestine (soluble) and those that were slowly and incompletely fermented and which had more pronounced effects on bowel habits (insoluble). However, the separation of soluble and insoluble fractions is not chemically very distinct depending on the conditions of extraction. Moreover, the physiological differences are not, in fact, so distinct, with much insoluble fibre being rapidly and completely fermented while not all soluble fibre has effects on glucose and lipid absorption.
The addition of fibre for reducing the glycaemic index of bread
As stated above, the main strategy used for reducing the GI of bread is the addition of fibre. Many studies have been conducted to investigate and support this strategy: in vitro evaluations of whether or not the presence of dietary fibre could affect starch accessibility and digestibility or intestinal fermentation; in vivo measurements of the GI or the postprandial glucose response after the ingestion of breads that naturally contain fibre or have different types of fibre added. However, the data accumulated thus far on the effects of the quantity and quality of fibre in bread regarding postprandial glycaemia are controversial. In fact, despite their different fibre contents, it was shown that white and wholemeal breads resulted in similar postprandial glycaemic responses in both diabetic volunteers and healthy subjects(Reference Jenkins, Wolever and Jenkins47, Reference Scazzina, Del Rio and Pellegrini48). Similarly, in type 2 diabetic subjects, 3 months of high-fibre bread and breakfast cereals, made by adding ultra-finely ground wheat bran to high-fibre bread (19 g/d additional cereal fibre), did not improve the conventional markers of glycaemic control compared with 3 months of low-fibre food controls (4 g/d additional cereal fibre)(Reference Jenkins, Kendall and Augustin49). Likewise, Andersson et al. (Reference Andersson, Tengblad and Karlström50) included whole-grain or refined-grain products (predominantly bread made with milled whole wheat) in the habitual daily diet of overweight subjects for two 6-week periods. The substitution of whole grains for refined-grain products did not affect insulin sensitivity or the markers of lipid peroxidation and inflammation(Reference Andersson, Tengblad and Karlström50). In both of the studies cited above, the breads were made with milled whole wheat, and it is likely that the degree of milling justified the lack of the fibre effect. Therefore, in order to modulate the effect of bread on the glycaemic response, different aspects have to be considered besides the mere presence of fibre. The main ones are the type and chemical characteristics of the fibre used, and the degree of milling of grains and the kind of cereal used for making the bread. Andersson et al. (Reference Andersson, Tengblad and Karlström50) stated that whole wheat, which contains less soluble and more insoluble fibre than rye, oats or barley, did not improve glucose or insulin control, as the positive effect of fibre in reducing the glycaemic response has been mostly attributed to its physiological activity in making the chyme in the upper digestive tract viscous(Reference Andersson, Tengblad and Karlström50, Reference Jenkins, Wolever and Leeds51).
Viscous v. non-viscous fibre
The low glycaemic responses to food consumption observed in some studies have been explained by the presence of viscous fibre, which may slow the gastric emptying rate or the absorption of nutrients in the small intestine(Reference Ray, Mansell and Knight52–Reference Fairchild, Ellis and Byrne54). This effect was evident when arabinoxylan, the major dietary fibre component in cereal grains, was extracted from wheat bran to produce a rapidly fermentable, soluble arabinoxylan-rich fibre that behaved like a gel matrix and which was added to bread(Reference Lu, Walker and Muir55). In an acute study, the addition of increasing amounts of this fibre to a bread meal (0, 6 and 12 g) significantly lowered the postprandial glucose and insulin responses in healthy people in a dose–response manner(Reference Lu, Walker and Muir55). Moreover, bread containing arabinoxylan-rich fibre proved to be palatable and acceptable to subjects. This positive effect was confirmed in a 5-week intervention study with type 2 diabetic patients in which an improvement of fasting and 2 h plasma glucose, 2 h insulin and serum fructosamine was observed by supplementing their diet with 15 g/d of arabinoxylan-rich fibre (in bread or muffins)(Reference Lu, Walker and Muir56). Similarly, the consumption of bread rolls supplemented with 15 g arabinoxylan for 6 weeks improved fasting serum glucose levels in subjects with impaired glucose tolerance(Reference Garcia, Otto and Reich57).
Another type of soluble fibre, β-d-glucan, present in oats and barley, has demonstrated to be effective in attenuating postprandial glycaemic and insulin responses. β-Glucans are NSP composed of glucose molecules in long, linear glucose polymers with mixed β-(1 → 4) and β-(1 → 3) links at an approximate distribution of 70–30 %, respectively. However, the natural content of β-glucan in normal oats and barley is insufficient to lower metabolic responses to bread(Reference Liljeberg, Granfeldt and Björck58). In fact, it has been shown that the consumption of wholemeal products made with common cultivars of oat or barley, such as wholemeal barley bread or oat muesli and oat porridge, did not result in lower postprandial blood glucose or insulin responses in healthy subjects compared with white bread(Reference Liljeberg and Björck59, Reference Granfeldt, Hagander and Bjorck60). On the other hand, breads made with 50 or 80 % of a high-fibre barley genotype (Prowashonupana) flour added to common barley flour and containing 11 and 15 % of β-glucan induced a significantly lower GI (71 and 61, respectively) compared with white bread (GI = 100) in healthy subjects(Reference Liljeberg, Granfeldt and Björck58). The cultivar Prowashonupana is a waxy barley with a low starch content (about 31 %) and a high β-glucan content (about 18 %), whereas a common barley cultivar has starch and β-glucan contents of about 68 and 5 %, respectively. The effect of (1 → 3,1 → 4)-β-d-glucan-rich barley incorporated into bread on the GI was attributed to quantity. The breads with 35, 50 and 75 % of Prowashonupana had GI values equal to 75, 65 and 55, but still maintaining a high level of palatability(Reference Ostman, Rossi and Larsson61). The effect of β-glucan in decreasing the GI of barley-containing foods is mainly due to its viscosity, which lowers the motility of luminal contents and/or increases unstirred layers, reducing the absorption of hydrolysed starch. However, not all barley cultivars show the same level of viscosity. In fact, when Aldughpassi et al. (Reference Aldughpassi, Abdel-Aal and Wolever62) tested in vivo whole-grain kernels of nine different kinds of barley cultivars, they found that the high viscosity of Celebrity and the low viscosity of AC Klink caused low(Reference de Munter, Hu and Spiegelman30) and high(Reference Andersson, Tengblad and Karlström50) GI values, respectively. Viscosity is a function of the concentration of dissolved β-glucan and of its molecular weight (MW)(Reference Wood, Weisz and Beer63). Frank et al. (Reference Frank, Sundberg and Kamal-Eldin64) investigated the effect of two yeast-leavened breads containing β-glucans with average MW of 217 (low) and 797 kDa (high) on fasting glucose and insulin levels, but not on postprandial glucose responses, in a 3-week cross-over trial. Bread containing high-MW β-glucan lowered the fasting blood glucose level compared with baseline concentrations, whereas the low-MW β-glucan bread had no effect on these levels(Reference Jaskari, Henriksson and Nieminen65). However, β-glucan can be partially hydrolysed during baking, partially losing its viscosity(Reference Jaskari, Henriksson and Nieminen65). This seems to have been confirmed by Juntunen et al. (Reference Juntunen, Niskanen and Liukkonen3), who compared four test products (whole-kernel rye bread, wholemeal rye bread containing an oat β-glucan concentrate, dark durum wheat pasta and wheat bread made from white wheat flour) on gastric emptying and glycaemic and insulinaemic responses. No significant differences were found between the responses of glucose to rye breads and pasta relative to white wheat bread, or in the rate of gastric emptying after the consumption of these grain products by healthy men and women. The authors suggested that β-glucan was probably broken down to a lower MW during baking, thereby decreasing the expected viscosity effect of the bread. On the other hand, a lower insulinaemic response to the rye breads and pasta than to the wheat bread was found, which was not explained by the fibre contents, the type of cereal or the rate of gastric emptying, but by the structural properties of the food. In fact, on the basis of hydrolysis indices in vitro, the starch in pasta and whole-kernel rye bread was less accessible for starch hydrolysis than the starch in white wheat bread. Conversely, in β-glucan-enriched rye bread, the rate of starch hydrolysis was not significantly different from that of white wheat bread, despite the higher content of soluble fibre in the rye bread(Reference Juntunen, Niskanen and Liukkonen3).
Besides the use of barley varieties rich in β-glucan, common barley flours can be enriched with β-glucan fractions in order to reduce the GI of bread. Cavallero et al. (Reference Cavallero, Empilli and Brighenti66) found that incorporating 20 % of a (1 → 3,1 → 4)-β-glucan-enriched fraction (water extracted from sieved barley flour) significantly reduced the GI (72 v. 100 for white bread). Moreover, bread with the extracted fraction showed the best scores for sensory attributes. The extraction of water boosted the β-glucan content of barley flour fractions from 8·5 % in the sieved fraction to 33·2 % in the water-extracted fraction(Reference Cavallero, Empilli and Brighenti66).
Despite evidence showing that the viscosity of soluble fibre can affect the glycaemic response to CHO foods, the effect of non-viscous, soluble fibre is unclear. Recently, Livesey & Tagami(Reference Livesey and Tagami67) conducted a systematic review of trials to gain an understanding of whether or not low-viscous soluble fibre, such as resistant maltodextrin, was effective in attenuating the glycaemic response to various foods and types of CHO. The findings indicated that the consumption of non-viscous fibre by healthy people attenuated the glycaemic response to CHO foods, with a dose–response effect at doses of 3–10 g/meal. A stronger attenuation effect was observed when the non-viscous fibre was consumed in a drink than in prepared foods, but it was also effective in a bread meal (>20 % attenuation in the glycaemic response with 10 g maltodextrin). Plausible mechanisms of attenuation include: slower rates of gastric emptying; the stimulation of hydrodynamic movements of digesta to distal sites of the intestine where absorption can be less rapid; digestive enzyme inhibition and enhancement of the insulin response(Reference Livesey and Tagami67). The addition of non-viscous fibre is interesting for several reasons. Non-viscous polysaccharides avoid the issues of poor palatability that are seen with viscous polysaccharides. Moreover, the range of foods in which non-viscous polysaccharides can be used is wider than that for viscous ones. The results for the glycaemic response appeared to be independent of the amounts of available CHO, protein and fat in the foods, and, finally, there was no strong indication that the results were dependent on the type of CHO (refined- or simple- rather than complex-starch foods). However, a weakness of the results was that the mechanism of the effect of resistant maltodextrin was far from understood.
Fibre from non-cereal sources
Another strategy for reducing postprandial glycaemia in response to bread is the addition of dietary fibre from legumes or legume flour, as legumes are classified as low-glycaemic index foods(4). Adding about 10 % of Detarium senegalense Gmelin (an African legume) flour to a bread meal was shown to reduce the glycaemic response by more than 60 % compared with a white bread(Reference Onyechi, Judd and Ellis68). The physiological activity of Detarium flour was attributed to its high contents of high-molecular-weight xyloglucan, a soluble viscous fibre. However, the regular consumption of lupin kernel flour-enriched bread did not significantly alter fasting glucose and insulin concentrations in a population of overweight men and women compared with a standard white bread(Reference Hodgson, Lee and Puddey69). This different result is most probably because the dietary fibre present in lupin kernel flour is primarily insoluble (about 70 %), whereas about 10 % is present as soluble fibre and a further 20 % as oligosaccharides(Reference Hodgson, Lee and Puddey69).
Among highly soluble viscous fibres that have been used for decreasing the glucose response to bread, guar gum, a galactomannan extracted from a legume cultivated in India and Pakistan, has also been successfully incorporated in bread. For instance, 5 g guar gum added to a bread meal reduced the peak increase of blood glucose by 41 % and about 6 % of guar added to the bread reduced serum insulin by 48 %(Reference Wolever, Jenkins and Nineham70, Reference Ellis, Apling and Leeds71). However, guar gum is most effective when added to the liquid phase of a meal because it is fully hydrated and highly viscous(Reference Jenkins, Wolever and Leeds51). Moreover, the use of guar gum in bread has some limitations, such as poor palatability and gastrointestinal side effects. In order to remedy these problems, Wolf et al. (Reference Wolf, Wolever and Lai72) developed a novel low-viscosity beverage with guar gum (5 %) that was served with white bread and became viscous in vivo through enzymatic induction. Upon ingestion, salivary amylase hydrolysed the maltodextrin of guar gum, which allowed the fibre to solubilise and form a viscous chyme. Thus, guar gum incorporated into an amylase-induced viscous product stabilised blood glucose levels by reducing the early-phase excursion. After ingestion, some volunteers reported a non-significant but higher intensity and frequency of cramping, distension or flatulence(Reference Wolf, Wolever and Lai72).
Another bread additive is psyllium, a highly soluble viscous fibre extracted from the plant genus Plantago. In a recent study, the addition of psyllium fibre (23 g/portion) to bread meals strongly decreased the postprandial plasma glucose and serum insulin responses compared with low-fibre meals (no psyllium), even if these products were almost always considered as unpleasant(Reference Karhunen, Juvonen and Flander73). Considering other sources of fibre, it was observed that the ingestion of growing doses of Salba (Salvia hispanica L.), baked into white bread, attenuates postprandial glycaemia in a dose-dependent manner in healthy subjects. Experimental meals contained 50 g of available CHO with addition of 0, 7, 15 or 24 g of Salba grains, and, on average, each gram of Salba reduced postprandial glycaemia by 2 % compared with the control(Reference Vuksan, Jenkins and Dias74).
Recently, Jenkins et al. (Reference Jenkins, Kacinik and Lyon75) evaluated the effectiveness of a novel viscous polysaccharide, commercially known as PGX (PolyGlycopleX: α-d-glucurono-α-d-manno-β-d-manno-β-d-gluco, α-l-glucurono-β-d-mannurono, β-d-gluco-β-d-mannanis), in reducing postprandial glycaemia. PGX is an oligomer technologically produced with increased viscosity and palatability. When added to white bread, PGX resulted highly effective in lowering GI in a dose-responsive manner. Experimental meals contained 50 g of available CHO with the addition of 0, 2·5, 5 or 7·5 g of PGX; the GI values were 66·8 (sem 3·0), 47·5 (sem 5·9), 37·3 (sem 5·9) and 33·9 (sem 3·6), respectively.
In order to improve the technical–functional and nutritional properties of bread, a multi-fibre strategy was used by Angioloni & Collar(Reference Angioloni and Collar76), who replaced 10 % of wheat flour with a fibre mix (locust bean gum and carboxymethylcellulose, singly and in combination with fructo- and gluco-oligosaccharides) in a bread formulation. The authors evaluated the effects of fibre replacement on bread technical–functional characteristics and on nutritional properties, including the expected GI. The in vitro hydrolysis index in relation to the expected GI was lower for carboxymethylcellulose/fructo-oligosaccharides than that observed for all of the other samples due to its large particle size and highly viscoelastic profile. This fibre mix resulted in highly sensory-acceptable breads with a greater amount of resistant starch (RS), a lower amount of digestible starch and a slightly lower level of protein digestibility(Reference Angioloni and Collar76).
The presence of resistant starch
RS is considered to have implications for colonic health and the improvement of glucose and lipid metabolism. In view of the quantitative importance of bread in our diet, bread can be expected to be the main source of RS introduced on a daily basis. In Italy, bread provides 2·6 g RS/d(Reference Brighenti, Casiraghi and Baggio77). However, the actual amount of RS in a bread product can vary because of variations in formulae and baking conditions. The type of RS that is usually found in bread is retrograded starch (RS3), but it is possible to find physically entrapped starch within whole or partly milled grains or seeds (RS1), and native, ungelatinised granules of B-type starch (RS2). The content of RS detected in bread made with milled flour (1–1·7 g/100 g starch) is too small to be significant for the glycaemic response(Reference Brighenti, Casiraghi and Baggio77). Moreover, there is a lack of consensus regarding the precise effect of RS on insulin and glucose responses: some studies reported an improvement in these measures following the consumption of a RS-rich test meal(Reference Granfeldt, Drews and Bjorck78–Reference Behall, Scholfield and Hallfrisch80), whereas others have showed no effect or a physiologically irrelevant effect(Reference Ranganathan, Champ and Pechard81–Reference Nestel, Cehun and Chronopoulos83). From these studies, it was concluded that RS must contribute at least 14 % of the total starch intake in order to confer any benefits to glycaemic or insulinaemic responses(Reference Nugent84).
The presence of whole or partly milled grains and seeds containing physically protected starch (i.e. RS1) seems to affect the glycaemic response. In fact, the glycaemic response to bread appears to be lower after the incorporation of whole or cracked rye or barley grains(Reference Granfeldt, Liljeberg and Drews85). Whole-grain bread, with a more intact structure, was shown to improve postprandial glycaemic and insulinaemic responses compared with whole-wheat bread made from milled flour(Reference Jenkins, Wesson and Wolever86). In bread made from 80 % barley kernels and 20 % white wheat flour, as much as 26 % RS (total starch basis) was found(Reference Liljeberg Elmståhl87). The addition of buckwheat (Fagopyrum esculentum) whole seeds to white wheat flour in bread products (30–70 %) increased the RS level (2·3–3·2 %) since all three types of RS were likely to be present(Reference Liljeberg Elmståhl87). Moreover, the consumption of bread based on wheat flour and 50 % buckwheat whole seeds was found to significantly induce lower postprandial blood glucose responses compared with white wheat bread (66 v. 100)(Reference Skrabanja, Liljeberg Elmstahl and Kreft88).
Regarding the influence of chemically modified RS (RS4 – chemically modified starches due to cross-bonding with chemical reagents) on insulin and glucose metabolism, the data are not clear. Raben et al. (Reference Raben, Andersen and Karberg89) investigated the effect of feeding a test meal containing native potato starch, 1–2 % acetylated potato starch or potato starch enriched with 2 % β-cyclodextrin on glucose response. The authors concluded that the β-cyclodextrin–enriched starch meal, which induced a lower initial glucose peak, may have been absorbed more distally or may have resulted in delayed gastric emptying(Reference Raben, Andersen and Karberg89).
Finally, the role of the amylose:amylopectin ratio on changes in gelatinisation and the plasma glucose responses of cereals has been demonstrated(Reference Behall, Scholfield and Hallfrisch80, Reference Fredriksson, Silverio and Andersson90–Reference Alminger and Eklund-Jonsson93). Meals containing high amounts of amylose maize flour produced lower areas under glucose and insulin response curves (57 and 42 %, respectively) than meals containing the common maize meal. Granfeldt et al. (Reference Granfeldt, Liljeberg and Drews85) concluded that high-amylose maize content products have the potential to promote favourably low metabolic responses and high RS contents. Conversely, a high proportion of amylopectin in bread, which is more accessible to α-amylase than amylose, had a predominant effect on postprandial glucose response, also counteracting the positive action of the presence of β-glucan. This emerged from a very recent study in which β-glucan-enriched flours from two naked genotypes of barley, the non-waxy Priora and the waxy Alamo genotypes, were added to breads(Reference Finocchiaro, Ferrari and Gianinetti94). The breads were made with 40 % of barley flour (Priora or Alamo) and 60 % of white wheat flour. Despite the two breads having similar β-glucan contents (about 6 %), only the Priora bread, with a common amylose:amylopectin ratio with respect to the presence of a higher proportion of amylopectin in the waxy barley Alamo, had a significant lower GI value (57 v. 70 of Alamo bread)(Reference Finocchiaro, Ferrari and Gianinetti94). Waxy barleys have an altered activity of a key enzyme of starch synthesis, which causes a shift towards amylopectin production to the detriment of amylose(Reference Wood, Weisz and Beer63).
The second-meal effect
Generally, high contents of indigestible CHO and soluble fibres in products such as bread not only beneficially affect the acute glycaemic response but they also benefit second meals through a mechanism related to colonic fermentation, called the second-meal effect. Evening meals with barley kernel-based breads (ordinary, high-amylose- or β-glucan-rich genotypes) reduced the glucose response (approximately 26 %) at the subsequent breakfast compared with white wheat bread(Reference Nilsson, Ostman and Holst95). Nilsson et al. (Reference Nilsson, Ostman and Holst95, Reference Nilsson, Ostman and Granfeldt96) suggested that colonic fermentation might contribute to an improved late glucose regulation, as metabolites produced during the colonic fermentation of indigestible CHO (i.e. SCFA) may enter the systemic circulation and exert positive effects, including benefits on glucose metabolism. However, based on a second study, Nilsson et al. (Reference Nilsson, Ostman and Granfeldt96) concluded that the benefits on glucose tolerance of a second meal cannot solely be explained by a low GI and/or the contents of dietary fibre included in the test meal. These findings agree with those of Brighenti et al. (Reference Brighenti, Benini and Del Rio97), who concluded that fermentable CHO, independent of their effect on food GI, have the potential to improve postprandial responses to a second meal by decreasing the competition for NEFA for glucose disposal and, to a minor extent, by affecting intestinal motility.
Sourdough fermentation
Another factor that is able to reduce the GI of leavened starchy foods is the addition of organic acids or sourdough fermentation. The direct addition of acetic, propionic and lactic acids during bread making was found to decrease postprandial blood glucose and insulin responses(Reference Liljeberg and Björck98). This effect was not attributed to a decreased gastric emptying rate(Reference Liljeberg and Björck98), but to interactions between starch and gluten that limited starch bioavailability(Reference Ostman, Nilsson and Liljeberg Elmstahl99). Moreover, the addition of organic acid or the use of sourdough fermentation increased the RS content; in particular, selected sourdough Lactobacillus plantarum and Lactobacillus brevis strains caused the highest increase of RS in breads(Reference De Angelis, Rizzello and Alfonsi100). De Angelis et al. (Reference De Angelis, Rizzello and Alfonsi100) measured the GI of sourdough bread enriched with oat fibre compared with a white wheat bread: the GI of sourdough bread (GI = 54) was significantly lower than that of white bread (GI = 75). They assumed that the lower GI in sourdough bread might have been due to both the fibre content and decreased pH. Conversely, in another study, the effectiveness of sourdough in reducing the glucose response to breads was reported compared with leavened bread with Saccharomyces cerevisiae (Reference Scazzina, Del Rio and Pellegrini48). Sourdough reduced the glucose response to both white wheat bread (approximately 23 %) and wholemeal wheat bread (approximately 36 %), whereas the presence of fibre did not affect the glucose response.
Conclusions
In the present review, the effectiveness of dietary fibre in modulating the glycaemic response to bread was evaluated. The studies presented were selected because they analysed in vivo whether or not dietary fibre, naturally present or added during bread making, could improve the glucose response. In addition, some in vitro studies were also included in default of interventional human studies. An overview of the human studies reported in the present review is summarised in Table 1, where, however, the studies presented are limited to those in which: (1) the GI or incremental AUC of test meals was compared with a control; (2) the quantity of dietary fibre added or naturally present in experimental breads was exactly reported.
Table 1 Human studies carried out with the addition of fibre for reducing the glycaemic index (GI) of bread

dw, Dry weight; IAUC, incremental AUC of glycaemic response (0–120 min); DF, dietary fibre; PGX, PolyGlycopleX (α-d-glucurono-α-d-manno-β-d-manno-β-d-gluco, α-l-glucurono-β-d-mannurono, β-d-gluco-β-d-mannanis); CHO, carbohydrate.
The first conclusion concerns dietary fibre naturally present in cereals used for bread making. Using wholemeal milled flour from wheat, irrespective of quantity, had no effect on glucose response both in acute and in chronic studies. Conversely, the presence of intact or cracked wheat kernel (50 %) and the use of sourdough fermentation, independently of white or wholemeal wheat flour, was effective in reducing the glucose response to bread. The presence of intact structures not accessible to human amylases, as well as a reduced pH that may delay gastric emptying or create a barrier to starch digestion, seems to be more effective than dietary fibre per se in improving glucose metabolism, irrespective of the type of cereal. It is probable that when plant cellular walls are finely cracked, fibre is not able to screen starch amylases, even though, for the same available starch content, starch is less concentrated.
The content of soluble fibre in naturally rich cereals, such as oats, barley and rye, is not sufficient to affect glucose metabolism. However, the partial addition of high-β-glucan cultivar flour (three to four times the β-glucan content compared with a common cultivar) in bread is able to reduce the glucose response. This effect is dependent on the increasing viscosity of dough, which considerably delays gastric emptying. Among barley cultivars, the waxy ones are more viscous than normal cultivars, probably because of high β-glucan contents; however, non-waxy cultivars with the same β-glucan contents as waxy cultivars seem to be more helpful in lowering the GI. Also, in this case, a starch structure less available to enzyme attack is a better strategy for delaying the glucose response. However, one should confirm whether the ability of viscous fibres to influence the viscosity of the chyme is maintained when a fibre-rich bread is consumed within a composite meal.
Aside from the choice of cereals or specific cultivars that are naturally rich in fibre and act upon the glycaemic response, or the treatments that can be used during bread making, another strategy for reducing the GI of bread is the incorporation of technologically extracted cereal fibre fractions and the addition of fractions from legumes or fibres specifically developed for this purpose. In general, these approaches are effective, even though to different degrees; the most successful was guar gum at about 5 % (50 % GI reduction). The effectiveness of these strategies is ascribable to the soluble components of the fractions. However, soluble non-digestible CHO do not always need to be viscous to lower the blood glucose concentration. The incorporation of non-viscous polysaccharides avoids issues of poor palatability that are seen with viscous polysaccharides. These fibres affect glucose metabolism, probably through the hydrodynamic movements of digesta to distal sites of the intestine where absorption can be less rapid. However, further studies are needed because other mechanisms could be involved.
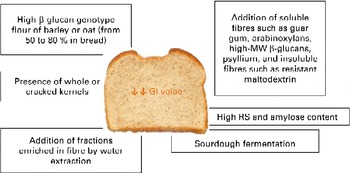
In the case of fibre addition, the challenge of future research could be to determine the optimal (range of) molecular structures (MW, monomeric ratios and binding types) related to gut viscosity, glucose and insulin responses, and colonic fermentation(Reference Gemen, de Vries and Slavin101). However, the form of food and its botanical structure, rather than the amount or type of fibre, might determine the physiological effects. Fig. 1 summarises the possible strategies discussed for reducing the GI of bread.

Fig. 1 Possible strategies to reduce the glycaemic index (GI) of bread. MW, molecular weight; RS, resistant starch. (A colour version of this figure can be found online at http://www.journals.cambridge.org/bjn).
Recent studies have suggested that whole foods offer more protection against chronic diseases than dietary fibre, antioxidants or other biologically active components in foods alone. This suggests that the addition of purified dietary fibre to foodstuffs is less likely to be beneficial compared with the inclusion of whole foods that are high in dietary fibre. Park et al. (Reference Park, Subar and Hollenbeck46) suggested that the benefit of dietary fibre is attributable to the antioxidant and anti-inflammatory properties of whole-grain components, which are correlated with cereal fibre. Whole grains have a high antioxidant potential and contain numerous minerals, such as Se and Zn, which are cofactors for antioxidant enzyme systems, and radical scavengers such as polyphenols. The concept of synergy among the components in whole foods seems particularly important when applied to foods such as bread.
In conclusion, substituting whole grains for refined grains would provide benefits not only from fibre but also from the other unique health-promoting components of whole grains, also resulting in a better strategy for reducing the GI of bread. However, when fibres or whole grains are included in bread making to affect the glycaemic response, the manufacturing protocol needs to reconsider several technological parameters in order to obtain high-quality and consumer-acceptable breads.
Acknowledgements
The present study received no specific grant from any funding agency in the public, commercial or not-for-profit sectors. The authors' responsibilities were as follows: F. S. and N. P. contributed to the conception of the literature search strategy and the design of the manuscript; F. S. wrote the manuscript; S. S.-E. undertook the literature search; N. P. and S. S.-E. critically appraised the document at all stages. None of the authors has any conflicts of interest.