


Dietary protein, comprised of amino acids, is an important modulator of glucose metabolism, insulin sensitivity, and, therefore, type 2 diabetes (T2D)( Reference Adeva, Calviño and Souto 1 ). Higher dietary protein intake has been associated with reduction in total energy intake and as a result may play a role in therapeutic care for individuals with obesity-related chronic disease, including T2D( Reference van Nielen, Feskens and Mensink 2 ). Contrary to this evidence, emerging data from epidemiological studies have suggested a positive association between higher protein and meat intake and incident T2D( Reference van Nielen, Feskens and Mensink 2 – Reference Wang, de Koning and Kanaya 7 ), despite protein’s role in enhancing satiety and diet-induced thermogenesis. The association of protein intake and risk of T2D has been studied in two large populations that included thousands of incident T2D cases over 8–12 years of follow-up( Reference Tinker, Sarto and Howard 6 , Reference Malik, Li and Tobias 8 ). In particular, in the Women’s Health Initiative (WHI)( Reference Tinker, Sarto and Howard 6 ) study, an approximately 20 % increase in protein intake (corresponding to approximately 12 g protein and 3·4 % energy from protein) was associated with a 5 % higher risk of T2D. In the Malmo Diet and Cancer cohort (n 27 140 over 12-year follow-up), participants in the highest quintiles of percentage of energy derived from total protein had 27 % (95 % CI 8, 49) higher risks of T2D compared with those in the lowest quintile( Reference Ericson, Sonestedt and Gullberg 3 ).
Of note, a pooled analysis from the Nurses’ Health Study, Nurses’ Health Study II and the Health Professionals Follow-up Study encompassing over four million person-years of follow-up and 15 580 cases of T2D suggested animal protein was associated with higher, whereas vegetable protein was associated with lower, risk of T2D( Reference Malik, Li and Tobias 8 ). These results suggest that protein source, in addition to quantity, may be related to the development of T2D. In fact, higher consumption of meat, particularly red meat, has been associated with a higher risk of T2D( Reference Pan, Sun and Bernstein 9 ). Overall, it is unclear whether it is the protein or other characteristics (i.e. nutrients, cooking methods) of protein-rich foods which explain the association with T2D.
One postulated explanation for the differential results is that higher animal protein intake may result in higher intake of branched-chain amino acids (BCAA). BCAA are essential amino acids that need to be obtained from diet, which can be found mostly in meat, chicken, fish, dairy products and eggs( Reference Katsanos, Kobayashi and Sheffield-Moore 10 ). BCAA (leucine, isoleucine and valine) have a critical role in promoting skeletal muscle mass as well as glucose uptake within the muscle( Reference van Nielen, Feskens and Mensink 2 , Reference Nagata, Nakamura and Wada 11 ). Circulating BCAA are positively associated with insulin resistance, as measured by homeostatic model assessment (HOMA) and HbA1C( Reference Batch, Shah and Newgard 12 – Reference Newgard, An and Bain 14 ). Recent data from the Nurses’ Health Studies (I and II) and the Health Professionals Follow-up Study suggest total and animal protein are associated with higher risk of T2D( Reference Malik, Li and Tobias 8 ). What is less clear is whether BCAA may be systemically elevated in response to an unfavourable and accelerated degradation to these important diet-derived compounds during a metabolically perturbed state rather than causal in insulin resistance development. The purpose of this analysis is to expand upon earlier findings in WHI relating protein intake to T2D risk by evaluating the associations of BCAA and meat intake and risk of T2D within the WHI, a large cohort of racially and ethnically diverse postmenopausal women, and the impact of jointly adjusting for BCAA and meat intake on the risk of T2D.
Methods
The Women’s Health Initiative study
The design and baseline descriptions of the WHI studies have been published( Reference Langer, White and Lewis 15 – 17 ). Data for the present study were selected from the WHI clinical trials (CT) (dietary modification, control arm (DM-C), hormone therapy and Ca/vitamin D), and WHI observational study (OS). In brief, 68 132 and 93 676 generally healthy postmenopausal women aged 50–79 years were enrolled in the CT or the OS at 40 clinical centres across the United States between 1993 and 1998.
Incident T2D during follow-up was documented by self-report at each semiannual contact when participants were asked by self-administered medical history update questionnaire, ‘Since the date given on the front of this form, has a doctor prescribed any of the following pills or treatments?’ Choices included ‘pills for diabetes’ and ‘insulin shots for diabetes.’ Data from a WHI T2D confirmation study showed that prevalent and incident T2D were consistent (self-reported treated diabetes was concordant with the medication inventory in 79 % of CT, and 77 % in the OS participants) with medication inventories of oral agents or insulin. Demographic and risk exposure data, as well as data regarding family and medical history, were obtained by self-report using standardised questionnaires. WHI-certified staff took physical measurements using standardised equipment, including blood pressure, height and weight and blood samples at the clinic visit( Reference Langer, White and Lewis 15 ).
Assessment of dietary intake
Dietary intake was estimated using the FFQ designed for the WHI that was administered to all participants at baseline( Reference Patterson, Kristal and Tinker 18 ). For participants in the dietary modification (DM) trial the baseline FFQ was used for screening eligibility in relation to fat intake and the intervention arm received support to change diet in a way that would alter meat and BCAA intake. As such, in DM women only the control arm year 1 FFQ was used in this analysis of nutrient intake. Nutrient intake including BCAA content was derived from the United States Department of Agriculture nutrient database( 19 ). To determine total BCAA intake we calculated the sum of isoleucine, leucine and valine consumption from the usual dietary intake.
Calibration of dietary protein intake
As previously described( Reference Tinker, Sarto and Howard 6 ), the WHI-Nutritional Biomarkers Study (WHI–NBS) sub-study developed biomarker-based calibration equations to reduce measurement error in self-reported intake of energy and protein by using linear regression models that predicted true intakes of energy and protein given the self-reported intake and data on study subject characteristics( Reference Tinker, Sarto and Howard 6 ).
Baseline (as described above) FFQ energy, BCAA, and BCAA density served as the uncalibrated baseline nutrient consumption estimates. For the calibrated energy and protein, logs of nutrient consumption were obtained directly from the biomarker measurements for the 276 DM-C women included in the WHI–NBS. For women not in the WHI–NBS, the WHI–NBS calibration equations were applied( Reference Tinker, Sarto and Howard 6 ). To estimate grams of calibrated BCAA, we multiplied the proportion of BCAA: total uncalibrated protein in grams by calibrated protein.
Analytic data set
We excluded from analysis participants with treated T2D, that is, those who reported T2D at enrolment (n 6447) or during the 1st year of follow-up for the DM-C (n 217) to correspond with the FFQ analysis time points. To align the participant characteristics of the DM-C and other participants for these analyses, we then applied the following DM trial exclusionary criteria to all participants in the analytic sample: breast or colorectal cancer ever (n 5566), other cancer (except non-melanoma skin cancer) within 10 years preceding enrolment (n 2667), stroke or acute myocardial infarction 6 months before enrolment (n 115), BMI <18 kg/m2 (n 774), hypertension (>200/>105 mmHg) (n 224), FFQ reported daily energy intake of <2510 kJ (<600 kcal) or >20 920 kJ (>5000 kcal)) (n 4706), ≥10 meals prepared away from home per week (n 4749), special low-fibre diet (n 568), special diet because of the malabsorption (n 510) and unintentional weight loss of >15 lb (6·8 kg) in the 6 months preceding baseline (n 486) (online Supplementary Fig. S1). Finally, 17 518 participants were excluded with missing model covariate data. After the above exclusion criteria were applied and the participants with complete data were selected, the analytic data set included 32 024 CT and 62 241 OS participants. The WHI and NBS protocol and consent forms were approved by the Institutional Review Board for each participating institution and the Clinical Coordinating Center (Fred Hutchinson Cancer Research Center).
Statistical analysis
We performed a secondary analysis using subsample of WHI CT and OS data. Demographic and health characteristics are reported by quintile of baseline total BCAA intake (sum of valine, leucine and isoleucine), as estimated from the FFQ. Accompanying P values for trend derived from either linear (continuous, ordinal demographics) or logistic (dichotomous) regression models with the demographic of interest as a function of linear trend over quintiles (quintile 1=1, quintile 2=2, etc.). Follow-up times started with the DM comparison at year 1 or the OS at year 3 and continued to the earliest of treated diabetes, death or loss to follow-up( Reference Tinker, Sarto and Howard 6 ).
For analysis, BCAA intake was characterised as absolute (g/d), relative to energy intake (% energy/d) and relative to protein intake (% protein/d). Using Cox proportional hazards models, the relationship between BCAA intake (modelled continuously for a 20 % increase and categorically by quintiles) and T2D is reported by hazard ratio (HR) and the corresponding 95 % CI. To be comparable with our prior analysis( Reference Tinker, Sarto and Howard 6 ), the final model was adjusted for age, race/ethnicity, BMI, education, income, history of CHD, current smoking, current alcohol use, physical activity, hypertension, family history of T2D, hormone use, glycaemic load, glycaemic index and total energy intake. Models were additionally stratified within the model by the hormone therapy arms and 5-year age groups. P values for trend across quintiles are computed from separate proportional hazards models with the outcome of interest as a function of linear trend over quintiles. Similarly, we assessed associations between meat intake and T2D, as categorised by My Pyramid Equivalents Database categories. In sensitivity analyses, we further adjusted BCAA intake for total meat intake and omitted adjusting for BMI.
Results
Higher BCAA intake was associated with younger age, white race, higher education and higher income per year, less likely to report current smoking, greater physical activity and lower history of CHD (Table 1). Yet, higher BCAA intake was also associated with higher BMI and alcohol use, and higher glycaemic load.
Table 1 Characteristics at time of protein measurement by quintile (Q) of uncalibrated total branched-chain amino acid (BCAA) intake (g/d)Footnote * (Numbers and percentages; mean values and standard deviations; geometric means and standard deviations, with trend tested over log transformed data)

GED, General Education Degree; METs, metabolic equivalents.
* Baseline (or year 1 for dietary modification trial participants).
† P value for trend from a linear (continuous and ordinal characteristics) or logistic (dichotomous characteristics) regression model with the characteristic of interest as a function of linear trend over the medians of each BCAA quintile.
‡ P value for trend is based on trend of BCAA quintiles on white ethnicity (yes/no).
Geometric mean uncalibrated BCAA intake in our study was 10·9 g/d comprised of leucine (4·9 g/ d), isoleucine (2·8 g/ d) and valine (3·2 g/ d) (online Supplementary Table S1). Major reported meat sources of BCAA were red meat (1·2 g/d) and poultry (0·78 g/d) in our study population (online Supplementary Table S1). The online Supplementary Table S2 shows the quintile and median values for uncalibrated and calibrated BCAA variables, and the quintile and median values of major reported food sources for meat intake are presented in the online Supplementary Table S3.
A 20 % increment in total BCAA intake (g/d and %energy) was associated with a 7 % higher risk for T2D (HR 1·07; 95 % CI 1·05, 1·09) (Table 2). Similarly, a 20 % increment in intake (g/d and %energy) for each of the BCAA, including leucine, isoleucine and valine was associated with 7 % higher risk of T2D with similar HR 1·07; 95 % CI 1·05, 1·09. Inferences were similar when characterising total BCAA intake as percentage of protein intake, although isoleucine was more strongly associated with T2D risk than leucine or valine (Table 2). For uncalibrated protein, model estimates were similar with and without adjustment for BMI (online Supplementary Tables S1 and S4), whereas with calibrated protein the strength of the association was slightly higher with adjustment for BMI (online Supplementary Tables S5 and S6). Biomarker calibration of energy and protein did not appreciably affect the results (online Supplementary Table S5).
Table 2 Risk of diabetes by quintile (Q) of uncalibrated branched-chain amino acid (BCAA) intake (Hazard ratios (HR) and 95 % confidence intervals)
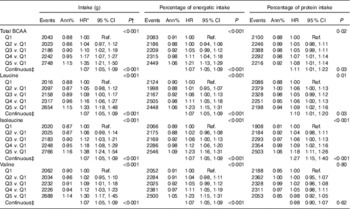
Ref., referent values.
* HR and CI from proportional hazards models with incident diabetes as a function of the protein variable of interest adjusted for age, ethnicity, BMI, education, income, history of CHD, current smoking, current alcohol use, physical activity, hypertension, family history of diabetes, hormone use, glycaemic load, glycaemic index and total energy intake. Models are additionally stratified within the model for Women’s Health Initiative intervention arms and 5-year age groups
† P values for categorical protein variables are from a separate model looking at linear trend over the medians of each quintile.
‡ HR, CI and P values in the continuous models for a 20 % increase of the protein value of interest.
Likewise, in categorical analyses (Table 2), women reporting intake in the highest quintile of uncalibrated BCAA (g/d) had a 35 % greater risk of T2D (HR 1·35; 95 % CI 1·21, 1·50) compared with those in the lowest quintile of intake. When the highest quintiles of uncalibrated protein expressed as %energy/d (HR 1·21; 95 % CI 1·13, 1·29) or as a percentage of total protein intake (HR 1·08; 95 % CI 1·01, 1·14) were compared with the lowest quintiles, the strength of the association was attenuated, but remained significant (Table 2).
For total meat intake, a 20 % increment increase was associated with a 4 % higher risk of T2D (HR 1·04; 95 % CI: 1·03, 1·05) (Table 3). Risk varied little across animal protein sources, although it was lower in relation to fish and poultry intake compared with red meat. A 20 % increment increase in intake of red meat, fish, poultry and processed meat was associated with 3, 2, 1 and 3 % higher risk of T2D, respectively (Table 3). In models jointly adjusted for BCAA and total meat intake (online Supplementary Table S7), associations between BCAA intake and T2D retained significance and estimates did not substantively differ from models that did not include total meat intake (Table 2).
Table 3 Risk of diabetes by quintile (Q) of meat intake by My Pyramid Equivalents Database categories (adjusted for BMI) (Hazard ratios (HR) and 95 % confidence intervals)
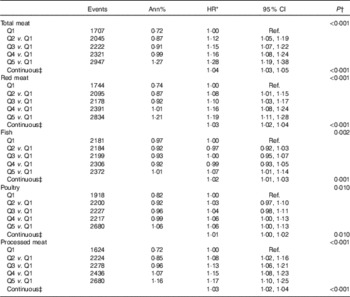
Ref., referent values.
* HR CI from proportional hazards models with incident diabetes as a function of the food group of interest adjusted for age, ethnicity, education, income, history of CHD, current smoking, current alcohol use, physical activity, hypertension, family history of diabetes, hormone use, glycaemic load, glycaemic index, total energy intake and BMI. Models are additionally stratified within the model for Women’s Health Initiative hormone therapy arms and 5-year age groups.
† P values for categorical food group variables are from a separate model looking at linear trend over the medians of each quintile.
‡ HR, CI and P values in the continuous models for a 20 % increase of the food group value of interest.
Discussion
This study demonstrated that higher BCAA intake, with and without biomarker calibration of protein exposure estimates, was associated with higher risk of T2D in the WHI OS and CT population. Our results suggest that increased intake of dietary BCAA may contribute to the risk of future T2D in postmenopausal women. In addition to the prospective association with risk of T2D, our findings showed that total meat intake was associated with increased risk of T2D in postmenopausal women. The association of meat intake with T2D risk was attenuated in models jointly adjusted for BCAA intake, but remained significant. These relations did not materially change with or without adjustment for BMI.
Absolute intakes of total BCAA in WHI women were similar to those of previous US cohorts (medians across quintiles 1 through 5 were 10·1–15·1 g/d in the Nurses’ Health Study I, 12·0–18·0 g/d in the Nurses’ Health Study II and 12·6–18·8 g/d for in the Health Professionals Follow-up Study, approximately 12·6)( Reference Zheng, Li and Qi 20 ). To provide perspective on how these ranges relate to dietary intake, four ounces of ground beef contain 4·0 g BCAA and four chicken tenders contain 1·8 g BCAA.
Studies that have examined the association of dietary BCAA consumption with T2D are scarce. Our results corroborate those of the recent study by Zheng et al.( Reference Zheng, Li and Qi 20 ) which included three large, prospective cohorts of US men and women, and reported that long-term consumption of BCAA, individually or in sum, was associated with increased risk of incident T2D. These associations were independent of traditional diabetes risk factors, including BMI.
However, in a Japanese cohort (n 13 525), BCAA as a proportion of total protein (17·23 and 17·32 % in men and women, respectively) were inversely associated with T2D in women (HR 0·57; 95 % CI 0·36, 0·90 comparing 3rd to 1st tertile), but were not significantly associated with T2D in men( Reference Nagata, Nakamura and Wada 11 ). This could be because of the population age (35 years and older) compared with WHI (50–79 years) (i.e. premenopausal v. postmenopausal women), the top two sources of BCAA in this population were cereals/potatoes and starches and fish/shellfish, and the sensitivity and specificity of the T2D ascertainment by self-report compared with HbA1c was 57·4 and 96·5 %, respectively( Reference van Nielen, Feskens and Mensink 2 , Reference Nagata, Nakamura and Wada 11 ).
Some studies of plasma BCAA levels have found associations with insulin resistance, which may explain the adverse associations of BCAA intake with development of T2D( Reference Wurtz, Soininen and Kangas 21 , Reference Wang, Larson and Vasan 22 ). It has been shown that circulating BCAA and aromatic amino acid levels predict insulin resistance index over 6 years in normoglycaemic young adult individuals even when accounting for baseline insulin resistance( Reference Wurtz, Soininen and Kangas 21 ). In the Framingham Offspring Study, higher plasma BCAA levels were correlated positively with fasting insulin levels and predicted the future risk of T2D, a finding which was more pronounced in obese individuals( Reference Wang, Larson and Vasan 22 ). The positive association of plasma BCAA and insulin resistance has also been found in studies across different settings( Reference Huffman, Shah and Stevens 13 , Reference Newgard 23 ). A review by Newgard( Reference Newgard 23 ) concluded that BCAA and related metabolites are positively associated with insulin resistance and T2D. In a metabolomics study, plasma samples from obese and insulin-resistant v. lean and insulin sensitive subjects were analysed( Reference Newgard, An and Bain 14 ), showing from principal components analysis that most of the variance in the data were explained by BCAA, which had the strongest association with insulin sensitivity, even more than the lipid profiles.
Several mechanisms may explain the relationship between BCAA and T2D. Amino acids are thought to play a significant role in the pathogenesis of insulin resistance, acting as gluconeogenic precursors and stimulating hexosamine biosynthesis( Reference Wang, Larson and Vasan 22 ). Moreover, amino acid signalling is integrated by the mammalian target of rapamycin, a nutrient sensor that operates a negative feedback loop towards insulin receptor substrate 1 signalling, promoting insulin resistance for glucose metabolism( Reference Tremblay, Lavigne and Jacques 24 ). Glucose utilisation may also be impaired because of the inhibitory effect of amino acids on glucose transport and phosphorylation( Reference Tremblay, Lavigne and Jacques 24 ). Furthermore, amino acids affect glucose metabolism via stimulation of insulin and glucagon secretion and by serving as substrates for gluconeogenesis( Reference Sluijs, Beulens and van der 5 ). Infusion of amino acids to raise plasma amino acid concentrations induced insulin resistance in skeletal muscle and stimulated endogenous glucose production in healthy men( Reference Krebs, Krssak and Bernroider 25 ).
We also observed that higher meat intake increased the risk of T2D by 4 % in postmenopausal women, which is supported by a meta-analysis by Feskens et al.( Reference Feskens, Sluik and van Woudenbergh 4 ). The increased risk of T2D associated with higher meat consumption might be explained in part by meat’s contribution to BCAA and/or possibly increasing the haem Fe load. The BCAA and tyrosine and phenylalanine are mainly present in meat and dairy, although available in many protein-rich foods( Reference Aregbesola, Virtanen and Voutilainen 26 ). For this analysis, we focused on meat, rather than dairy, sources of BCAA’s, as we were interested in whether factors other than BCAA’s explained the observed positive association between BCAA with diabetes risk, and dairy products have a weakly protective association with T2D. The earlier experimental elevations of plasma amino acids by infusion, resulted in impaired insulin-stimulated glucose disposal and insulin-mediated suppression of (hepatic) glucose production( Reference Jiang, Ma and Ascherio 27 ). However, per 100 g of total meat, relative risk of T2D increased 15 % for (unprocessed) red meat, 13 % for poultry and 4 % for processed meat. Furthermore, higher meat intakes may contribute to increased haem Fe load, and Fe overload is associated with increased T2D risk( Reference Aregbesola, Virtanen and Voutilainen 26 ).
The current study has important strengths including its prospective design, large sample size, and long follow-up. Although T2D status, both treated and incident, was assessed by self-report without adjudication or confirmation by clinical measures, the WHI self-report data for T2D have been found to be highly consistent with medication use inventories provided by participants( Reference Margolis, Lihong and Brzyski 28 ). It is not known whether circulating BCAA are causes/mediators of insulin resistance or by-products of the associated metabolic dysfunction. Thus, the present study explored the relation of dietary intake of BCAA with T2D, but cannot inform on causality.
Some limitations of the study need to be addressed. Although the strength of the associations were not large in this study, they are worth noting given the high prevalence of diabetes worldwide. Diabetes was assessed using self-report, which could result in misclassification error. However, a validation study in the WHI demonstrated high concordance between self-reported treated diabetes and medication inventories( Reference Margolis, Lihong and Brzyski 28 ). Although we controlled for several covariates, measurement error in these constructs may result in residual confounding; women with higher BCAA intake had higher meat and alcohol intake, were more educated, had higher income, and higher glycaemic load. The role of other BCAA sources, such as dairy products, will be considered in work examining the role of dietary protein sources on diabetes risk within WHI. The response to dietary protein content may be dependent on an individual’s degree of underlying insulin resistance, determined by adiposity and BMI, but in our investigation adjusting for BMI did not materially changed the associations. Calibration using urinary N as a biomarker of total protein intake was incorporated into the analysis and did not materially change effect estimates in this analysis, but we did not have corresponding biomarkers of BCAA intake or meat intake. The nutrient database relied on estimation for 26–50 % of dietary amino acids, for example, similar foods or imputation. The BCAA from meat were not able to be separated from total BCAA. Because of the observational design, conclusions regarding causality cannot be drawn. Also, this study included postmenopausal women aged 50−79 years old from forty designated clinical sites across, but not representative of, the USA and therefore caution should be taken while generalising these results to other populations. Our findings indicated that higher BCAA and meat intakes were associated with higher risk of T2D. Thus, it may be important to further consider dietary protein sources in dietary recommendations to prevent T2D.
Conclusion
In a secondary analysis among a large cohort of postmenopausal women, BCAA and meat intake were associated with higher risk for T2D. The elevation in risk was very modest, but helps to inform future guidance for postmenopausal women at elevated risk for T2D.
Acknowledgements
The WHI programme is funded by the National Heart, Lung, and Blood Institute, National Institutes of Health, US Department of Health and Human Services through contracts N01WH22110, 24152, 32100-2, 32105-6, 32108-9, 32111-13, 32115, 32118-32119, 32122, 42107-26, 42129-32 and 44221 and is registered with Clinicaltrials.gov (record no. NCT00000611). This manuscript was prepared in collaboration with investigators of the WHI, and has been reviewed and/or approved by the WHI. The short list of WHI investigators can be found at https://cleo.whi.org/researchers/SitePages/Write%20a%20Paper.aspx. Dr J. M. B. was supported by career development award R00AG035002 sponsored by the National Institute of Aging. Dr L. S. P. is supported in part by FDA award RO1FD003527, Veterans Health Administration (VA) awards HSR&D IIR 07-138 and I01-CX001025, NIH awards R21DK099716, DK066204, U01 DK091958, U01 DK098246 and a Cystic Fibrosis Foundation award PHILLI12A0. The sponsors had no role in the design and conduct of the study; collection, management, analysis and interpretation of the data; and preparation, review or approval of the manuscript.
The authors’ responsibilities were as follows: A. Z. L., C. A. T., L. T., R. L. P. and J. M. B. designed the research; A. Z. L., C. A. T., L. T., R. L. P. and J. M. B. conducted the research; J. C. L. analysed the data; M. I., A. Z. L., C. A. T., L. T., Q. Q., L. Q., R. M. C.-D., L. S. P., R. L. P. and J. M. B. wrote the manuscript; and M. I. and J. M. B. had primary responsibility for the final content.
L. S. P. declares that there is no duality of interest associated with this manuscript. With regard to potential conflicts of interest, within the past several years, L. S. P. has served on Scientific Advisory Boards for Boehringer Ingelheim, Janssen and the Profil Institute for Clinical Research, and has or had research support from Merck, Amylin, Eli Lilly, Novo Nordisk, Sanofi, PhaseBio, Roche, Abbvie, Vascular Pharmaceuticals, Janssen, Glaxo SmithKline and the Cystic Fibrosis Foundation. In the past, he was a speaker for Novartis and Merck, but not for the last 5 years. This work is not intended to reflect the official opinion of the VA or the US Government; TBD for others. M. I., A. Z. L., C. A. T., L. T., J. C. L., Q. Q., L. Q., R. M. C.-D., R. L. P. and J. M. B. had no potential conflicts of interest to declare.
Supplementary Material
For supplementary material/s referred to in this article, please visit https://doi.org/10.1017/S0007114517001568


