


Polycystic ovary syndrome (PCOS) is widely considered as one of the most common causes of infertility in women affecting about 10 % of the women in the reproductive age( Reference Wojciechowski, Lipowska and Rys 1 , Reference Hart, Hickey and Franks 2 ). It also has serious economic consequences( Reference Azziz, Marin and Hoq 3 ). On the other hand, the aetiology of PCOS has a multi-faceted nature( Reference Cekmez, Cekmez and Pirgon 4 ). Some complications related to PCOS include ovarian enlargement, hyperandrogenism, acne and hirsutism, along with a number of metabolic complications such as β-cell dysfunction, glucose metabolism disturbance and elevated C-reactive protein (CRP), as an inflammatory marker( Reference Franks 5 – Reference Farrell and Antoni 7 ). The patients suffering from PCOS are exposed to risks in the long term, including type 2 diabetes mellitus, CVD, endometrial cancer and dyslipidaemia( Reference Svendsen, Christiansen and Hedley 6 ).
The relationship between insulin resistance and disturbed adipokines secretion has already been confirmed in obese people( Reference Tersigni, Di Nicuolo and D’ippolito 8 , Reference Villa and Pratley 9 ). Thus, insulin resistance can be viewed as one of the mutual links between adipokines and the pathogenesis of PCOS( Reference Olszanecka-Glinianowicz, Madej and Nylec 10 ). As a bioactive peptide is originally identified from bovine stomach extracts and apelin is the endogenous ligand of the G protein-coupled receptor (APJ)( Reference Tatemoto, Hosoya and Habata 11 – Reference Geurts, Neyrinck and Delzenne 13 ). In humans and animals with obesity and insulin resistance, adipose apelin expression and circulating apelin concentrations are elevated( Reference Geurts, Neyrinck and Delzenne 13 , Reference Ma, Yu and Wei 14 ). It has been already established that insulin causes the secretion of apelin, whereas apelin inhibits insulin secretion( Reference Xu, Tsao and Yue 15 ). In the past few years, a number of researchers have suggested that inflammation may have a role in apelin production as well as the modulation of its receptor expression( Reference Geurts, Neyrinck and Delzenne 13 ). With all the information above in mind, it can be mentioned that apelin may contribute to PCOS pathogenesis( Reference Geurts, Neyrinck and Delzenne 13 ).
Probiotics are live micro-organisms. These are synergistic with intestinal microbiota. They may have influence on metabolic and inflammatory conditions. Dairy products including yogurts, fermented foods and some cheeses are known as valuable resources of probiotic cultures in the diet. However, the gut microbiome alteration and biological effects of each source are ambiguous. Available probiotic supplements are influenced by initial dose strain, quality, temperature and anaerobic storage conditions( Reference Tremellen and Pearce 16 ). Previous investigations have indicated the beneficial role of probiotics in various diseases such as gastrointestinal diseases, infections, diabetes and atopic diseases( Reference Ma, Yu and Wei 14 ). The word ‘synbiotic’ refers to nutritional supplements combining probiotics and prebiotics in a synergistic form( Reference Mizock 17 ). Food supplements containing prebiotics, probiotics or synbiotics have attracted special interest by consumers, because they have a health benefit beyond basic nutrition. There is ample evidence to verify the involvement of intestinal microbiota in insulin resistance, obesity and low-grade inflammation, which are associated with PCOS( Reference Tremellen and Pearce 16 , Reference Kolida and Gibson 18 , Reference Roberfroid, Gibson and Hoyles 19 ). Therefore, it can be argued that synbiotic supplementation may potentially reduce the consequences of PCOS. The assumption here was that, besides some lifestyle changes such as exercise and diet, manipulating enteric flora through synbiotics consumption can be considered a novel adjunctive therapeutic strategy in PCOS patients( Reference Tremellen and Pearce 16 ). In order to examine this hypothesis, a double-blind randomised placebo controlled clinical trial was designed to investigate the effects of synbiotic supplementation on metabolic parameters and apelin in women with PCOS.
Methods
Study design
The present study was a double-blind placebo-controlled trial. The subjects were recruited from Arash Women’s Hospital, Tehran, Iran, between September 2015 and July 2016. Women with PCOS aged between 19 and 37 years and BMI≥25 kg/m2 were included in the study.
The exclusion criteria included age below 19 years and more than 37 years; BMI<25 kg/m2; and a history of chronic heart, kidney, liver, lung or pancreatic disease, CVD, thyroid disorder, autoimmune diseases, allergy to probiotic capsules or placebo, current or previous (within the last 3 months) use of antibiotics or multivitamin mineral supplements, and certain diet or physical activity programs. Informed consent was obtained from all patients after a full review of the inclusion and exclusion criteria and an explanation of the risks and benefits of the study. PCOS patients aged over 37 years and those who were of normal weight were excluded, because the prevalence of insulin resistance and inflammatory factors are more common in obese and overweight PCOS patients. Also the main goal of the study was to investigate the effect of synbiotics on insulin resistance indexes in obese and overweight PCOS patients. On the other hand, age is a major confounding factor for the effect of synbiotics on insulin resistance indexes. Therefore, we decided that women of reproductive age entered into the study. The study was approved by the Ethics Committee of Tehran University of Medical Sciences (IR.TUMS.REC.1394.8.9). The study was registered in the Iranian Registry of Clinical Trials (www.irct.ir) (registration code: IRCT2014110515536N2).
Subjects and study procedures
A diagnosis of PCOS was made according to the 2003 Rotterdam criteria and patients with two of the following were considered to have PCOS: oligo-ovulation and/or an ovulation, clinical and biochemical hyperandrogenism and polycystic ovaries on ultrasonography. Diagnosis of disease was done by study’s gynaecologist. We selected new cases during the study period. One investigator was responsible for enrolling the participants and supervising the study. The participants were randomly assigned to receive either active treatment with synbiotics or placebo using a randomised block design. The block size was six. Allocation concealment was maintained by having procedure indicator cards inside a set of numbered opaque sealed envelopes. Our statistician, who was not involved in the selection and allocation of the patients, prepared, coded and sealed the opaque envelopes. Subjects, investigators and the staff were blind to the treatment assignment until the end of the study. The patients were given 6-week supplement capsules. In the next follow-up visit (end of 6 weeks), the patients were given another set of capsules. All patients were undergoing the measurements of weight, height and waist and hip circumference. Body weight was assessed with minimal clothing and without shoes by a standard scale (Seca) to the nearest 0·1 kg. Height was measured by a wall-mounted stadiometer to the nearest 0·5 cm. Each individual’s BMI was calculated by using the following formula: BMI=weight (kg)/height (m)2. For the assessment of nutrient intake, the patients received food records at weeks 0 and 12, and were instructed to record their daily dietary intake for 3 d, including a weekend day. Dietary intakes were then analysed using the Nutritionist-4 software (First Databank Inc.).
Intervention
Each synbiotic capsule (500 mg; Zist-Takhmir Co.) contained seven strains of beneficial bacteria (Lactobacillus acidophilus 3×10¹⁰ colony-forming units (CFU)/g, Lactobacillus casei 3×10⁹ CFU/g, Lactobacillus bulgaricus 5×10⁸ CFU/g, Lactobacillus rhamnosus 7×10⁹ CFU/g, Bifidobacterium longum 1×10⁹ CFU/g, Bifidobacterium breve 2×10¹⁰ CFU/g and Streptococcus thermophilus 3×10⁸ CFU/g), prebiotic inulin (fructo-oligosaccharide), and capsules containing starch and maltodextrin, but no bacteria were used as placebo. On the basis of a previous study( Reference Shoaei, Heidari-Beni and Tehrani 22 ), a dose of 500 mg was used and no significant effects were observed. On the other hand, probiotics are generally regarded as safe and their side effects in ambulatory care have almost not been reported; therefore, according to an expert pharmacist, a dose of 1000 mg was chosen.
Collection and preparation of samples
All patients underwent biochemical testing at weeks 0 and 12 after a 12-h fast. All biochemical assessments were performed in the same laboratory using standard laboratory methods.
Experimental techniques
Fasting blood sugar (FBS) and plasma glucose fasting 2-h (PGF-2h) (75 g) were measured using the enzymatic colorimetric assay (Pars Azmoon). HbA1c and high-sensitivity CRP (hs-CRP) were measured by immunoturbidimetry (Pars Azmoon). Serum levels of apelin 36 were measured by ELISA using commercial kits such as Human Apelin ELISA kit (Cat No. E2014Hu; Shanghai Crystal Day Biotech Co., Ltd.). Homoeostatic model assessment-insulin resistance (HOMA-IR) was used to determine the level of insulin resistance using the following formula: HOMA-IR=(fasting insulin (mIU/l)×fasting blood glucose (mg/dl))/405 (or (fasting insulin (mIU/l) × fasting blood glucose (mmol/l))/22·5). Quantitative insulin sensitivity check index (QUICKI) was used to determine the degree of insulin sensitivity using the following formula: 1/(log fasting glucose+log fasting insulin).
Outcome parameters and power calculation (sample size)
To have a power of 80 % to detect 1-unit difference in the mean HOMA-IR between two groups as significant (at the two-sided 5 % level) with an assumed sd of 1·6, forty-two subjects were required in each group. We included forty-four participants to cover possible cases of withdrawal. The presumed standard deviation was obtained from the study by Lindsay et al.( Reference Lindsay, Kennelly and Culliton 20 ). Compliance to supplements was monitored by: (1) calling participants and sending short message sending, and (2) bring the used medication containers.
Statistical methods
All statistical analyses were performed by the SPSS software (Release 2016, IBM SPSS Statistics for Windows version 24.0; IBM Corp.). We used the t test and χ 2 test to compare the groups at baseline, and a general linear model to compare the groups after the intervention, with adjustment for possible confounders and baseline values. The included variables were baseline value of dependent variable, pre PGF-2-h, treatment type, BMI and maternal age. To ensure a normal distribution of variables, histogram and Kolmogorov–Smirnov tests were applied. The magnitude of the effect is presented as mean difference and 95 % CI. P values <0·05 were considered significant.
Results
During 11 months from September 2015 to July 2016, a total of 120 women were screened and ninety-nine women who met the inclusion criteria were enrolled and randomly assigned to one of two treatment groups. Overall, eleven (11·11 %) women (6 (12 %) in the intervention group and five (10·2 %) in the placebo group) withdrew before completing the trial and were lost to follow-up. The reasons for not completing the trial were non-compliance to the allocated intervention (n 3), no drug intake (n 2), unwillingness to continue (n 5) and pregnancy (n 1). Finally, eighty-eight subjects (synbiotics (n 44), placebo (n 44)) completed the study. Fig. 1 shows the enrolment, allocation and follow-up of the women who participated in the trial.
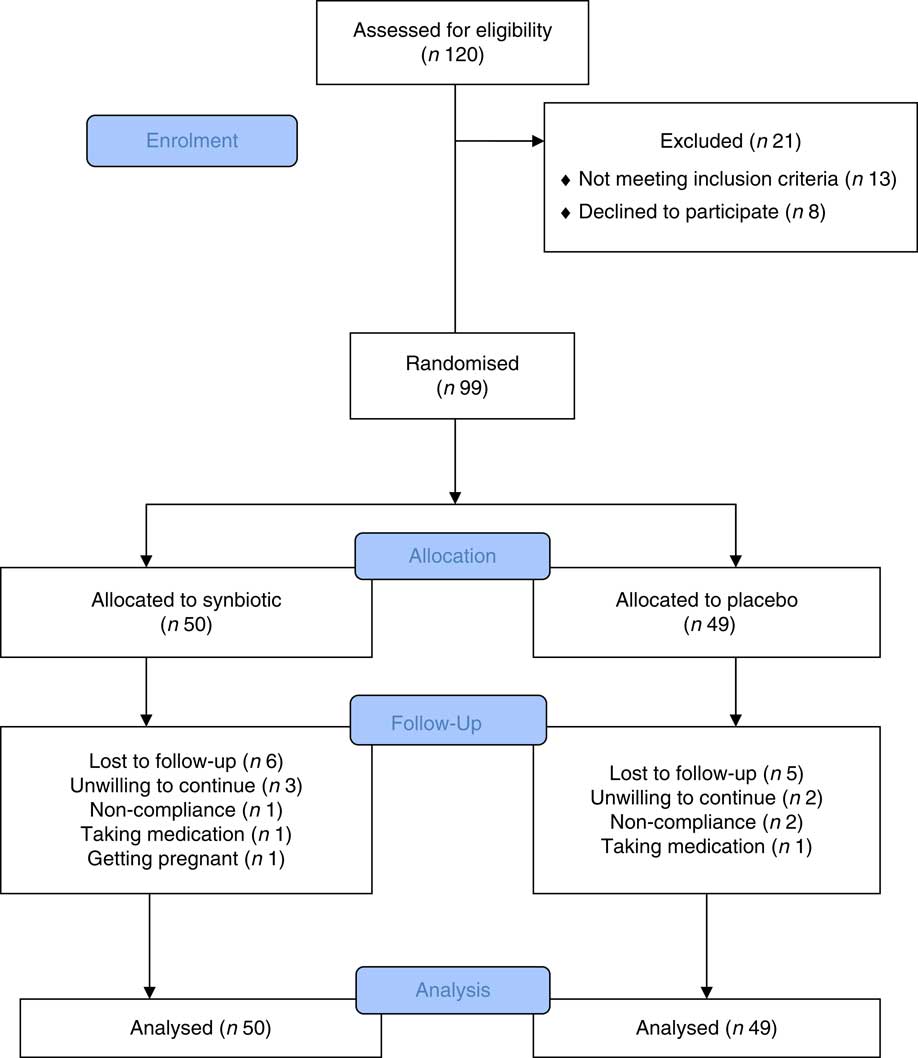
Fig. 1 Flow chart showing participants’ recruitment. Non-compliance of the allocated intervention (n 3), taking medication (n 2), unwilling to continue (n 5) and getting pregnant (n 1). The analysis was intention-to-treat approach.
An intention-to-treat approach was adopted for data analysis. Whereas the dropout rates were approximately 10 %, missing values were replaced by the mean of the other group( Reference Unnebrink and Windeler 21 ). Baseline and clinical characteristics were similar between the two groups with regards to the maternal age, marital status, BMI, menstruation and a family history of diabetes and patients’ infertility (Table 1).The women’s nutritional intakes (average energy, macronutrients and fibre intake) were similar before and after treatment between two groups (Table 2).
Table 1 Patients’ characteristic after random assignment (Numbers and percentages; mean values and standard deviations; medians and ranges)
* Based on t test.
† Based on χ 2 test.
Table 2 Dietary intakes of study participants throughout the study (Mean values and standard deviations; mean differences and 95 % confidence intervals)
TE, total energy.
* Intervention minus control group.
At baseline, the mean PGF-2h of women in the treatment group was 115 (sd 31) which was significantly higher than the mean PGF-2h of women in the placebo group – 102 (sd 25), (P=0·035) (Table 1). There were no significant differences between the groups at baseline in any of other indices of insulin resistance (Table 1). The two groups showed no difference in FBS (adjusted mean difference: 0·60; 95 % CI −3·80, 5·00, P=0·727), PGF-2h (adjusted mean difference: 2·09; 95 % CI −9·96, 14·15, P=0·134), HbA1c (adjusted mean difference: 0·06; 95 % CI −0·09, 0·22, P=0·959), HOMA-IR (adjusted mean difference: 0·02; 95 % CI −0·99, 1·03, P=0·837), QUICKI (adjusted mean difference: −0·02; 95 % CI −0·33, 0·29, P=0·940) and CRP (adjusted mean difference: 0·24; 95 % CI −1·61, 2·08, P=0·141), by the end of the intervention. Crude means and the mean difference between the two groups are summarised in Table 3. Apelin 36 concentrations decreased significantly in the synbiotic group, from 27 (sd 21) nmol/l at baseline to 14·4 (sd 4·5) nmol/l after 3 months, compared with non-significant increase in the placebo group between baseline at 26 (sd 15) nmol/l and 3 months at 18·4 (sd 2·9) nmol/l.
Table 3 Metabolic profile before and after the intervention (Mean values and standard deviations; mean differences and 95 % confidence intervals)
HOMA-IR, homoeostatic model assessment-insulin resistance; QUICKI, quantitative insulin sensitivity check index.
* Intervention minus control group.
† Based on t test.
‡ Based on ANCOVA (the included variables were: baseline value of dependent variable, treatment type, BMI, pre plasma glucose fasting 2-h and maternal age).
§ To convert from mg/dl to mmol/l, multiply by 0·0555.
Discussion
The aim of this clinical trial was to investigate the effects of synbiotic supplementation on metabolic parameters and apelin in women with PCOS aged 19–37 years and BMI≥25 kg/m2.
The results of the present study indicated that synbiotic supplementation for 12 weeks in PCOS patients did not have any significant effects on the serum levels of glucose and insulin in the fasting state. It also had no significant impact on HbA1c, PGF2h, the indexes of insulin resistance and sensitivity as well as hs-CRP. However, it caused a significant reduction in the serum level of apelin 36. To the best of our knowledge, this study was the first to examine the effect of synbiotic supplementation on the indexes of blood sugar, hs-CRP and apelin 36 in overweight and obese PCOS women.
The only clinical study in this field was conducted by Shoaei et al. ( Reference Shoaei, Heidari-Beni and Tehrani 22 ) in which the effect of probiotic supplementation on pancreatic β-cell function and hs-CRP was assessed in seventy-two PCOS women aged 15–40 years. In this double-blind study, probiotic supplement (500 mg capsule/d) was used for 8 weeks. The bacterial strains used in this study were similar to our study. The results were in line with the findings of our study and showed that probiotic supplementation as compared with placebo did not affect FBS (P=0·7), serum insulin levels (P=0·09) and HOMA-IR (P=0·14). Serum insulin levels after adjustment with covariates reduced significantly in the probiotic group (P=0·02)( Reference Shoaei, Heidari-Beni and Tehrani 22 ).
In recent years, a few human studies have confirmed the effects of probiotic supplementation on the indexes of blood sugar. In a study carried out by Asemi et al. ( Reference Asemi, Zare and Shakeri 23 ), consumption of multispecies probiotic supplements in patients with type 2 diabetes prevented an increase in FBS (P=0·01) in the probiotic group. In addition, it resulted in a significant increase in HOMA-IR in the probiotic and placebo groups. This randomised double-blind placebo-controlled clinical trial was performed on fifty-four diabetic patients aged 35–70 years. Subjects were randomly assigned to take either a multispecies probiotic supplement (n 27) or placebo (n 27) for 8 weeks. The multispecies probiotic supplement consisted of seven viable and freeze-dried strains, including L. acidophilus (2×10⁹ CFU), L. casei (7×10⁹ CFU), L. rhamnosus (1·5×109 CFU), L. bulgaricus (2×10⁸ CFU), B. breve (2×10¹⁰ CFU), B. longum (7×10⁹ CFU), S. thermophilus (1·5×109 CFU) and 100mg fructo-oligosaccharide( Reference Asemi, Zare and Shakeri 23 ).
Andreasen et al. ( Reference Andreasen, Larsen and Pedersen-Skovsgaard 24 ) also investigated the effect of probiotic supplementation on type 2 diabetic patients. In this double-blinded, randomised study, forty-five males with type 2 diabetes, impaired or normal glucose tolerance were enrolled and allocated to a 4-week treatment course with either L. acidophilus NCFM or placebo. Results showed an increase in insulin sensitivity in the probiotic group, whereas no significant difference was reported in the insulin level, FBS, PGF2h, HbA1c and insulin resistance( Reference Andreasen, Larsen and Pedersen-Skovsgaard 24 ). Similarly, a study conducted by Lindsay et al. ( Reference Lindsay, Kennelly and Culliton 20 ) showed that probiotic supplementation in the third trimester had no significant effects on the maternal fasting glucose (P=0·391) and the incidence of impaired glycaemia (IG) (P=0·561). In this placebo-controlled, double-blind, randomised trial, 175 pregnant women were randomly assigned to receive either a daily probiotic or a placebo capsule from 24 to 28 weeks of gestation in addition to routine antenatal care. With adjustment for BMI, the change in maternal fasting glucose was not different significantly between treated and control groups (−0·09 (sd 0·27) mmol/l compared with −0·07 (sd 0·39) mmol/l; P=0·391; B=−0·05; 95 % CI −0·17, 0·07). There were also no differences in the incidence of IG (16 % in the probiotic group compared with 15 % in the placebo group; P=0·561), birth weight (3·70 kg in the probiotic group compared with 3·68 kg in the placebo group; P=0·723) or other metabolic variables or pregnancy outcomes( Reference Lindsay, Kennelly and Culliton 20 ).
Ejtahed reported a significant reduction in FBS (P=0·009) and HbA1c after consuming probiotic yogurt by type 2 diabetic patients for 6 weeks (P=0·019). The insulin level was not significantly different between groups at the end of the study (P=0·955). In this randomised double-blind controlled trial, sixty individuals (twenty-three male and thirty-seven female) with type 2 diabetes and LDL-cholesterol >2·6 mmol/l were assigned to two groups. Participants consumed daily 300 g of probiotic yogurt containing L. acidophilus La5 and Bifidobacterium lactis Bb12 or 300 g of conventional yogurt for 6 weeks( Reference Ejtahed, Mohtadi-Nia and Homayouni-Rad 25 ). The results of the aforementioned studies are in line with the findings of the current study regarding insulin resistance. Some other studies have also revealed the positive effect of probiotic supplementation on regulating blood sugar indexes. For instance, a study conducted by Nitert et al. ( Reference Nitert, Barrett and Foxcroft 26 ) showed that probiotic supplementation for 16 weeks during pregnancy up to delivery could prevent gestational diabetes in high-risk pregnant women. In all, 540 women with a BMI>25·0 kg/m2 were recruited over 2 years and received either probiotics or placebo capsules from 16 weeks of gestation until delivery. The probiotics capsules contain >1×10⁹ CFU each of L. rhamnosus GG and B. lactis BB-12 per capsule( Reference Nitert, Barrett and Foxcroft 26 ).
In the same way, Laitinen et al. reported better glucose tolerance in the diet/probiotic group confirmed by a reduced risk of elevated fasting glucose compared with the control/placebo group (P=0·013), as well as by the lowest insulin concentration (P=0·032) and homoeostasis model assessment (P=0·028) and the highest QUICKI (P=0·028) after probiotic supplementation for 12 weeks during the last trimester of pregnancy in pregnant women with normal blood sugar( Reference Laitinen, Poussa and Isolauri 27 ).
Considering the above, it seems that the majority of human studies conducted in this field have mainly focused on patients with diabetes type 2 and pregnant women with glucose intolerance, with glucose disorders and insulin resistance being the primary symptoms in the latter group. However, these studies have submitted contradictory results. Our study population was selected from PCOS patients some of whom did not suffer from glucose metabolic disorders and insulin resistance. It seems that any difference in the frequency of IR in population of previous studies can explain contradictory findings. Conducting further research on PCOS patients with obesity and insulin resistance can be of interest. Any difference in the results of the present study compared with those of other relevant studies may be attributed to factors such as time duration, methodology, species, strain, amount and carrier of the probiotic bacteria used. In addition, the results of the current study revealed that synbiotic supplementation for 12 weeks had no significant effects on serum hs-CRP, although a decreasing trend was observed in the probiotic group. A small number of studies have been conducted on the effect of probiotic supplementation on inflammation factors in various diseases. In the only study investigating the effect probiotics on the hs-CRP level in PCOS patients, Shoae et al. reported that probiotic consumption for 8 weeks did not have any significant impacts on hs-CRP (P=0·14)( Reference Shoaei, Heidari-Beni and Tehrani 22 ). In addition, another research carried out by Mazlum and colleagues on type 2 diabetic patients showed that probiotic supplementation did not have any effects on the serum hs-CRP concentration( Reference Yousefinejad, Mazloom and Dabbaghmanesh 28 ). The reduction in inflammation and oxidative stress in diabetic patients in some other studies is believed to be attributed to increased GSH. GSH is an abundant cellular thiol that has been implicated in numerous cellular processes and in protection against oxidative stress. This index, however, was not among the variables of the present study. Asemi et al. ( Reference Asemi, Zare and Shakeri 23 ) investigated the effect of multispecies probiotic supplementation on metabolic profile and CRP in diabetic patients. The results indicated a significant reduction in hs-CRP (P=0·02)( Reference Asemi, Zare and Shakeri 23 ). However, the sample selected for this study was within the age range of 35–70 years, which is obviously too wide, plus the fact that ageing accounts for some increase in inflammation factors and oxidative stress. Similarly, Eslamparast et al. ( Reference Eslamparast, Poustchi and Zamani 29 ) examined the effect of synbiotic supplementation on hs-CRP in patients with non-alcoholic fatty liver disease. At the end of the study, the following significant differences (22·3 mmol/l; 95 % CI 23, 21·5 compared with 21·04 mmol/l; 95 % CI 21·5, 20·6; P<0·001) were seen between the synbiotic and placebo groups. The reason why the results of the latter differ from the findings of our study might be the difference in patient characteristics on their examination. In two other studies, which were carried out by Kekkonen et al. on healthy individuals, it was observed that consuming fermented milk containing lactic acid bacteria for a duration of 3 weeks reduced serum CRP( Reference Kekkonen, Lummela and Karjalainen 30 ). Furthermore, Matsumoto et al. ( Reference Matsumoto and Benno 31 ) reported that an anti-inflammatory metabolite was excreted in the intestine of the individuals who consumed probiotic yogurt, containing B. lactis. In this regard, in a clinical study on patients with type 2 diabetes, Andreasen et al. ( Reference Andreasen, Larsen and Pedersen-Skovsgaard 24 ) reported that supplementation with Lactobacillus acidophilus for 4 weeks had no significant impact on the systemic inflammatory response and the serum concentration of hs-CRP( Reference Andreasen, Larsen and Pedersen-Skovsgaard 24 ). This response was evaluated with the injection of Escherichia coli lipopolysaccharide (LPS) before and after the treatment. In fact, probiotic supplementation can effectively reduce inflammation through improving the intestinal microbiota, decreasing the permeability of the intestinal mucus against LPS, and blocking the entrance of endotoxins produced by the bacteria into the blood stream.
In the present study, synbiotic supplementation significantly reduced the serum level of apelin 36. We investigated the effect of synbiotic supplementation on serum level of apelin for the first time. However, some other clinical studies have examined the impact of medical therapy and weight loss on the serum level of apelin in insulin resistant patients( Reference Castan-Laurell, Vítkova and Daviaud 32 – Reference Sun, Wu and Zhou 34 ). The underlying assumption of mentioned studies is that the serum level of apelin is associated with nutritional state, plasma level of insulin, as well as insulin resistance and overweight in human and animal( Reference Ma, Yu and Wei 14 , Reference Chaves-Almagro, Castan-Laurell and Dray 35 , Reference Zhu, Sun and Li 36 ). According to the clinical studies, the effects of weight and therapeutic procedure on the serum level of apelin in patients with insulin resistance were considered.
In addition, the mechanism suggested in these studies is the relationship between apelin and the insulin level. On the other hand, a small number of studies have investigated the serum level of apelin in PCOS patients, indicating a significant rise in apelin in obese and overweight women with PCOS( Reference Cekmez, Cekmez and Pirgon 4 , Reference Olszanecka-Glinianowicz, Madej and Nylec 10 , Reference Gören, Sağsöz and Noyan 37 ). In fact, the mechanism considered for the rise in serum apelin in PCOS is increased insulin resistance and inflammation( Reference Spritzer, Lecke and Satler 38 ). One of the mechanisms suggested for reduced apelin levels may be the relationship between inflammation and insulin resistance( Reference García-Díaz, Campión and Milagro 12 , Reference Xu, Tsao and Yue 15 ). Therefore, it can be expected that their reduction may lead to reduced levels of serum apelin. Given that no significant decrease was found in the variables evaluated in this study, it appears that apelin reduction has almost nothing to do with the mechanism mentioned above, and some other mechanisms may be involved in the reduced apelin levels in these patients. One mechanism maybe changes in the intestinal microbiota on the basis of Dysbiosis of Gut Microbiota (DOGMA) theory and its effect on the endocannabinoid and apelinergic systems( Reference Tatemoto, Hosoya and Habata 11 , Reference Juan, Chen and Wang 39 ). As a matter of fact, an imbalance in the intestinal microbiota may increase the intestinal permeability and thus cause leakage of LPS into the blood stream, eventually leading to metabolic endotoxaemia. LPS activates the immune system, and its entrance in to the blood stream may prompt inflammation. As a result of LPS production, the tone of the eCB system and inflammation will increase( Reference Juan, Chen and Wang 39 , Reference Geurts, Lazarevic and Derrien 40 ). These two conditions can cause an increase in the apelinergic system in fatty tissues and the serum level of apelin( Reference Geurts, Neyrinck and Delzenne 13 ).
Considering that the mechanism just provided changes in the intestinal flora in PCOS patients may increase the serum level of apelin. In this regard, it can be hypothesised that microbiota changes through synbiotic consumption, which plays a role in apelin reduction( Reference Geurts, Neyrinck and Delzenne 13 ). Nonetheless, it seems that this reduction has no effective role in controlling the consequences of PCOS in these patients. On the basis of literature, there was no sufficient evidence about clinical significance of apelin 36. There are little data in the literature regarding changes in the apelin level or its relation to PCOS, and even the existing published results are inconsistent.
Considering the small number of investigations conducted in this regard, the interpretation of the findings in this study seems challenging. With this in mind, it is necessary to conduct further studies (randomised controlled trial) with longer durations, more sample size, use of other species and doses of various probiotic bacteria in patients with diverse phenotypes.
Finally, in this study, we examined the effect of synbiotics on the serum level of glucose, fasting insulin, HbA1c, PGF2h, indexes of insulin resistance and sensitivity, hs-CRP and apelin 36 in women suffering from PCOS for the first time. The sample size and duration of our study were greater than Shoaei et al.( Reference Shoaei, Heidari-Beni and Tehrani 22 ). Moreover, the synbiotic supplementation in this study was multi-bacterial. However, this study had some limitations:
-
(1) no examination of bacterial flora changes through bacterial analysis of the stool;
-
(2) inaccurate data collection regarding nutrition, which was done through self-report;
-
(3) exclusion of euglycaemic hyperinsulinaemic clamps which are more accurate methods to measure insulin response; and
-
(4) undocumented dosage of probiotic supplementation which was, of course, owing to lack of published articles in this regard.
Conclusion
Synbiotic supplementation for 12 weeks has no significant beneficial effects on the PGF-2h, fasting insulin level, HOMA-IR, QUIKI and hs-CRP in patients with PCOS. However, it causes a significant reduction in the serum level of apelin 36. Further studies are needed to elucidate the specific mechanism of action of synbiotics in PCOS patients and especially on changes of serum apelin levels.
Acknowledgements
The authors thank the participants, staff of Arash women’s hospital and Arash research development center for their assistance during data collection and data cleaning.
This research received no specific grant from any funding agency or commercial or not-for-profit sectors.
The contributions of the authors were as follows: E. K. carried out the data analyses and drafted the manuscript. A. M., M. Y., N. S., M. S. and M. J. H.-A. designed the trial; and E. K., and M. J. H.-A. coordinated the trial. N. S. and M. S. designed and supervised the dietary intervention implementation; and A. M. and M. Y. were in charge of the dietary data collection and management. All authors revised the article for intellectual content and approved the final manuscript.
M. H.-B. is the principal investigator of the study. The authors declare that there are no conflicts of interest.


