


Effects of the immune response on host metabolism and nutritional biomarkers
Infection and nutrition are intimately linked as infection causes an endogenous consumption of macronutrient stores( Reference Keusch, Macrae, Robinson and Sadler 1 ) and alterations in the concentrations of many micronutrients (MN) and nutrition biomarkers( Reference Louw, Werbeck and Louw 2 ). Following infection or tissue damage, a rapid and complex series of reactions takes place in human tissues to prevent ongoing tissue damage, isolate and destroy the infective organism, conserve and protect some MN and activate the repair processes that are necessary for restoring normal function( Reference Baumann and Gauldie 3 ). This immune response is also called the acute phase or inflammatory response. It is a homoeostatic process that is only intended to last a few days( Reference Steel and Whitehead 4 ) and in fact continued activity suggests a poor prognosis in many conditions( Reference Whicher 5 ). The responses take precedence over normal body metabolism with the objective of restoring normality as quickly as possible.
The cell most commonly associated with initiating the cascade of events during the acute phase response is the monocyte or macrophage( Reference Baumann and Gauldie 3 ). Activated macrophages release a broad spectrum of mediators of which the cytokines of the IL-1 and TNF families play unique roles in triggering the next series of reactions both locally and systemically. Locally, stroma cells, e.g. fibroblasts and endothelial cells are activated to release the second wave of cytokines that include IL-6 as well as more IL-1 and TNF. These magnify the stimulus and potentially prime all the cells in the body to initiate and propagate this homoeostatic signal.
The endothelium plays a critical role in communicating between the sites of tissue damage and circulating leucocytes. IL-1 and TNF induce changes in the surface expression of adhesion molecules to slow circulating leucocytes and initiate trans-endothelial passage into tissues. Inflamed tissues release mediators that promote dilation and leakage of blood vessels particularly in post-capillary venules resulting in tissue oedema and redness. The increase in vasodilatation and capillary permeability also contributes to the rapid fall in serum proteins such as albumin, transferrin and retinol binding protein( Reference Fleck and Myers 6 ) and to some of the early changes in nutrient concentrations in the plasma. Aggregation of platelets can stimulate the clotting cascade and release further molecules such as bradykinin causing pain and inflammation( Reference Baumann and Gauldie 3 ).
Systemically, the most important tissues affected by the initial waves of cytokines are the liver and the hypothalamus. Alterations to the temperature setpoint in the hypothalamus can promote fever which is one of the most common manifestations of infection( Reference Keusch, Macrae, Robinson and Sadler 1 ). It enhances the host defenses, may kill some pathogens but it increases the requirements for energy. A 1°C rise in temperature increases basal metabolism by 13 %. Reserves of carbohydrate to fuel the energy supply are usually limited hence muscle protein is catabolised to supply amino acids for gluconeogenesis as well as the many new proteins, peptides( Reference Steel and Whitehead 4 ) and immune cells required for the immune response. Cytokines also cause lipolysis with the release of fatty acids for energy production, and the internal consumption of protein and fat is reflected in the loss of muscle and subcutaneous fat mass, weight loss and a reduction in linear growth. If multiple infections follow one another in rapid sequence as is common in many developing countries( Reference Rowland, Cole and Whitehead 7 , Reference Shankar, Genton and Semba 8 ) and where diets are at best marginal in terms of supplying sufficient energy and good quality protein, catch-up growth will not occur and progressive malnutrition results( Reference Keusch, Macrae, Robinson and Sadler 1 ).
Acute phase proteins
As part of the acute phase response, the liver is induced to synthesise a number of acute phase proteins (APP) with specific functions in augmenting immune cell activity, and protecting and repairing tissues from cellular damage caused by immune cell activity( Reference Steel and Whitehead 4 ). Among the proteins that are synthesised by the liver are two APP, C-reactive protein (CRP) and α1-acid glycoprotein (AGP). At the onset of infection, CRP increases rapidly over the first 24–48 h to reach a plateau at or around the appearance of clinical symptoms. The rise starts within 6 h and the increase in concentration may be several 100-fold( Reference Fleck and Myers 6 , Reference Calvin, Neale and Fotherby 9 ). CRP concentrations fall at about the time the clinical symptoms disappear. In contrast, it is unusual to detect an elevation in AGP in the first 48 h and concentrations are not maximal until 4–5 d following infection. The concentration of AGP does not fall as symptoms decline but remains elevated during convalescence( Reference Fleck and Myers 6 , Reference Stuart and Whicher 10 ). These proteins are especially useful both for detecting inflammation in people with no clinical symptoms as well as monitoring the severity of infection. However, it is the ability of CRP and AGP to detect inflammation in people who are apparently healthy that will be discussed in the present paper.
Effect of immune response on nutrients and nutrient biomarkers
The immune response has major effects on the serum concentrations of several important nutrients or nutrient biomarkers( Reference Thurnham, Mburu and Mwaniki 11 ) including retinol( Reference Louw, Werbeck and Louw 2 , Reference Ramsden, Prince and Burr 12 ), ferritin( Reference Feelders, Vreugdenhil and Eggermont 13 ), transferrin receptors( Reference Beesley, Filteau and Tomkins 14 ), iron( Reference Beisel 15 ), zinc( Reference Beisel 15 , Reference Mburu, Thurnham and Mwaniki 16 ), carotenoids, 25-OH cholecalciferol (vitamin D), α-tocopherol, total lipids, pyridoxal phosphate and vitamin C( Reference Louw, Werbeck and Louw 2 ). In the present paper, I will focus on retinol, ferritin and zinc as evidence suggests that the plasma concentration of these substances changes very rapidly following infection or trauma. Accurate measurements of vitamin A and iron status are important for national statistics to plan for the proper utilisation of government resources and they are especially important to evaluate the effectiveness of nutritional interventions. It is therefore important to exclude persons with inflammation from such investigations or to be able to compensate in some way if inflammation is present.
The reduction in plasma retinol brought about by the immune response can be large and is rapid. In this study, illustrated in Fig. 1, retinol concentrations in men and women who underwent uncomplicated orthopaedic surgery fell by approximately 40 % in the following 48 h( Reference Louw, Werbeck and Louw 2 ). The large fall in plasma retinol concentration is in stark contrast to the effects of a dietary deficiency of vitamin A where plasma retinol concentrations do not fall before liver reserves become dangerously low and that can take several months in an infant( Reference Miller, Humphrey and Johnson 17 ) and several years in an adult( Reference Hume and Krebs 18 ). Plasma retinol concentrations are used to measure vitamin A status by assessing the number of subjects in a sample with retinol concentrations below 0·7 μmol/l who would be classified as vitamin A deficient. We have shown that inflammation can be present in many apparently healthy infants and children in developing countries and this can lead to an overestimate of vitamin A deficiency( Reference Paracha, Jamil and Northrop-Clewes 19 , Reference Thurnham, Northrop-Clewes and McCullough 20 ).
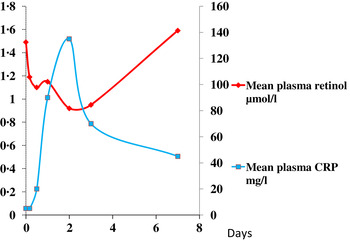
Fig. 1. (colour online) Simultaneous changes in the serum concentrations of retinol and C-reactive protein (CRP) in men and women undergoing uncomplicated orthopaedic surgery. Data modified from( Reference Louw, Werbeck and Louw 2 ).
In contrast to vitamin A, plasma ferritin concentrations are increased by inflammation. Ferritin is a biomarker of liver iron stores, and serum ferritin concentrations below 12 or 15 μg/l indicate depletion of iron stores in persons under 5 years and over, respectively( 21 ). Hence, iron deficiency is potentially obscured by inflammation. Nevertheless, plasma ferritin concentrations responded well in iron-intervention studies( Reference Mei, Cogswell and Parvanta 22 ) and Hb and ferritin were the principal recommendations of the World Health Organisation at a meeting in 2004 to discuss ways of assessing iron status in populations( 23 , 24 ). However, changes in plasma ferritin concentrations also occur rapidly in an immune response (Fig. 2)( Reference Feelders, Vreugdenhil and Eggermont 13 ). Ferritin concentrations rose in parallel with the rise in CRP and increased from 150 to 350 μmol/l in 48 h, i.e. an increase of 130 %. Furthermore, ferritin concentrations remained high after CRP declined. Thus, the large increase in ferritin concentrations when inflammation is present can lead to a potentially serious underestimate of iron deficiency in a population.
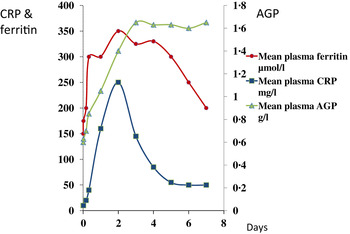
Fig. 2. (colour online) Simultaneous changes in the serum concentrations of ferritin and C-reactive protein (CRP) and α1-acid glycoprotein (AGP) in patients following limb surgery.
These figures (Figs. 1 & 2) show parallel changes in both retinol and ferritin with the rise in CRP in the early stages of the acute phase response. It is important to note however that these are not necessarily linear association between the nutrient biomarkers and CRP. It is clear from the data in Fig. 2, that on days 2 and 5, although the increases in ferritin were very similar (200 and 170 μmol/l or 130 and 113 %, respectively) they were associated with very different CRP concentrations of 350 and 50 mg/l, respectively. Other workers have also concluded that the use of linear regression to correct ferritin concentrations for the influence of inflammation was poorly predictive( Reference Beard, Murray-Kolb and Rosales 25 , Reference Witte 26 ).
At present, many workers avoid or underestimate the problem of inflammation by only using CRP to identify inflammation, by excluding subjects with raised APP from their database and by using the relatively high cut-off for CRP of 10 mg/l to reduce the number of subjects excluded to a minimum. All the methods potentially bias the data and may not completely remove subjects with inflammation. In the present paper, in apparently healthy populations, we have found that AGP is more frequently elevated than CRP and that by ignoring AGP, on average, only half the inflammation in a study was accounted for( Reference Thurnham, McCabe and Haldar 27 ). Furthermore, excluding subjects with inflammation would be inappropriate where large numbers of subjects have elevated APP as in the study on Gambian infants where at 12 months of age the figure was more than 90 %( Reference Darboe, Thurnham and Morgan 28 ).
Use of acute phase proteins to quantify the effects of inflammation on plasma biomarkers
Although no single APP yet identified has the same synthesis and decay characteristics as nutrient biomarkers, the use of two APP that approximately cover the same time span as the disturbance in nutrient biomarker concentrations can be used successfully. The principle of the method is shown in Fig. 3 using CRP and AGP( Reference Thurnham, Mburu and Mwaniki 29 ). The figure models the rise and fall in the concentrations of the two APP and includes a period of sickness of arbitrary severity and length. In the prevalence or nutritional intervention studies, only apparently healthy people are included and those who are sick are generally excluded. Therefore, the figure shows that apparently healthy people in any study can be categorised into four groups according to which the APP are elevated namely reference, incubation and early and late convalescence groups. The cut-off values used to indicate inflammation were >5 mg/l and >1 g/l for CRP and AGP, respectively( Reference Thurnham, McCabe and Northrop-Clewes 30 ). Subjects in group I, the reference group, will be the ones in any community whose nutritional status is least likely to be influenced by inflammation and therefore will provide the best estimate of the nutritional status. It is however desirable always to include all the results in assessing the nutritional status of a community and therefore we have suggested that correction factors should be calculated for each of the inflammation groups (incubation, early and late convalescence)( Reference Thurnham, Mburu and Mwaniki 11 , Reference Thurnham, Mburu and Mwaniki 29 , Reference Mburu, Thurnham and Mwaniki 31 ). This was done by taking the mean or median of the reference group and each of the inflammation groups and the differences expressed as a percentage (Fig. 4). These percentages were then used to increase (retinol; Fig. 4) or reduce (ferritin) by the respective concentrations in the inflammation groups. The reference and corrected results for the inflammation groups were then totalled and the proportion of subjects in the revised values outside the appropriate threshold calculated to determine the number at risk of nutritional deficiency.
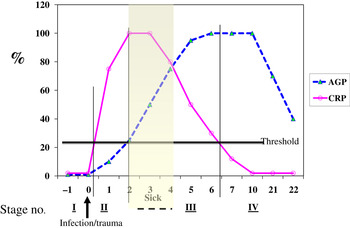
Fig. 3. (colour online) Model of response by C-reactive protein (CRP) and α1-acid glycoprotein (AGP) after an inflammatory stimulus to show method of categorising apparently healthy persons with inflammation.
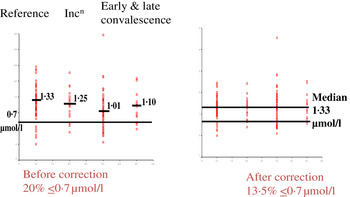
Fig. 4. (colour online) Correcting plasma retinol concentrations for subclinical inflammation. Incn, incubation.
In the example shown, correcting the data to remove the influence of inflammation reduced the number of subjects at risk of vitamin A deficiency from 20 to 13·5 %. That is, the calculations suggested that 6·5 % of the low values were due to inflammation. The reader should be clear that these calculations do not remove the risks associated with low retinol concentrations. These may still exist irrespective of the fact that 6·5 % were due to inflammation. The data do however indicate that if vitamin A supplementation is conducted, only those subjects in whom the low retinol values are due to a dietary deficiency will respond. Even after a full supplementation regimen, there may still be 6·5 % with low retinol values as the vitamin A supplement alone may have no effect on inflammation.
Performing these calculations for individual studies may not always be possible as there may be insufficient subjects in one or other of the groups to provide a reliable correction. In addition, different studies are influenced by different factors that might bias the results. We therefore, carried out meta-analyses on studies where concentrations of retinol( Reference Thurnham, McCabe and Northrop-Clewes 30 ) or ferritin plus two APP were available( Reference Thurnham, McCabe and Haldar 27 ). These studies produced the results in Table 1 which show the percentage differences between each of the inflammation groups and the reference group. We suggest that other workers in the field now apply these results to new data to remove the effects of inflammation. It will be interesting to see how corrected data from subjects with inflammation compare with results from the respective reference groups. Theoretically, the proportion of at-risk subjects in the three inflammation groups after correction should be very similar to the proportion of at-risk subjects in the reference group.
Table 1. Effects of inflammation on serum retinol and serum ferritin concentrations: results of meta-analysis
Results from meta-analysis of effects of inflammation on retinol in seven studies( Reference Thurnham, McCabe and Northrop-Clewes 30 ) and ferritin in twenty-two studies( Reference Thurnham, McCabe and Haldar 27 ). Percentages represent the geometric mean of the differences between each inflammation group and the respective reference group. Inflammation groups were identified as described in Fig. 3.
Using inflammation to interpret data from a micronutrient intervention study in apparently healthy, HIV+ Kenyan adults
Iron
We investigated the effects of inflammation on ferritin and zinc results obtained following an intervention study in apparently healthy, HIV+ Kenyan adults. In brief, 180 adults who had tested positive on two occasions (INNOTEST HIV-1/HIV-2 antibody test, Innogenetics) were recruited for a feeding study to determine what nutritional benefits a nutritional supplement could provide. The subjects were allocated to receive a daily food supplement (food: 500 g of an unfortified, unsweetened maize (90 %)–soya (10 %) blend) or the food plus an MN capsule containing supplements of iron (30 mg/d as ferrous fumarate) or zinc (15 mg/d, as zinc gluconate) plus other nutrients. From these recruits, 163 blood samples were obtained at baseline (56 men and 107 women) and eighty-two samples (twenty-seven men and fifty-four women) at 3 months. In the raw data, there were no obvious benefits from the supplements in the feeding study in the HIV+ Kenyan adults at 3 months( Reference Mburu, Thurnham and Mwaniki 16 , Reference Mburu, Thurnham and Mwaniki 31 ). That is, inflammation obscured any benefits.
Baseline Hb and ferritin values for the men and women categorised by inflammation are shown in Table 2. Iron status was not really a problem in the Kenyan men but in the uncorrected data, eleven women (16 %) had inadequate ferritin concentrations and on correction for inflammation this more than doubled to twenty (37 %)( Reference Thurnham, Mburu and Mwaniki 11 ). Correction for inflammation made no difference to the Hb values but had a large effect on ferritin. Similarly, when we investigated whether food or food plus MN supplement had any effects on Hb or ferritin, there were no effects on Hb but when the ferritin data were corrected for inflammation the increase in response to the MN supplement became remarkably similar in both men (29 %, 48/166) and women (12/41 29 %; Table 3).
Table 2. Uncorrected plasma ferritin and Hb concentrations in apparently healthy, HIV+ men and women at recruitment
Subjects were categorised into the reference and three inflammation groups using the criteria described in Table 1 in the present paper. Values are medians. Data are from Mburu et al.( Reference Mburu, Thurnham and Mwaniki 31 )
Table 3. Change in plasma ferritin concentrations after 3 months supplementation with food with or without a micronutrient (MN) supplement; effect of correction for inflammation
* Since concentrations of ferritin differed markedly in men and women, data were corrected using sex-specific correction factors for the men and women for the incubation (0·63, 0·82), early (0·165, 0·19) and late convalescence (0·307, 0·38) groups, respectively. Percentage changes were calculated using the uncorrected and corrected median values for the men (488, 166) and women (90, 41 μg/l), respectively. Data taken from( Reference Thurnham, Mburu and Mwaniki 11 , Reference Mburu, Thurnham and Mwaniki 31 ).
Data are medians (25th, 75th quartiles; percentage of change) of the changes in ferritin between baseline and 3 months. All the subjects received the daily food supplement (500 g maize–soya blend) or the food plus the multi-MN supplement that contained 30 mg iron as ferrous fumarate, 15 mg zinc as zinc gluconate and other MN ( Reference Mburu, Thurnham and Mwaniki 16 , Reference Mburu, Thurnham and Mwaniki 31 ).
However, the data became even more interesting when we examined the change in Hb and ferritin values in response to the supplements for those with and without inflammation at baseline and 3 months. To perform this analysis we combined the results for men and women (Table 4). The food-only supplement had no significant effect on either Hb or ferritin in any subgroup. However, in response to the MN supplement in the group with no inflammation there was a significant rise in Hb (18 %) and a non-significant rise in median ferritin concentrations from 38 to 70 μg/l. In contrast, in the group displaying inflammation at some time point, there was no significant change in Hb but the median ferritin concentration increased from 52 to 84 μg/l (paired t-tests, both P < 0·05). These data suggest that the MN supplement was being absorbed by both groups of subjects; but, in those with no inflammation, the iron was used for Hb synthesis and storage in the liver was probably erratic but in those with inflammation, absorbed iron may have been more consistently directed to the liver and significantly increased serum ferritin concentrations.
Table 4. Effects of food and iron supplement on ferritin and Hb concentrations in subjects with no inflammation compared with those experiencing inflammation on at least one occasion.* † ‡
MN, micronutrient.
* Values are medians (25, 75 centiles). Subjects were men and women combined. Those with no inflammation were always in the reference group; subjects with inflammation were never in the reference group. Treatments are described in Table 3. Unlike superscripts between times indicate a significant difference (paired t test, P < 0·05).
† Ferritin values for inflammation were corrected for inflammation as described in Table 3.
‡ Information from Mburu et al.( Reference Mburu, Thurnham and Mwaniki 31 ).
Zinc
Early work in human volunteers suggested that plasma zinc concentrations fell rapidly and markedly following an immune response. For example, serum zinc concentrations fell by 70 % in the first 24 h when American army recruits were given sandfly fever( Reference Beisel 15 ). However, in community studies we do not find evidence of such large depressions in plasma zinc concentrations in apparently healthy persons (Table 5). In the Kenyan adults, plasma zinc concentrations in all groups suggested that >50 % were at risk of zinc deficiency (<10 μmol/l). This was not surprising as others have reported that phytate intakes in Kenya are among the highest in the world( Reference Gibson and Fergusson 32 , Reference Hotz and Brown 33 ). However, in spite of the low plasma zinc concentrations, inflammation only depressed zinc concentrations by another 10 %( Reference Mburu, Thurnham and Mwaniki 16 ). Similar effects of inflammation were found by others in Indonesian infants where although zinc status was much better, differences between the inflammation groups and the reference group were only approximately 10 %( Reference Wieringa, Dijkhuizen and West 34 ). Small differences in zinc concentrations between the inflammation groups and the reference group meant that the correction factors were small and were not helpful in interpreting the data.
Table 5. Plasma zinc concentrations in apparently healthy, HIV-infected Kenyan adults and Indonesian infants categorised by inflammation status
Data are μmol/l, means (sd) and number of subjects. Categorisation for inflammation of Kenyan data performed as described in the present paper in Fig. 3 ( Reference Mburu, Thurnham and Mwaniki 16 ) and for the Indonesian data performed by the same method but using cut-offs of 10 mg/l for C-reactive protein and 1·2 g/l for α1-acid glycoprotein( Reference Wieringa, Dijkhuizen and West 34 ).
To determine whether the zinc supplement had any effects on status we therefore analysed the data by separating the subgroup that never displayed inflammation from the groups that did (Table 6). The food supplement alone did not influence serum zinc concentration in any group but in the group with no inflammation, there was a 10 % increase in plasma zinc (0·95/9·5 μmol/l, P = 0·031) in response to the MN supplement and inflammation appeared to depress any plasma response to the MN supplement. Zinc may have been absorbed even in those with inflammation but diverted to the tissues. Unfortunately, we measured no other zinc biomarker but at present there is no simple marker for zinc in tissues, like ferritin is for iron( Reference Mburu, Thurnham and Mwaniki 16 ). Such investigations would require the use of isotopic zinc to measure any changes in the tissue.
Table 6. Influence of inflammation on the plasma zinc response to three month supplementation with 15 mg zinc

Values are μmol/l, sd and numbers. Differences in zinc between baseline and month 3 were examined using repeated measures ANOVA using treatment and inflammation status as between-subject variables. Zinc response differed between subjects in response to inflammation (P = 0·032). Treatments are described in Table 3 (the present paper) where the micronutrient+food group received 15 mg zinc as zinc gluconate plus food( Reference Mburu, Thurnham and Mwaniki 16 ).
Discussion and conclusions
To summarise, we found that the use of two APP, CRP and AGP, to identify subjects with inflammation enabled us to show that iron deficiency was significantly underestimated in uncorrected data and that the presence or absence of inflammation determined whether absorbed iron was stored as ferritin or utilised for Hb synthesis, respectively. In the case of the zinc supplement, serum zinc concentrations only increased in response to the supplement in people without inflammation. The results illustrate that where subclinical inflammation is present, it should be identified to correctly evaluate nutritional status and interpret the effects of intervention.
It has been reported that the production of APP is impaired in severely malnourished children( Reference Doherty, Golden and Raynes 35 ). The authors studied two APP, CRP and serum amyloid A (SAA) in sixty-five Jamaican children of whom fifty had clinical or laboratory evidence of infection. SAA is a protein with many characteristics similar to CRP( Reference Van Leeuwen and Van Rijswijk 36 ). CRP was not elevated in twenty-three (46 %) and SAA was not elevated in twenty-nine (58 %) of the children. However, most of these children were classified as marasmic, kwashiorkor or a combination of the two criteria. Such children would not be regarded as apparently healthy; however the authors also found that the APP response in mildly malnourished children (weight for age and height for age −1·7 Z scores) on vaccination was also impaired. To assess inflammation, the authors used cut-offs of 10 mg/l for CRP and 5 mg/l for SAA. We believe 5 mg/l for CRP is more appropriate( Reference Thurnham, McCabe and Northrop-Clewes 30 ) and might have changed the Jamaican results slightly. However, an explanation of these findings is not immediately apparent and we have not found any similar lack of APP responses in Gambian children with similar mild malnutrition( Reference Darboe, Thurnham and Morgan 28 , Reference Northrop-Clewes, Lunn and Downes 37 ).
It has been reported that CRP mainly responds to bacterial infections, but SAA is stimulated by both bacterial and viral infections( Reference Van Leeuwen and Van Rijswijk 36 ). It is possible therefore that using CRP to detect subjects in incubation and early convalescence may underestimate subjects with inflammation from viral infections. However, we have used CRP to detect inflammation in apparently healthy HIV+ Kenyan adults( Reference Thurnham, Mburu and Mwaniki 11 , Reference Mburu, Thurnham and Mwaniki 16 , Reference Thurnham, Mburu and Mwaniki 29 , Reference Mburu, Thurnham and Mwaniki 31 ) and the results did not stand out as unusual when the Kenyan data were compared with other studies in the ferritin meta-analysis( Reference Thurnham, McCabe and Haldar 27 ). There was also no difference in the proportion of people with inflammation when HIV-infected South African women were compared with HIV-uninfected women at 6 weeks post partum ( Reference Papathakis, Rollins and Chantry 38 ). Furthermore, we compared the difference in plasma retinol concentrations between apparently healthy subjects with raised CRP or raised SAA and the appropriate reference groups; there was very little difference in the retinol reductions attributable to the two proteins( Reference Thurnham, McCabe and Northrop-Clewes 30 ), and, when we looked at ferritin increases in apparently healthy subjects with and without HIV+, there were no significant differences( Reference Thurnham, McCabe and Haldar 27 ). Therefore, we think CRP is sufficiently sensitive to detect inflammation in viral conditions of public health importance.
In conclusion, we suggest that all workers measuring MN status in apparently healthy subjects should measure the two proteins CRP and AGP and apply the correction factors in interpreting their data. Even if the correction factors cannot be calculated, e.g. if there were insufficient people in the reference group, or fail to influence their data, because of small sample sizes, examining subjects with inflammation separately from those without, can reveal some interesting differences in the way MN status sometimes responds in people with and without inflammation.
Acknowledgements
I thank all the people who are named in the references who have helped with these studies.
Financial Support
I am also grateful to UNICEF and the Dutch Government who funded the Kenyan studies and to the International Life Sciences Institute and Harvest Plus, both in Washington, who supported the meta-analyses.
Conflicts of Interest
None.
Authorship
The author was solely responsible for all aspects of preparation of this paper.


