


In 1989, the Department of Health's Committee on Medical Aspects of Food Policy (COMA) recommended that dietary sugars be divided into intrinsic and milk sugars (IMS) and non-milk extrinsic sugars (NMES). Only the latter were seen as a threat to health (mainly dental health) and they recommended that consumption of NMES should decrease1. In their report in 1991 on Dietary Reference Values for the UK2, COMA endorsed the 1989 report and recommended that the population target for the proportion of energy from NMES should be no more than 10% (with a minimum of 0%) or 60 g day− 1. When calculated as a proportion of energy, IMS should be included with starch, and intakes of this grouping should increase to provide the majority of dietary energy2. These UK recommendations are similar to those of the World Health Organization (WHO)3, 4, although WHO uses the term ‘free sugars’ rather than NMES. The older term ‘added sugars’ – added by manufacturer, cook or consumer – was superseded by recommendations of the Department of Health1 report, the main difference being the inclusion of sugars in fruit juices within NMES.
A number of studies have provided information on sugar consumption by adolescents. The largest survey in the UK was the National Diet and Nutrition Survey (NDNS) of young people aged 4–18 yearsReference Gregory and Lowe5, conducted in 1997 on 475 children aged 11–14 years. Mean consumption of NMES was reported to be 90 g (17% of energy) by the 237 boys and 73 g (16% of energy) by the 238 girls. The survey also reported that confectionery and soft drinks were the main sources of NMES, providing 54–56% of NMES. In their study of 12-year-old children in Northern Ireland, undertaken in 1990–91, Strain et al.Reference Strain, Robson, Livingstone, Primrose, Savage and Cran6 reported total sugars, without subdividing these sugars. Mean total sugar consumption was 139 g day− 1 in boys and 121 g day− 1 in girls, providing a fifth of food energy. The main sources of these sugars were cakes and biscuits, confectionery and beverages.
Outside the UK, Munoz et al.Reference Munoz, Krebs-Smith, Ballard-Barbish and Cleveland7 reported that ‘added sugars’ provided 16–17% of food energy in 12- to 19-year-old American adolescents. Fourteen per cent of food energy was reported to come from added sugars in 11–14-year-olds in DenmarkReference Lyhne and Ovesen8. The same percentage was recorded in a survey of German 11–12-year-oldsReference Kersting, Sichert-Hellert, Alexy, Manz and Schoch9. Simple sugars (not clearly defined) provided 17% of food energy in Canadian 10–12-year-oldsReference Shatenstein and Ghadirian10; while, in New Zealand, total sugars provided the very high level of 26% of food energy in 10–11-year-oldsReference George, Brinstone, Paulin and Aitkin11.
There are few data available to determine trends in sugar consumption by adolescents in the UK. The national survey of diets of British schoolchildren in 198312 did not record consumption of sugars, precluding comparisons with the 1997 NDNSReference Gregory and Lowe5. Inchley et al.Reference Inchley, Todd, Bryce and Currie13 estimated food consumption by 11-, 13- and 15-year-old Scottish school pupils, using a self-completion food-frequency questionnaire, at three time points – 1990, 1994 and 1998. They reported a rise in the proportion of both boys and girls consuming confectionery daily (from 68 to 78% in boys and from 63 to 73% in girls over the eight years), while there had been no change in the proportion consuming soft drinks (recorded in 1994 and 1998 only). Over the 10 years to 1999, sales of soft drinks in the UK increased from 8.3 × 10¹¹ to 10.5 × 10¹¹ litres14.
Annually, for 15 years (1985–2000), the diets of children and adolescents (2–18 years) in Dortmund, Germany, were recordedReference Alexy, Sichert-Hellert and Kersting15. Information was obtained using a 3-day weighed dietary record, and ‘added sugars’ were quantified. The intake of added sugars remained constant over time and, for all ages combined, added sugars provided 11–13% of energy. Cavadini et al.Reference Cavadini, Siega-Riz and Popkin16 reported trends in food intake in US adolescents between 1965 and 1996. While total milk consumption fell by 36% (to 746 g day− 1 for boys and to 481 g day− 1 for girls in 1996), soft drink consumption nearly tripled in the boys (to 1498 g day− 1 in 1996) and more than doubled in the girls (to 1037 g day− 1 in 1996).
Thus, many studies have shown that consumption of sugars by young adolescents is higher than recommended. Public health advice is more effective in terms of foods; hence, knowing the dietary sources of sugars is important for health education.
In 1979–81, a survey was conducted of 405 young adolescents in south Northumberland (the 1980 study). The consumption of totalReference Hackett, Rugg-Gunn, Appleton, Allinson and Eastoe17 and added and naturalReference Rugg-Gunn, Hackett, Appleton and Moynihan18 sugars was reported. A repeat study was undertaken in 1989–90 (the 1990 study) involving the same seven schools and school year, and using the same methods. Sugar consumption and trends from 1980 to 1990 were reportedReference Rugg-Gunn, Adamson, Appleton, Butler and Hackett19. During the school year 1999–2000, a further survey was undertaken. The purpose of the present paper is to report sugar intake in the 2000 study, and trends in sugar consumption and dietary sources of sugars in young adolescent Northumbrians over 20 years.
Methods
The study was conducted in seven middle schools in south Northumberland, in the north-east of England: these were the same schools that participated in the studies in 1980 and 1990. The schools were originally selected to represent all social class groups. More detail on the process of recruitment of schools and representativeness of the schools selected has been reported previouslyReference Hackett and Rugg-Gunn20–Reference Adamson, Rugg-Gunn, Butler, Appleton and Hackett22. The study protocol was approved by the local research ethics committee, and the County Education Authority approved access to the schools. Parents or guardians of all children in Year 7 (aged 11–12 years) were invited to give informed written consent to their child participating in the study which took place between October 1999 and July 2000.
Dietary information was obtained from each child using a self-completion 3-day diet diary with private interview with the study nutritionist on the fourth day. This was repeated – giving 6 days record per child – with the first diary being completed between October and February, and the second diary between March and July. Six different days of the week were chosen for each child, who received full instructions on how to complete the diary at the time of issue. The study was undertaken by one nutritionist who was trained by, and calibrated with, the nutritionist who undertook the 1990 study. Information recorded was: time of day the food was consumed, where it was purchased, what the food was and how much was eaten or drunk in household measures. At the interview after completion of the diary, the type of food/drink and the quantities consumed were clarified using photographs, calibrated cups, bowls, spoons, etc., and food models.
Data were entered into an electronic database, and energy and nutrient values calculated using contemporary UK food composition tablesReference Holland, Unwin and Buss23–Reference Chan, Brown, Church and Buss31 and were not subsequently reanalysed using updated versions of food composition tables. Some additional information was obtained from food manufacturers. Values for total sugars (defined as all mono- and disaccharides) and lactose concentrations were available in food tables, but values for NMES and intrinsic sugars were not. These values were obtained using the method described by Rugg-Gunn et al.Reference Rugg-Gunn, Adamson, Appleton, Butler and Hackett19 and Kelly et al.Reference Kelly, Moynihan, Rugg-Gunn and Summerbell32 and given in the Appendix. In brief, NMES included ‘added sugars’Reference Rugg-Gunn, Hackett, Appleton and Moynihan18 plus sugars from fruit in fruit juices and other soft drinks. Fruit sugars derived from the fruit in jams and in yoghurts were classified as intrinsic, while sugars added to those foods were classified as NMES. Sugars in dried fruit were classified as intrinsic. All sugars in chocolate were classified as NMES. For energy and all nutrients, the mean of 6 days was calculated for each child.
Foods were grouped in order to determine the relative importance of dietary sources of total sugars, IMS and NMES. The groups were as described by Rugg-Gunn et al.Reference Rugg-Gunn, Adamson, Appleton, Butler and Hackett19.
All food consumed was categorised by the nutritionist as part of a meal or a snackReference Fletcher33. A meal had at least three of the following attributes: a number of items eaten together over a 30 min period; a major contribution to the energy intake for that day; eaten at recognised mealtimes; eaten with a knife, fork or spoon; and consisting of at least three items. Foods were also classified according to where they were obtained or purchased. This could be: the child's home; a home other than the child's; school meal; school tuck-shop; or other.
An estimate of the validity of the dietary survey method was made by calculating the ratio of recorded energy intake to estimated basal metabolic rate for this age group2, Reference Schofield, Schofield and James34. An estimate of reliability of the 1980 data was undertaken by Hackett and Rugg-GunnReference Hackett and Rugg-Gunn20.
The parental occupation of each child was used to classify the subjects into ‘high’, ‘middle’, ‘low’ and ‘unclassified’ social groups35. The national system of classifying parental occupation had changed substantially since our first survey in 198036. Because of the need for valid comparisons across social groups and across surveys within social groups, the Occupational Information Unit of the Office of National Statistics classified parental occupation in the present study using the Simplified Social Class based on the Standard Occupational Classification 1990 (OPCS, 1990; Occupational Information Unit, personal communication). These and other aspects of the study are described more fully by Fletcher et al.Reference Fletcher, Rugg-Gunn, Matthews, Hackett, Moynihan and Mathers21.
Descriptive data are presented as means and standard deviations. Statistical analyses were undertaken to determine the effect of sex, social group and year of study, using multiple regression37.
Results
The same seven selected schools participated in all three surveys. The numbers of subjects completing each survey was ~400, i.e. 60–70% of those eligible (Table 1). Slightly more girls than boys participated in each survey. The distribution of the subjects by social class changed markedly over the 20 years. In 2000, the ratio of measured energy intake to estimated basal metabolic rate was 1.38 in both boys and girlsReference Fletcher, Rugg-Gunn, Matthews, Hackett, Moynihan and Mathers21. A previous estimate of the reliability of intake of total sugars obtained by two surveys of 3 days each, was 0.59Reference Hackett and Rugg-Gunn20.
Table 1 Sample characteristics for the three studies
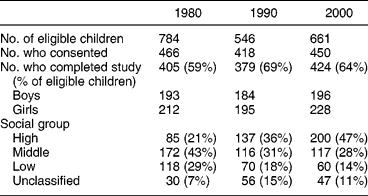
Energy, carbohydrate and sugar intakes for all subjects and for each sex separately for all three surveys are given in Table 2, while Table 3 gives information on sugar intake by survey, sex and social group. Energy intake was lower in 2000 than in the previous surveys, especially in the girls (P < 0.001). Carbohydrate intake (g) by boys was higher (P < 0.0005) but there was no difference between social class (P = 0.9) (data not shown) or survey (P = 0.4).
Table 2 Mean daily intake of energy, carbohydrate, total sugars, non-milk extrinsic sugars, and milk and intrinsic sugars for boys, girls and all subjects, according to the year of study (95% confidence intervals are given in parentheses)

Table 3 Mean daily weight (g) of total sugars, non-milk extrinsic sugars, and milk and intrinsic sugars consumed by boys and girls of three different social class groups in the three studies, together with the percentage of total sugars that were non-milk extrinsic sugars and their contribution to total energy intake (95% confidence intervals are given in parentheses)

Total sugar intake (g) was higher in boys (across all surveys) (P = 0.003) and lower in the 2000 survey (P = 0.0007); there was no effect of social class (P = 0.4). As a percentage of energy, total sugar intake was higher in girls (P = 0.03), higher in the high social group (P = 0.007) and lower in the 2000 survey (P = 0.03). However, the magnitude of the differences was < 2%. Over all three surveys, the percentage contribution of total sugars to energy intake was ~22%.
For all subjects, NMES intake was 81 g day− 1 in 2000, providing 16% of energy intake and 31% of carbohydrate intake. Consumption followed the pattern for total sugars – as NMES accounted for 73–77% of total sugars – being higher in boys (P = 0.035). There were no differences between social classes, but intake was substantially higher in 1990 (P = 0.0004). As a percentage of energy, intake of NMES was ~0.5 percentage units higher in girls (P = 0.04); it also differed between surveys (P = 0.0005), being lowest in 1980 (15%) and highest in 1990 (16.9%). There were no differences between social groups (P = 0.6). In 2000, only 8% of boys and 5% of girls had diets meeting the national population target of < 10% of energy from NMES.
Intake of IMS was 27 g day− 1 in 2000, contributing 5.5% of energy intake, for all subjects. Consumption (g) was higher in boys, in the higher social groups and in the earlier surveys (P < 0.0005, in each case). Intake fell by nearly 9 g in boys and girls between 1980 and 2000. In 2000, intake was >4 g higher in the high social group than in the low social group. When expressed as a percentage of energy, there was no difference between boys and girls (P = 0.8). Intake of IMS was higher in 1980 (P < 0.0005) and higher in the high social groups (P < 0.0005): there was a fall of 25% between 1980 and 2000, and the low social groups had a 20% lower intake compared with the high social groups across all three surveys.
The contribution of various dietary sources of sugars are given, as weight and percentage, in Table 4, for each survey, for all subjects combined. Tables 5 and 6 give similar data for NMES alone, for each social group and survey, for boys (Table 5) and for girls (Table 6). In 2000, the order of importance in providing total sugars was soft drinks (29% of total sugars), confectionery (18%) and biscuits and cakes (12%); milk and fruit provided 6 and 5%, respectively.
Table 4 Mean daily intake of non-milk extrinsic sugars, milk and intrinsic sugars, and total sugars from various dietary sources (as g and as percentage of sugars intake) for boys and girls, according to the year of study

Table 5 Mean daily intake of non-milk extrinsic sugars from various dietary sources (as g and as percentage of non-milk extrinsic sugars intake) for boys only, by social group and year of study

Table 6 Mean daily intake of non-milk extrinsic sugars from various dietary sources (as g and as percentage of non-milk extrinsic sugars intake) for girls only, by social group and year of study

Turning to NMES, the order of importance in the 2000 survey was: soft drinks (31 g of sugars, 38% of NMES), confectionery (19 g of sugars, 23% of NMES) followed by biscuits and cakes (12 g, 15%). Thus, soft drinks and confectionery together provided 50 g of sugars, which accounted for 61% of NMES and 47% of all sugars. Intake of sugars from soft drinks doubled over the 20 years (P < 0.05). On the other hand, the contribution of table sugar dropped markedly over the 20 years (P < 0.05) and there were declines in the comparatively minor sources such as sweet puddings, and syrups and preserves. Conversely, the contribution of breakfast cereals to NMES has increased steadily to reach 7 g day− 1 (9%) in 2000. Confectionery was the most important source of NMES in 1980 and 1990, providing 24 and 30 g of NMES per day, respectively, but its contribution declined in 2000, although it remained an important source.
Intakes of IMS were dominated by milk, fruit and sweet puddings. The decrease in lactose (data not shown) over the 20 years is a reflection of decreased milk intake. Fruit intake was also higher in 1980 than in the later surveys.
Some differences in the relative importance of the various sources of NMES were observed between sexes and social groups (Tables 5 and 6). The increasing importance of breakfast cereals as a source of NMES was more marked in the boys (11% in 2000) than in the girls (7% in 2000). On the other hand, the increasing importance of soft drinks and the decreasing contribution of table sugar were observed equally in boys and girls. Table sugar contributed more to NMES intake in the low social groups in both boys and girls. Conversely, soft drinks and breakfast cereals were less important sources in the low social group boys and girls than for high social class children.
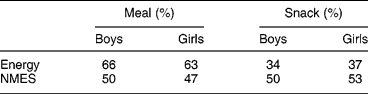
Because of the importance of soft drinks and confectionery to the sugar intake of these young adolescents, the proportions which came from home, school, etc., were determined (Table 7). While the child's home was the most important source of all major sources of NMES, especially of table sugar (e.g. added to tea or coffee and breakfast cereal), sources outside the child's home were important sources of confectionery, soft drinks, biscuits and cakes. School meals were significant sources of biscuits, cakes and soft drinks, while ‘other sources’, for example purchased by the subject in shops, were significant sources of confectionery and soft drinks. There was little difference between boys and girls (Table 7). Snacks provided about a third of daily energy intake, and half of NMES, indicating that snacks were NMES-rich (Table 8).
Table 7 Place of purchase of the main sources of non-milk extrinsic sugars (2000 survey)
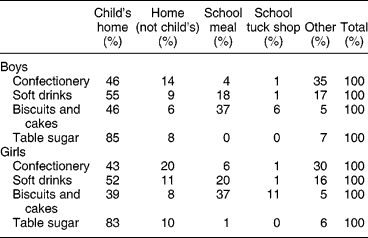
Table 8 Percentage contribution to energy and percentage energy from non-milk extrinsic sugars (NMES) for meals and snacks (2000 survey)
Discussion
The main finding from these repeated cross-sectional surveys of Northumbrian adolescents spanning 20 years was that consumption of NMES remains high in both sexes and all social groups. Only a small minority of these children achieved UK recommendations for NMES. Dietary sources of NMES have changed: soft drinks have continued to increase in importance so that soft drinks and confectionery now provide nearly two-thirds of NMES.
Further details of the conduct of these studies have been provided elsewhereReference Fletcher, Rugg-Gunn, Matthews, Hackett, Moynihan and Mathers21, Reference Adamson, Rugg-Gunn, Butler, Appleton and Hackett22, Reference Hackett, Rugg-Gunn, Appleton, Eastoe and Jenkins38. The subjects were from the same school year, attending the same seven schools, in all three surveys, and considerable care was taken to ensure uniformity of methods. It should be noted that only about two-thirds of eligible children completed each study, but this figure compares favourably with a recent national survey for this age group (64%)Reference Gregory and Lowe5.
The ratio of measured energy intake to estimated basal metabolic rate decreased from ~1.60 in 1980, to 1.54 in 1990, and to 1.38 in 2000. This decline must lead to questioning the validity of the method used, and this issue is discussed more fully elsewhereReference Fletcher, Rugg-Gunn, Matthews, Hackett, Moynihan and Mathers21. Other recent UK surveysReference Gregory and Lowe5 have quoted similar values and, as in the national survey, it was decided to include all children in this report. Either children are systematically more likely to under-report intake now compared with 20 years ago, or energy intake has genuinely fallen, reflecting a decline in physical activity.
Classification of occupational class has changed substantially over the 20 years to reflect changes in society in the UK. We were fortunate to have the assistance of the Occupational Information Unit of the Office of National Statistics, London, who ensured the best comparability across surveys by classifying our subjects into high, middle and low social groups. The shift in the distributions between surveys is a reflection of changes in society at large. Classification of subjects using post code data in 2000 showed that the social profile of our subjects was similar to that of Northumberland countyReference Fletcher, Rugg-Gunn, Matthews, Hackett, Moynihan and Mathers21.
Values for NMES (and IMS) have yet to be added to UK food composition tables. This has resulted in a variety of classifications being used in surveys since the term was proposed 15 years ago1. These classifications have been reviewed by Kelly et al.Reference Kelly, Moynihan, Rugg-Gunn and Summerbell32 who compared the three main methods, including that used in this studyReference Rugg-Gunn, Adamson, Appleton, Butler and Hackett19. Kelly et al.Reference Kelly, Moynihan, Rugg-Gunn and Summerbell32 noted that none of the methods had been reported well enough to allow replication and, in response to this, a fuller description of our method is given in the Appendix.
The total daily sugar intake in the 2000 study was 116 g in boys and 102 g in girls, comparable with results from the UK NDNSReference Gregory and Lowe5 – 122 and 99 g, respectively, for the 11–14 year age group. Higher intakes of total sugars were reported by Strain et al.Reference Strain, Robson, Livingstone, Primrose, Savage and Cran6 in their 1990–91 Northern Ireland survey of the diets of 12-year-olds, i.e. 139 and 121 g in boys and girls, respectively. Energy intakes (11.0 and 9.2 MJ) in Northern Ireland were higher than recorded in our surveys, so that ~21% of energy came from total sugars in both the Northern Ireland and our Northumberland surveys. These are lower values than reported for similarly aged young adolescents in New Zealand (26% of energy)Reference George, Brinstone, Paulin and Aitkin11 and the USA (28% of energy)Reference Nicklas, Myers, Beech and Berenson39.
Consumption of NMES in our 2000 study was very similar to values in the NDNS report for 11–14-year-oldsReference Gregory and Lowe5: for boys, our survey 87 g (16% energy), NDNS 90 g (17% energy); for girls, our survey 76 g (16% energy), NDNS 73 g (16% energy). There appear to be no other UK data for young adolescents. Making the assumption that ‘added’ sugars equate roughly to NMES (discussed by Rugg-Gunn et al.Reference Rugg-Gunn, Adamson, Appleton, Butler and Hackett19), some international comparisons are possible. In the USAReference Munoz, Krebs-Smith, Ballard-Barbish and Cleveland7, 16–17% of food energy was reported to come from added sugars, while Guthrie and MortonReference Guthrie and Morton40 reported that ‘added sweeteners’ provided a higher proportion at 20% energy. Consumption of ‘simple sugars’ was reported to be 77–87 g day− 1 (17% energy) in 10- to 12-year-old CanadiansReference Shatenstein and Ghadirian10. In Germany, it was reported that added sugars provided 13Reference Alexy, Sichert-Hellert and Kersting15 and 14%Reference Kersting, Sichert-Hellert, Alexy, Manz and Schoch9 of energy in children and adolescents, while in Denmark the corresponding value was 14% energyReference Lyhne and Ovesen8. Subject to the problem of different definitions, it is concluded that values for consumption of NMES by UK young adolescents is in the middle of the range of values from these international comparisons. This is of some comfort given that the diets of UK adolescents are claimed to be amongst the worst in EuropeReference Hackett, Gibbon, Stretton and Hamill41.
There are few data with which to compare our values for IMS. These were reported by NDNSReference Gregory and Lowe5 and their results for 11–14-year-olds were similar to our 2000 results: boys, NDNS 31 g, Northumberland 29 g; girls, NDNS 26 g, Northumberland 26 g. The Department of Health2 recommended that starch, intrinsic and milk sugars should together provide >37% of food energy. In our 2000 study, this value was 36% in boys and 37% in girls. These values are close to those recorded in the NDNSReference Gregory and Lowe5 for 11–14-year-olds – 35% in boys and girls – but both are slightly less than recommended.
Soft drinks and confectionery provided 61% of NMES and nearly half of total sugars in our 2000 survey. The comparable figures in the NDNSReference Gregory and Lowe5 were 55% of NMES and 42% of total sugars. Similar findings have been reported by CrawleyReference Crawley42 in the UK, Strain et al.Reference Strain, Robson, Livingstone, Primrose, Savage and Cran6 in Northern Ireland, Guthrie and MortonReference Guthrie and Morton40 in the USA and by George et al.Reference George, Brinstone, Paulin and Aitkin11 in New Zealand. They all highlight the dominance of soft drinks and confectionery as sources of dietary sugars in this age group. In the Northern Ireland surveyReference Strain, Robson, Livingstone, Primrose, Savage and Cran6, cakes, biscuits confectionery and beverages, provided 28% of total energy intake. In our 2000 study, 52% of NMES came from ‘snacks’ (and 48% from ‘meals’). Similar patterns, of a disproportionate amount of NMES contained in snacks, were reported by De Henauw et al.Reference DeHenauw, Wilms, Mertens and DeBacker43 in Belgian 10–12-year-olds (37% of free sugars and 20% of energy), by George et al.Reference George, Brinstone, Paulin and Aitkin11 in New Zealand 10–11-year-olds (50% of sugars and 31% of energy) and by Bergstrom et al.Reference Bergstrom, Hernell and Persson44 in Swedish 14-year-olds (60% of sucrose and 30% of energy in ‘light meals’).
Results from our studies are consistent with other published data for economically advanced countries showing that young adolescents consume substantially more NMES than is recommended, that these predominate in snack foods and that soft drinks and confectionery are the most important sources. The main reason for recommending low consumption of NMES is to prevent dental caries. From the perspective of promotion of oral health, it is frustrating that the main sources of NMES are foods/drinks which are easy to consume frequently, as it is known that the occurrence of dental caries is related to both the amount and frequency of NMES consumption1, Reference Rugg-Gunn, Adamson, Appleton, Butler and Hackett19. The dental health of young people in the UK has improved considerably, but is still a major health burden, being among the most expensive diseases in the UKReference Rugg-Gunn45. Diet remains an important determinant of oral health or disease, with NMES almost exclusively the dietary cause of dental cariesReference Rugg-Gunn46–Reference Sheiham49.
A welcome fall in the percentage of energy from fat was observed in our 2000 study compared with the two previous studiesReference Fletcher, Rugg-Gunn, Matthews, Hackett, Moynihan and Mathers21: it fell from 40% in 1980 and 1990 to 35% in 2000. This was wholly compensated for (in percentage terms, as energy intake also fell) by a rise in starch consumption, in line with recommendations2. Thus, there was a welcome fat–starch see-saw and not an undesirable fat–NMES see-saw. The same pattern was observed in the German series of repeated cross-sectional studies of young adolescentsReference Alexy, Sichert-Hellert and Kersting15 where the fall in energy from fat (from ~38 to 36%) was compensated for by a rise in starch consumption; sugar consumption remained constant. Thus, a decline in fat intake is not inevitably accompanied by a rise in intake of NMES.
The present study has shown that the school meal was a substantial contributor to NMES intake, with biscuits and cakes and soft drinks being the main sources of NMES in these meals. This highlights a need to ensure that school food policies adhere to nutritional guidelines by providing no more than 10% of energy from NMES through restriction of rich sources of NMES.
Our surveys also showed a rise in body mass index over the 20 yearsReference Fletcher, Rugg-Gunn, Matthews, Hackett, Moynihan and Mathers21. There has been considerable debate over the role of NMES in promoting obesity1, 4. Hill and PrenticeReference Hill and Prentice50 found no association between high consumption of sugars and obesity; however, in a prospective, observational study of 548 American 11–12-year-oldsReference Ludwig, Peterson and Gortmaker51, a positive association was found between consumption of sugar-containing drinks and obesity, after adjustment for anthropometric, demographic, dietary and lifestyle variables. More recently, a school-based intervention was reported to be successful in reducing carbonated drinks consumption and the prevalence of obesityReference James, Thomas, Cavan and Kerr52. Soft drinks consumption not only contributes to a high NMES intake and potentially obesity, but may also lead to displacement of milk from the diet. This is of concern as adolescence is a critical time for bone development4. Due to potential benefits to both oral and systemic health, school policies that prohibit soft drinks and promote consumption of milk and water should be encouraged.
There are some signs of improved food choice by adolescents. Johnson and HackettReference Johnson and Hackett53 noted an increased awareness of healthy eating messages in young adolescents in Liverpool, and Inchley et al.Reference Inchley, Todd, Bryce and Currie13 reported increased fruit and vegetable consumption among young Scottish adolescents. Data compiled by Vereecken and MaesReference Vereecken and Maes54 suggest that the diets of adolescents in the UK are amongst the worst in Europe with, for English 11-year-olds, only 63% of boys and 70% of girls claiming to eat fruit every day. Furthermore, a recent large-scale study in Liverpool found that 23% of primary and 26% of secondary children did not report eating fruit or vegetables on the day of the surveyReference Hackett, Gibbon, Stretton and Hamill41. A national intervention to increase whole fruit consumption in school is to be welcomed as, if this substitutes for snack foods high in NMES, it is likely to improve oral as well as general health.
Improving the nutritional quality of snack foods and ensuring that these are attractive to young people is a high priority. High-sugar/high-fat snack foods are aggressively advertised to children in the UK and abroadReference Wilson, Quigley and Mansoor55. One survey which monitored 40 h of commercial television found 95% of the adverts to be for products high in fat and/or sugar and/or salt, but fruit and vegetables were not advertised at all56. There is a relationship between television food advertisements recalled by children and their consumption of these foodsReference Hitchings and Moynihan57. Food choice is the result of an interaction between many factorsReference Shepherd58 but, as Inchley et al.Reference Inchley, Todd, Bryce and Currie13 point out, a number of health promotion initiatives have shown signs of success in improving the diets of young people. There is undoubtedly need for continuing and coordinated effort if consumption, and the frequency of consumption, of NMES is to be reduced. This should involve the National Curriculum, catering in schools, the positive promotion of fruit and vegetables and curbs on advertising aimed at children.
Acknowledgements
This study was funded by a grant (no. RRCC31R) from the NHS Executive (Northern and Yorkshire Region). Further analyses were made possible by a grant from the Bradlaw Trust Fund of Newcastle University School of Dental Sciences. We are most grateful to the Northumberland Health and Education Authorities, to the staff of the seven schools, and to the children, and their parents or guardians, who participated so cheerfully. We are also most grateful to the Occupational Information Unit of the Office of National Statistics, London, for assisting us in classifying parental occupations to ensure the most appropriate comparisons with the 1980 and 1990 surveys.
Appendix – The methods used to determine non-milk extrinsic sugars (NMES) and intrinsic and milk sugars (IMS)
The method was originally based on an added and natural sugars method first developed in 1980 and which has evolved to estimate NMES and IMS. In this study, milk sugars are grouped with intrinsic sugars, and not presented separately. All NMES values were estimated as g 100 g− 1.
General guidelines
Added sugars – all sugars added to foods and drinks are classified as NMES (including added lactose e.g. in dried soups).
Naturally occurring lactose – was classified as IMS except in chocolate (see below).
Products containing flour or grains (e.g. cakes, biscuits and breakfast cereals) – the natural (IMS) sugars component of these foods was estimated to be 0.4 g 100 g− 1. For such products which do not contain any added/contain traces of sugars, e.g. bread, the NMES content is zero. For products which contain added sugars, e.g. cakes and biscuits, natural (IMS) sugar is subtracted from total sugars to provide a value for NMES.
Food types
Fruit juices and soft drinks – all sugars from fruit in fruit juices classified as NMES (i.e. all sugars in fruit juices and soft drinks are NMES as they are derived from fruit or are added sugars).
Dried fruit – all sugars are classified as IMS.
Jams/pie fillings – all fruit sugars are classified as IMS, and added sugars are classified as NMES.
Canned fruit – Added sugars or sugar from syrup or juice NMES, sugars from fruit was classified as IMS.
Fruit yoghurts – all sugars from fruit were classified as IMS, lactose IMS, added sugars were classified as NMES.
Sweetened yoghurts – added sugars were classified as NMES, all other sugars were classified as IMS.
Bread (unsweetened) – all sugars were classified as IMS.
Breakfast cereals – natural sugars were classified as IMS, added sugars were classified as NMES.
Biscuits – natural sugars were classified as IMS, added sugars were classified as NMES.
Pizza, curry, lasagne, casserole, stews – all sugars were classified as IMS.
Chocolate – all sugars (including lactose in milk chocolate) were classified as NMES (applies to confectionery and biscuits, but not chocolate ice creams).
Ice cream – non-dairy ice cream all lactose was classified as IMS, added sugars were classified as NMES. Any added lactose was classified as NMES. In choc ices, all lactose was classified as IMS (including that in milk chocolate).
Baked foods with milk component – lactose and natural sugars were classified as IMS.
Puréed foods and sauces – all sugars were classified as NMES (except mashed potato). If milk based, lactose was classified as IMS.
Soups – lactose in cream soups was classified as IMS, other sugars were classified as NMES.
Baked beans –all sugars were classified as NMES.
Nuts (including ground/puréed nuts) – all sugars were classified as IMS.
Notes
1 Where a recipe for a food product is given in the food tables, this was used as the source of composition data. If this was not available, the food label or food composition information from the manufacturer was used. In a number of cases, food dissection was carried out, e.g. to estimate the proportion of raisins in a fruit loaf or the relative proportions of fruit and syrup in canned fruit.
2 In recipe dishes which incorporate eggs, the weight of an egg was taken as 50 g (standard portion size).
3 In recipe dishes where weight was lost on heating or cooking, the recipes were not adjusted for weight loss and proportions were used as printed in the recipe.


