


Being aware that dietary data are very prone to measurement errors, nutrition researchers have a long tradition of performing methodological studies to assess the performance of their data collection instruments. A high number of methodological studies have been published, with many being listed in the Dietary Assessment Calibration/Validation Register1 developed and maintained by the US National Cancer Institute.
Unfortunately, although the overall purpose of methodological studies is to provide more valid data for dietary intake assessment or for diet–disease analyses, the results from methodological studies are usually not implemented when analysing data in the main study. Rather, it is left to the reader to try to figure out what the results would be like if the findings had been implemented in the analysis.
Methodological studies should be designed so as to facilitate implementation of the findings in later analysis. Unfortunately, many methodological studies are small and performed in a sample outside the main study, or in a particular sub-sample of the study. The findings may therefore not be representative for the entire study, and the effect of implementing the findings in the analysis may be weakened.
Within the Norwegian Women and Cancer Study (NOWAC) we have undertaken a project aimed to implement methodological issues in follow-up analyses of cancer and diet. In this paper we present data from the first step: comparing food and nutrient intake registered by the NOWAC food-frequency questionnaire (FFQ) with intake registered from four repeated 24-hour dietary recalls (24HDRs) conducted in a random sub-sample of the main study. NOWAC has been part of the European Prospective Investigation into Cancer and Nutrition (EPIC) since 1998, and with the present work all 10 EPIC countries have performed studies on the relative validity of the dietary dataReference Tjønneland, Overvad, Haraldsdottir, Bang, Ewertz and Jensen2–Reference Johansson, Hallmans, Wikman, Biessy, Riboli and Kaaks4.
Methods
Study population and design
NOWAC is a nationwide cohort study including 102 443 women born from 1927 to 1965, randomly drawn from the National Central Person RegisterReference Lund, Kumle, Braaten, Hjartåker, Bakken and Eggen5, 6. The participants were enrolled from 1991 to 1997, and have completed one or more postal questionnaires, including questions on diet.
For the present study, 500 randomly selected women who answered their first questionnaire in 1991–1992 and a second questionnaire in 1998 were in March 2002 inquired to give more detailed information about their diet through repeated 24HDRs. The 24HDR was chosen as reference method as it, via telephone, enabled us to include women from all over the country. As a reward for completing all four interviews the participants were offered to participate in a lottery of 20 subscriptions for a weekly magazine for half a year. After two reminders 286 women agreed to participate (57%) and 283 women completed all four 24HDRs. The women who completed all the recalls were subsequently (in 2003) requested to fill in a third questionnaire asking about dietary intake during the preceding year and so covering the same time period as the recalls. No reminders were sent. A total of 238 women returned the questionnaire.
The study was approved by the Regional Committee for Medical Research Ethics and the Norwegian Data Inspectorate.
The FFQ (test method)
A detailed food-frequency section has been included in the NOWAC questionnaires since 1996. The FFQ applied in the current study includes 85 frequency questions and aims to record habitual consumption of the following food items (number of questions in brackets): coffee (3), milk (4), orange juice (1), syrup and soft drinks (2), yoghurt (1), cereals (1), bread (4), sandwich spreads (9), fruits (4), vegetables (7), potatoes (1), pasta (1), rice (1), rice porridge (1), fish and fish products (14), condiments and sauces for fish (5), meat and meat products (9), eggs (1), cakes and sweet pastries (6), desserts (3), ice cream (1), chocolate (1), salty snacks (2) and alcoholic beverages (3). It also includes a question about type of fat used on bread and for cooking. For some food items (e.g. fish, ice cream) seasonal variation in consumption is asked for. The subjects are asked to record their average consumption of each food item during the last year. Four to seven frequency choices are given for each food item, with response intervals adjusted to the food item in question (e.g. never/seldom, 1–3 times per month, once per week, twice per week, 3 times per week, 4–5 times per week, 6–7 times per week). Consumption of some food items is asked as consumption frequency of a certain amount (27 questions, e.g. glasses of milk) or in natural units (five questions, e.g. oranges). For other foods specific questions on portion size (in natural units, household units or decilitres) (30 questions) are given. For the remaining foods (23 questions) standard portion sizes are assigned. The weights of the portion units are mainly derived from a Norwegian weight and measures table7.
Daily intakes of foods, energy and nutrients were computed using a computation program developed at the Institute of Community Medicine, University of Tromsø, for SAS software. Season-specific frequencies were transformed into average frequencies over the whole year. Missing frequencies were treated as null intake and missing portion sizes as the smallest portion unit in the questionnaire, giving a conservative intake estimate. Median number of unanswered frequency questions was four (range 0–45) of a total of 85 questions. The recorded frequency was multiplied by the recorded portion size or a standard portion, and transformed into daily food intake in grams. For the food analysis, 21 food groups were defined. For the energy and nutrient calculations, frequency questions asking about more than one food item (e.g. ‘How often do you eat apples/pears?’) were split into single foods according to frequency weights (e.g. 80% apples and 20% pears) derived from 1798 single 24HDRs conducted in a random sample of NOWAC as part of the EPIC calibration studyReference Slimani, Kaaks, Ferrari, Casagrande, Clavel-Chapelon and Lotze8. Type of fat used on bread was taken into account in the nutrient calculations, but not fat in cooking due to restrictions in the computation program. Dietary supplements, including cod-liver oil, were not included in the calculations. Nutrient values were derived from the Norwegian food composition table9.
Parts of the questionnaire have formerly been evaluated against serum phospholipid fatty acidsReference Hjartåker, Lund and Bjerve10, and the reproducibility has been examined in a separate studyReference Parr, Veierød, Laake, Lund and Hjartåker11.
The 24HDR (reference method)
The 24HDRs were performed via phoneReference Brustad, Skeie, Braaten, Slimani and Lund12 by applying the highly standardised computer program EPIC-SOFTReference Slimani13. EPIC-SOFT was developed by the International Agency for Research on Cancer in collaboration with the 23 centres included in EPIC. To facilitate estimation of amounts consumed, a picture book with coloured photos was developed along with EPIC-SOFT. A country-specific version of the program exists for each participating country. The Norwegian version of EPIC-SOFT has a database with more than 1600 foods and nearly 70 recipes, and the Norwegian picture booklet contains 55 sets of photos/drawings. During the interviews the participants give a very detailed description of food consumption the previous day. The amount consumed by the subjects is quantified by means of the photographs, standard units, household measures or exact amounts (grams or millilitres), if known by the subject. An interview takes approximately 30 min.
Four interviewers at the University of Oslo and six at the University of Tromsø performed the interviews. About half of them had a nutritional background. All the interviewers were carefully trained by the nutritionist who had been in charge of the Norwegian version of EPIC-SOFT (D.E.). During the data collection period the interviewers were encouraged to ask for help whenever needed, and frequent feedback on their interviews was given from the nutritionist in charge of the validation study (A.H.). The same nutritionist also edited all the interviews. To reduce the risk of any systematic bias in the 24HDR data related to interviewer or interview centre, an alternation system was established to make sure that all participants were interviewed from both the Tromsø and the Oslo centre and by different interviewers at each centre.
To cover any seasonal variation in dietary habits each participant was interviewed once every season, with the calendar year divided into ‘winter’ (December–January–February), ‘spring’ (March–April–May), ‘summer’ (June–July–August) and ‘autumn’ (September–October–November). Further, the participants were divided into three groups: A, B and C. Participants in group A gave their first recall interview during spring and their last during winter, participants in group B gave their first during summer and their last during spring, and participants in group C gave their first interview during autumn and their last during summer. The recall interviews started in May 2002 and were completed by the end of August 2003. Five interviews were not conducted within the correct season, but were postponed to the next season. The main reasons for the displacement were that the participants were not reachable (e.g. long-term stay abroad) or they were too busy to complete the interview within the correct season. Considerable efforts were also made to ensure that each participant was interviewed on various days of the week, including a weekend day, and that the overall distribution of interviews was balanced throughout the days of the week.
Two women withdrew after completing one and two interviews, respectively; one woman was not reachable after the second interview; and three interviews were lost for unknown reasons during data handling. Of a total of 1144 possible interviews (286 × 4), the final number of interviews was therefore 1134. For the present analysis only the interviews of the 238 women returning the FFQ after completing the interviews are included. As two of the lost interviews were within this sub-sample, the final number of interviews in our analysis is 950.
As for the FFQ, computation programs with linkages to the Norwegian food composition table9 were developed for calculating daily intakes of food, energy and nutrients for the interviews. For food calculations, food items prepared with fat (e.g. fried potatoes) were treated as gram of the prepared food (gram fried potatoes) and not as gram food item plus gram fat. Mixed dishes (e.g. casseroles) were treated as gram of the dish and not as its ingredients. To reduce the high number of different food items (3812) registered in the 24HDRs, the registered foods were pooled in a three-step procedure. First, fairly similar food items were grouped together (1415). Next, the foods were grouped together to parallel each single question in the FFQ (85), and finally to parallel the 21 food groups defined for the FFQ. For the energy and nutrient calculations, prepared foods were split into raw food plus preparation fat if relevant, and mixed dishes were split into their ingredients. This procedure is opposite to how we treated prepared and mixed foods when calculating food intake, and is due to the relatively small number of prepared foods and mixed dishes in the current Norwegian food table. Cod-liver oil and other dietary supplements were not included in the nutrient calculations.
Background information
The FFQ applied in the current study did not ask for background information. Rather the background data (e.g. weight, height, physical activity) refers to information collected in 1998.
Statistical analysis
Background information is presented as means and standard deviations (SDs), as the distribution of these variables showed sufficiently normality. Food and nutrient intake data are presented as medians and 25th and 75th percentiles, as the distribution of these variables was generally skewed against higher values. For the 24HDRs the mean of the completed recalls was computed. The Wilcoxon signed rank test was applied to test for statistically significant differences in the dietary intakes calculated from the FFQ and the repeated 24HDRs. Agreement between the two methods was also visualised by difference-against-mean plots as proposed by Bland and AltmanReference Bland and Altman14, i.e. the difference in intake between the two methods (24HDR − FFQ) is plotted against the mean intake of the two measures ((24HDR+FFQ)/2). So-called ‘limits of agreement’, defined as mean ± 1.96 SD, are added to the plots and give the range which will include the difference between single measurements on the same subjects by the two methods with 95% probability (given that the individual differences are normally distributed). Together the mean difference and the limits of agreement give an informative summary of the data. The plot is particularly useful to show the size of the difference in intake between the two methods, to reveal the relationship between the difference and the mean, to look for any systematic bias, and to identify possible outliers. Spearman's correlation coefficient was calculated to examine to what extent individuals were ranked similarly with the FFQ and the 24HDRs, and cross-classification tables were made to examine the degree of misclassification when dividing the subjects into quintiles of intake. To get a first idea of how the FFQ data would perform in risk analyses, we calculate the so-called calibration coefficient (λ) by regression of the 24HDR data (dependent variable) on the FFQ data (independent variable) in linear regression models. In certain situations the calibration coefficient can be used to correct risk estimates for measurement errors by raising the risk estimate to the power of one over the coefficient. The assumptions of the linear regression model were examined by residual plots. All reported P-values are two-sided, and a significance criterion of P < 0.05 was used. Statistical analyses were done by means of the SAS software package (version 9.1; SAS Institute), whereas plots were made in SPSS (version 13.0; SPSS Inc.).
Results
Some background characteristics of the women who were invited and those who completed the study are given in Table 1. As can be seen, there were only minor differences between the groups. This applies also to the food and nutrient intakes as reported in 1998 (only selected variables shown in table).
Table 1 Description of the subjects invited and the subjects completing the present study, recorded in 1998

SD – standard deviation; BMI – body mass index; P25 – 25th percentile; P75 – 75th percentile.
† Subgroups may not total to 500 and 238, respectively, due to item non-response.
Weekday distribution and reporting of special days and diets in the 24HDRs
Some 18% of the interviews (174/950) were Monday diet recalls (i.e. conducted on a Tuesday) and 11% of the interviews were Thursday diet recalls (i.e. conducted on Fridays). For the other days of the week the proportion of interviews was closer to the ideal 14.3%.
In each 24HDR the participant was asked whether she regarded the previous day as a special day concerning the diet, and whether or not she was on a special diet at the moment. Some 26% of the recalls (247/950) were regarded by the participants as a special day; the most frequent reasons being celebrations (7% of all recalls) and travelling (6%). Being on a special diet was reported in 11% of the recalls; the most frequent conditions being allergy (3%) and obesity (3%). Having a vegetarian diet was reported in eight recalls and having a diet affected by diabetes was reported in five recalls.
Food intake
The women reported higher intakes of milk and yoghurt, coffee, soft drinks and syrups, jam and sweet spread, cakes and sweet pastries, chocolate and alcoholic beverages in the 24HDRs than in the FFQ (Table 2). The reported intakes of fruits, vegetables, potatoes, rice and pasta, rice porridge, and fish and fish products were lower in the recalls than in the FFQ, whereas no statistically significant differences were seen for intakes of orange juice, bread and cereals, cheese, meat and meat products, eggs, ice cream, desserts and salty snacks. Spearman's rank correlation coefficients between food intake from the FFQ and the 24HDRs ranged from 0.13 for desserts to 0.82 for coffee (Table 2). The median correlation coefficient was 0.41. The calibration coefficient was below 1 for all foods, except for alcoholic beverages and coffee (Table 2). Only milk and yoghurt had a calibration coefficient not significantly different from 1.
Table 2 Daily intakes (g) of different food items from the FFQ and the 24HDRs, Spearman's rank correlation coefficient (r ) between the measurements (95% Cl) and the calibration coefficient (λ) (95% Cl), n=238

FFQ – food-frequency questionnaire; 24HDR – 24-hour dietary recall; CI – confidence interval; P25 – 25th percentile; P75 – 75th percentile.
*P ≤ 0.05, **P ≤ 0.01, ***P ≤ 0.001.
† Intake from the 2003 FFQ compared with intake from the repeated 24HDRs in 2002–2003 by means of Wilcoxon signed rank test.
‡ λ could not be calculated, as the assumptions of the regression model were not met.
Proper cross-classification tables could not be constructed for most foods because of non-reporting in the 24HDRs and clustering around some answering alternatives in the FFQ. Still, quintile cross-classification could be done for some important food groups with the following results (same and extreme quintile, respectively): fruit (39%, 2%), vegetables (26%, 1%), fish and fish products (22%, 4%), meat and meat products (26%, 4%), cakes and sweet pastries (30%, 5%). Non-reporting of alcoholic beverages was frequent in the recalls (n = 84). After excluding these women and additionally two women who had a calculated intake of alcohol of 0 in the FFQ, the corresponding figures for alcohol were 24% and 1%.
Energy and nutrient intakes
Acknowledging that the FFQ does not cover the entire diet, we also compared the energy and nutrient intakes calculated from the two methods. The FFQ gave lower intakes of energy and all macronutrients, except protein, than the 24HDRs (Table 3). As for nutrient densities, energy from fat, added sugar and alcohol was lower by the FFQ, whereas fibre density was higher. Intakes of β-carotene and vitamin D were higher in the FFQ than in the recalls, while intakes of calcium and iron were lower in the FFQ. After adjusting for energy intake the difference in calcium disappeared, whereas vitamin C and iron intakes became higher in the FFQ data than in the recall data (details not shown).
Table 3 Daily intakes of energy and nutrients from the FFQ and the 24HDRs, Spearman's rank correlation coefficient (r ) between the two measurements (95% Cl) and the calibration coefficient (λ) (95% Cl), n=238

FFQ – food-frequency questionnaire; 24HDR – 24-hour dietary recall; CI – confidence interval; P25 – 25th percentile, P75 – 75th percentile.
*P ≤ 0.05, **P ≤ 0.01, ***P ≤ 0.001.
† Intake from the 2003 FFQ compared with intake from the repeated 24HDRs in 2002–2003 by means of Wilcoxon signed rank test.
Spearman's correlation coefficients between energy and nutrient intakes from the FFQ and the 24HDRs are presented in Table 3. The correlation coefficients ranged from 0.25 for β-carotene and α-tocopherol to 0.67 for alcohol, with a median coefficient of 0.34. The correlation coefficients for macronutrients increased when the intake was adjusted for energy intake (ranging from 0.43 for % energy from protein to 0.68 for % energy from alcohol), whereas for the micronutrients some coefficients became higher and some became slightly lower (ranging from 0.26 for β-carotene/MJ to 0.53 for vitamin C/MJ) (details not shown). Median correlation coefficient for energy-adjusted nutrients was 0.43. The calibration coefficient varied widely between the nutrients, from 0.18 for β-carotene to 1.64 for alcohol (Table 3). Only alcohol had a calibration coefficient above 1. The coefficient closest to 1 was found for added sugar (λ = 0.79).
To examine to what extent the FFQ data and the 24HDR data were likely to agree for an individual, as well as for average intake, Bland–Altman plots with limits of agreement were constructed (Table 4 and Fig. 1). Most of the mean differences were positive, i.e. a higher intake was reported in the 24HDRs than in the FFQ. The limits of agreement were wide for most nutrients and ranged from positive to negative values, implying that the women both under- and overestimated their dietary intake with the FFQ compared with the 24HDRs. Roughly, three different patterns were seen in the plots: (1) no relationship between differences and mean values (e.g. energy, carbohydrates) (Fig. 1a), meaning that the agreement between data from the 24HDRs and the FFQ is of the same magnitude irrespective of intake quantity; (2) a wider scatter with increasing mean values (e.g. fibre, iron) (Fig. 1b), i.e. the standard deviation of the differences increases as the intake quantity increases, meaning that the agreement between the two methods worsens as the intake quantity increases and that the errors are somewhat proportional to the intake; and (3) increasing positive differences with increasing mean values (e.g. alcohol, added sugar) (Fig. 1c), meaning that, compared with the 24HDRs, the FFQ underestimates the intake more and more as the intake quantity increases.
Table 4 Mean differences and limits of agreement between daily intakes of energy and nutrients from the 24HDRs and the FFQ, n=238

24HDR – 24-hour dietary recall; FFQ – food-frequency questionnaire; SD – standard deviation.
† 24HDR − FFQ.
‡ Mean difference ± 1.96 SD of the difference.

Fig. 1 Differences in daily intake of energy (a), fibre (b) and alcohol (c) estimated with 24-hour dietary recalls (24HDRs) and the food-frequency questionnaire (FFQ) (24HDR − FFQ), plotted against the mean daily intake of energy (a), fibre (b) and alcohol (c) estimated by the two methods [(24HDR+FFQ)/2]. Mean difference and 95% limits of agreement included, n = 238
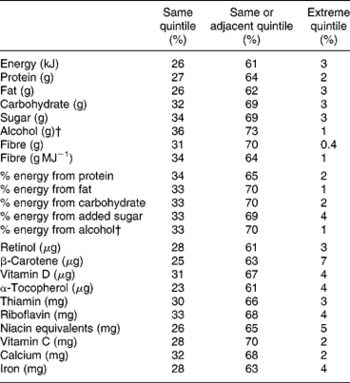
The percentage of subjects classified into the same quintile by the two methods varied from 23 for α-tocopherol to 34 for added sugar, fibre density and % energy from protein (Table 5). The median was 31%. Some 3% of the observations (152/4498) were misclassified into the extreme quintile. Alcohol was not included in these analyses due to the high number of women with no consumption. After excluding women with zero alcohol intake, 33% to 36% were classified in the same quintile of alcohol intake by the two methods and 1% were classified into the extreme quintile.
Table 5 Classification of subjects into quintiles according to calculated intake from the FFQ and the mean of the four repeated 24HDRs, n=238
FFQ – food-frequency questionnaire; 24HDR – 24-hour dietary recall.
† Among alcohol-reporters only, n = 152.
Discussion
The present analyses show that the FFQ applied in the NOWAC study performed well in estimating intake of a number of food items compared with intake estimated by repeated 24HDRs, but also that the questionnaire may overestimate the consumption of some foods and underestimate the intake of others. These findings are naturally reflected in the calculated nutrient intakes. The relative validity of the questionnaire in terms of ranking individuals is, not surprisingly, better for specific foods that are consumed frequently than for foods eaten less often. Also, the somewhat weaker ability for ranking individuals according to nutrient intake may not be surprising, as the FFQ does not cover the entire diet.
Overall, the relative validity of our FFQ is within the range observed in other EPIC cohortsReference Tjønneland, Overvad, Haraldsdottir, Bang, Ewertz and Jensen2–Reference Johansson, Hallmans, Wikman, Biessy, Riboli and Kaaks4. In EPIC, six countries followed a common validation procedure with up to 12 repeated 24HDRs as reference data, whereas the remaining three countries performed validation studies using other designs. The ability to rank individuals varied widely both for nutrients and for foods, but also between countries. For instance, Pearson's correlation coefficient for β-carotene ranged from 0.16 for Greek women to 0.81 for French women. For foods, an average Spearman's correlation coefficient has been calculated for six of the countries (including both sexes) ranging from 0.37 for fish to 0.68 for dairy products and 0.79 for alcoholic beveragesReference Margetts and Pietinen3. The relative validity of our questionnaire is also comparable to that of FFQs used in other large cohort studies, such as the Nurses' Health StudyReference Willett, Sampson, Stampfer, Rosner, Bain and Witschi15 and the Multiethnic Cohort StudyReference Stram, Hankin, Wilkens, Pike, Monroe and Park16, while other FFQs have yielded somewhat better resultsReference Subar, Thompson, Kipnis, Midthune, Hurwitz and McNutt17.
The dietary data collected in NOWAC are primarily to be used in follow-up analysis of diet and cancer, and for this purpose adequate ranking of subjects are more important than estimation of absolute dietary intake on the group level. Some of the variables (e.g. coffee, alcoholic beverages) in our study had a high rank correlation coefficient, whereas for others the rank correlations coefficients were moderate or low. In any case, use of correlation coefficients for examining relative validity has been questionedReference Bellach18. An option that should be of great interest is the construction of cross-classification tables, since risk estimation in nutritional epidemiology is usually performed on categorised variables and special attention is given to subjects with a low or a high intake of the variable in question. In this respect, only 1–2% of the women in our study were grossly misclassified with regard to important food groups like fruit, vegetables and alcohol, i.e. categorised in the highest quintile when applying 24HDR data and in the lowest quintile when applying FFQ data, or vice versa. As for nutrient intakes, < 1 to 7% of the subjects were grossly misclassified. To get a rough impression of how the measurement errors in the FFQ could influence risk estimates, we calculated the so-called calibration coefficient. In a very simplified situation with only one dependent variable in the regression model and random errors in the FFQ and the 24HDR data not being correlatedReference Rosner, Willett and Spiegelman19, the calibration coefficient can be used to correct the observed risk estimate (e.g. odds ratio or hazard rate ratio) in the following way:
where HRRcorr is the corrected hazard rate ratio, HRRobs is the observed hazard rate ratio and 1/λ is the inverse of the calibration coefficient. This means that with λ of e.g. 0.5 and observed HRR of e.g. 1.5, the corrected HRR would be 2.25. Our example is only meant as an illustration of how important it is to correct for measurement errors. In practice, more complicated correction methods are neededReference Rosner, Spiegelman and Willett20.
To achieve adequate correction for measurement errors the reference data must be valid. The 24HDR method, taken as the reference in the current study, may well underestimate dietary intakeReference Tran, Johnson, Soultanakis and Matthews21, Reference Schatzkin, Kipnis, Carroll, Midthune, Subar and Bingham22, and the median ratio of energy intake to basic metabolic rate in the present interviews of only 1.34 (25th percentile 1.14, 75th percentile 1.53) indicates underestimation in our study as well. This emerges even though EPIC-SOFT automatically gives a warning message when low energy intakes are calculated, urging the interviewer to take the participant through the recall once more. As dietary habits may vary by season and day of the week, careful distribution of the interviews is important. In our study, practically all the participants were interviewed once every season and, although not perfect, the distribution of days of the week should not generate major distortion in the reported food intake. When excluding the interviews that were regarded by the interview subject as a ‘special day’ the median daily energy intake dropped by 290 kJ (3.6%). Not unexpectedly the most pronounced change was seen for alcohol intake, which dropped from 5.8 to 1.7 g day− 1 (median) (details not shown). However, as more than a quarter of the interviews were regarded as covering a ‘special day’, they may not be so special after all and should not be excluded when estimating ‘usual’ diet.
In addition to having valid reference data, the validation study should preferably be performed in a representative sub-sample of the main study. This is often not the case. In our study, the participants were randomly selected from the main cohort, and no major differences in age, body mass index or lifestyle variables, including diet, were seen between those invited to the study and those completing it. Furthermore, only two women actively withdrew from the study during the 24HDR collection. However, 45 of the women who completed all four recalls did not return the FFQ afterwards, and could therefore not be included in the present analysis. The 24HDR data given by these 45 women were basically the same as the recall data from the women who returned the FFQ (data not shown).
In order to cover the same time period (i.e. previous year) the participants in our study filled in the FFQ after completing the 24HDRs. This may have influenced their FFQ answers. On one hand, the participants may have become more observant of their diet during the year of interviews and thereby completed the FFQ more accurately than if no interviewing had taken place (learning effect). On the other hand, the burden of the interviews may have tired some of the participants and influenced their response to the FFQ. The fact that 45 of the women who completed all four interviews did not return the subsequent FFQ could be an indication of loss of interest or tiredness. In most of the other EPIC cohorts the test method was distributed both before and after the reference method, but with no mutual decision on which dataset to apply in the validation analysis; some have chosen the first dataset, others the second oneReference Margetts and Pietinen3. Although as many as 12 monthly 24HDRs served as the reference method, no learning effect was indicated in the Dutch and the Italian EPIC cohorts when a second FFQ was completedReference Ocké, Bueno-de-Mesquita, Goddijn, Jansen, Pols and van Staveren23, Reference Pisani, Faggiano, Krogh, Palli, Vineis and Berrino24. If available, taking the average of the first and the second FFQ could be an option. Our participants did complete an FFQ prior to the present study but this was done some 5 years before (1998), and any discrepancy between these data and the 24HDR data will comprise real dietary changes over time. Nevertheless, an evaluation of the FFQ data from 1998 with the 24HDR data from 2002–2003 (n = 286) gave largely the same results as for the FFQ data collected in 2003 (data not shown).
The differences in dietary intake registered with the 24HDR and the FFQ may be ascribed to several sources. The closed format of the FFQ necessarily entails that several foods registered with the open format 24HDR cannot be reported in the FFQ. For instance, only intake of orange juice is asked for in the FFQ, whereas consumption of 11 additional fruit juices was reported in the recalls. Such omissions should not influence the validity of the specific questions (e.g. orange juice) to any great extent, although some participants, in lack of other options, may include intake of other related, not-mentioned foods (e.g. grapefruit juice) when answering the question. Other questions in the FFQ ask about consumption of less distinct foods, which is open to personal interpretation. For instance, the question about white cheese could be understood as to include white cheese like feta, although we believe most Norwegians interpret the question as consumption of hard white cheeses (i.e. Gouda type). The selection of which reported food items in the 24HDRs should correspond to each of the questions in the FFQ, and thus be included in one of the 21 food groups, was done to the best of our judgement. Still, our decisions can be disputed. However, two alternative calculations, one based on a restrictive selection of items and one based on a liberal selection, produced only small changes in intakes of different food groups (data not shown). One exception was alcoholic beverages, for which daily median intake increased from 60 g with the restrictive selection, to 70 g with our best selection, and further to 85 g with the liberal selection. The restricted number of food items in the FFQ naturally influences the estimated intakes of energy and nutrients. For instance, there are few sugar-rich foods in our FFQ and the calculated intake of added sugar is low. It would have been interesting to compare the energy and nutrient intakes from the FFQ with figures from the 24HDRs excluding from the calculations all items not listed in the FFQ. However, such a comparison was not possible, as the calculation program for the 24HDRs does not allow for removal of certain foods.
Furthermore, the number of recalls may not have been large enough to cover the day-to-day variability in consumption of some foods. Our decision to use four repeated 24HDRs for at least 200 persons as our reference data was guided by the work of Willett and LenartReference Willett, Lenart and Willett25 combined with correlation coefficients previously calculated for our FFQReference Hjartåker, Lund and Bjerve10. Even though the recalls were performed every season and on both weekdays and weekends, the average of four recalls will give an imprecise estimate of long-time usual intake for food groups not expected to be consumed daily. This may have contributed to the low correlation coefficients observed for e.g. desserts and fish. Most likely somewhat higher correlation coefficients would be observed if day-to-day variation in the 24HDRs had been accounted for.
Data technical matters may also have contributed to the discrepancy between the 24HDR data and the FFQ data. First, some of the standard unit weights applied in the food and nutrient calculation program for the FFQ differed from those applied in EPIC-SOFT, e.g. an orange had a net weight of 140 g in the FFQ program and 150 g (medium unit) in EPIC-SOFT. Second, edible percentages of some fish species varied in the two calculation programs. This kind of difference is of course unfortunate in a comparison study. However, in EPIC-SOFT, choosing a standard unit for quantification was only one of several options and even within the standard unit option there were different choices (e.g. small, medium, large). Also, neither the standard unit weights nor the edible percentages were systematically higher/lower in any of the programs. Therefore, on the food group level, the overall effect of the differences in the two calculation programs is likely to be small. Missing values on frequency questions in the FFQ were replaced with 0 and missing portion indications were replaced with the smallest portion option. Although the number of missing values was not very high, this practice gives a systematic underestimation of dietary intake as reported by the FFQ. Handling of missing values in the FFQ is the focus of a coming paper from our research group.
To summarise, the ability of the NOWAC questionnaire to rank individuals according to their intake was strongest for foods consumed frequently and weakest for foods eaten more seldom and for micronutrients, except vitamin C and calcium. For macronutrient intakes, the ability to rank individuals was somewhat better when adjusted for energy intake. The FFQ markedly underestimated the intake of alcohol, but the ranking of subjects was good. Overall, the relative validity of the NOWAC questionnaire is comparable to that of FFQs used in other large cohorts, often described as ‘fair’ or ‘adequate’. Nevertheless, the present paper confirms the necessity of examining the validity of new questionnaires and points to the importance of actually implementing the results in the dietary analyses in the main study. Our results will be applied in diet and cancer analyses in the NOWAC study to improve the accuracy of the risk estimates.
Acknowledgements
Sources of funding: The work of A.H. was supported by an EXTRA grant from the Norwegian Foundation for Health and Rehabilitation.
Competing interest declaration: The authors declare that they have no competing interest.
Authorship responsibilities: A.H. did the calculations, performed the statistical analyses, wrote the manuscript, and was the principal investigator of the present study. L.F.A. contributed to the analyses and the manuscript writing. E.L. contributed to the analyses and the manuscript writing, and is the principal investigator of the NOWAC study. All authors read and approved the final version of the manuscript.
Acknowledgements: We would like to thank the International Agency for Research on Cancer for allowing us to use the Norwegian version of EPIC-SOFT in collection of the 24HDRs, and especially Corinne Casagrande for her technical help. We thank Dagrun Engeset for training the interviewers and updating EPIC-SOFT, Bente Augdal for her technical support during collection of the 24HDRs, and Elin Alsaker and Guri Skeie, all at the Institute of Community, University of Tromsø, for their technical support with the data files and nutrient calculations. We thank all the participants and the interviewers, especially Inger Therese Lillegaard and Unni Thomassen, for their cooperation.


