


The obesity epidemic has become a worldwide problem(1). Repeated studies have shown that obesity and related diseases, such as type 2 diabetes and CHD, may be more prevalent among non-Western immigrants than among the host population in Western countries(Reference Abate and Chandalia2–Reference Sevak, McKeigue and Marmot6). Earlier research indicates that migrating from a less to a more industrialized country may lead to weight increase, which is often positively related to the length of stay in the new country(Reference Goel, McCarthy and Phillips7–Reference Kaplan, Huguet and Newsom9).
Integration and acculturation processes, together with psychological strain related to migration, affect lifestyle, including diet and physical activity(Reference Neuhouser, Thompson and Coronado10, Reference Kelleher, Lynch and Daly11). Notions of ideal body shape vary from culture to culture(Reference Sobal and Stunkard12) and are also likely to change in the new environment. The Western ideal for women is to be thin, whereas a more generous shape has traditionally been preferred e.g. on the Indian subcontinent(Reference Nasser13). Bodily dissatisfaction and related disordered eating have previously been viewed as problems existing mainly among white women. However, several studies show that Asian women in the USA are more dissatisfied with their bodies and engage in weight-loss behaviour to a larger extent than white women(Reference Wildes, Emery and Simons14). This may be a consequence of exposure to the thin ideal(Reference Ball and Kenardy15), possibly together with weight increase. The relationship between weight dissatisfaction and weight-related behaviour is not necessarily the same in all cultures. A study comparing first-generation South Asian and Italian women and the general female population in Great Britain showed that the South Asian immigrants were most dissatisfied with their weight, but had less often than the others felt any pressure or tried to lose weight(Reference Bush, Williams and Lean16). A review of studies of weight perceptions among men(Reference Ricciardelli, McCabe and Williams17) found it was more common among non-white men to consider a higher body weight as desirable than among white men, and fewer classified themselves as overweight.
Which aspects of the integration process and which other factors in the immigrants’ lives are connected to weight status, have not been studied in detail. Such knowledge is of great importance in the work to reduce the prevalence of overweight/obesity and related chronic diseases in the immigrant population(Reference Bogers, Bemelmans and Hoogenveen18, Reference Hussain, Claussen and Ramachandran19).
People from South Asia constitute the largest non-Western immigrant group in Norway. Most of them come from Pakistan and Sri Lanka. They are among the immigrants with longest duration of residence in the country(20). They are also among those with the highest risk of developing obesity and type 2 diabetes(Reference Kumar, Meyer and Wandel21). The present study aimed to investigate:
1. The relationship between BMI/waist:hip ratio (WHR) among South Asian immigrants and length of stay in Norway, socio-economic position and degree of integration, as well as the relationship to meal patterns and intake frequency of certain foods, high in fat and sugar.
2. South Asian immigrants’ perception of own body weight, the extent to which dissatisfaction results in slimming, and if dissatisfaction and slimming are related to socio-economic position, integration and certain dietary patterns.
Methods
Design
The Oslo Immigrant Health Study (Immigrant-HUBRO) was conducted by the Norwegian Institute of Public Health and the University of Oslo in 2002. Oslo residents, born in Pakistan, Sri Lanka, Iran, Turkey and Vietnam, were invited to attend. This study followed after the Oslo Health Study (HUBRO). Both used the same protocol and are described elsewhere (http://www.fhi.no/hubro). The study was performed according to the Helsinki Declaration. The Norwegian Data Inspectorate approved the study and it was cleared by the Regional Committee for Medical Research Ethics.
The study consisted of a health check including anthropometric measures and two self-administered questionnaires. A letter of invitation to health screening, a consent form and the main questionnaire were sent to all invited persons. A reminder was sent to non-responders of the first invitation. Information about the study was also given through special immigrant television programmes, newspaper articles and visits made by the study coordinators to mosques and immigrant organizations. Assistance in a preferred language (Norwegian, English, Urdu, Punjabi or Tamil) was offered at the screening stations. Upon arrival, an additional questionnaire was distributed.
Sample
The participants were 30–60 years old, born in Pakistan or Sri Lanka, and living in Oslo. Of 3738 persons invited, 3384 were reached by mail. Out of these, 1501 persons answered the main questionnaire, giving a response rate of 44 % (31·7 % for Pakistanis and 50·9 % for Sri Lankans). The final number of participants included those who had answered the additional questionnaire, which was 629 (218 Pakistanis, 411 Sri Lankans). An earlier comparison between the participants in Immigrant-HUBRO who answered one or both questionnaires showed only small differences with regard to age, gender, nationality, education and work(Reference Wandel, Raberg and Kumar22).
Measures
The main questionnaire contained questions about health, self-reported disease, sociodemographic factors and some food frequency questions. The food frequency questions were the same as previously used in the Oslo Health Study 2000–2001 for Norwegians, and included intake of fruit, vegetables, cheese and fish with the response categories of ‘seldom/never’, ‘1–3 times/month’, ‘1–3 times/week’, ‘4–6 times/week’, ‘1–2 times/d’ and ‘≥3 times/d’, as well as intake of milk, juice and soft drinks with the response categories of ‘seldom/never’, ‘1–6 glasses/week’, ‘1 glass/d’, ‘2–3 glasses/d’ and ‘≥4 glasses/d’. The additional questionnaire included questions related to life conditions as immigrants and more detailed food frequency questions. The food frequency questions were validated previously for ethnic Norwegians(Reference Mosdøl23) and revised after a pilot study with 130 Pakistanis to make the questions suitable for this population. Out of the sixty-seven food and drink items, forty-three were retained, twelve were dropped and twelve items were either new or had been reworded. It included intake of different breads (number of slices/d), bread spreads (‘seldom/never’, ‘1–2 times/week’, ‘3–4 times/week’, ‘5–7 times/week’ and ‘several times/d’), dinner dishes, dressings etc., cakes/sweets/snacks and fats (‘seldom/never’, ‘1–3 times/month’, ‘1–2 times/week’, ‘3–4 times/week’ and ‘5–7 times/week’).
South Asians traditionally eat several hot meals a day, but the number of hot meals often declines after migration to a Western country(Reference Wandel, Raberg and Kumar22). The numbers of meals (hot and total) the participants reported to eat per day were analysed as continuous variables, but were recoded into dichotomous variables for logistic regression: meals in total, 0 = ≤2 and 1 = ≥3; and hot meals, 0 = ≤1 and 1 = ≥2. Frequency of consumption of the different meals (breakfast, lunch, dinner, evening meal and snack) was coded as 0 = ≤4 times/week and 1 = ≥5–6 times/week.
Previous analyses of the same sample revealed that those who reported to eat mainly Norwegian dishes also ate fish, sausages, burgers and spaghetti/macaroni more frequently than others(Reference Wandel, Raberg and Kumar22). On this basis we made an index for a Norwegian eating pattern, including these four items. Each item could contribute with 0–4 points depending on intake frequency and the total score for the index ranged from 0 to 16. For the logistic regression the total score was coded as 0 for the 70 % with the lowest intake frequency and as 1 for the 30 % with the highest frequency.
The results from a previous 24 h recall study among Pakistani women were used to identify the food items that contributed substantially to fat and sugar intake(Reference Natland, Wandel and Holmboe-Ottesen24). Based on this, we made two indices as measures of diets rich in fat and sugar. The food groups contributing most to dietary fat were cooking fat, meat and meat products, milk and milk products, snacks and fatty desserts/biscuits/cakes. Weekly frequency of intake was divided into three categories (high = 3, medium = 2 or low = 1) and then added to compute a total score (variation of score: 5–15). For the logistic regression the 30 % with the highest score was coded as 1, the others as 0. The same procedure was followed for the score on sugar-rich foods, which were sugar added to foods and drinks, sugar-sweetened soft drinks and nectars, and sweet desserts/jam/cakes/cookies (variation of score: 3–9).
BMI and WHR were calculated from the anthropometric measures taken at the screening and analysed as continuous variables. BMI was also recoded into groups: underweight (BMI < 18·5 kg/m2), normal weight (BMI = 18·5–24·9 kg/m2), overweight (BMI = 25·0–29·9 kg/m2) and obesity (BMI ≥ 30·0 kg/m2). The participants were asked whether they were satisfied with their weight or not, and if not, which weight they wished to have. The difference between this and measured weight indicated if the participants desired to weigh less or more. From desired weight and measured height, we calculated desired BMI. For those satisfied with their weight, actual BMI was used as desired BMI. We also asked if they had attempted to slim during the past year, regardless of weight dissatisfaction. A dichotomized variable with a specific cut-off (BMI ≥ 27·5 kg/m2) for Asians, indicating high risk of chronic diseases, was used as suggested by the WHO expert consultation group(25); the values were set to 0 (BMI < 27·5 kg/m2) and 1 (BMI ≥ 27·5 kg/m2).
Age, number of children, years in Norway and years of education were analysed as continuous variables. ‘Years of education’ included education from both Norway and the country of origin. As current occupation may not correspond to educational level or employment in the country of origin, we chose to use the variable ‘being in income-generating work or not’ as an indicator of working situation. This was recoded to a dichotomous variable: 1 = have income-generating work (any), 0 = no income-generating work. Smoking status was assessed with three response categories, and recoded as follows: 1 = yes, now (current smoker), 0 = never or previous smoker. Self-reported leisure-time physical activity was assessed with a four-graded measure, inactive to very active, and recoded to a dichotomous variable: 0 = sedentary activities (e.g. reading, watching television), 1 = moderate physical activities (e.g. walking, cycling) or heavier activities for ≥4 h/week. Integration was assessed by an index computed from three questions regarding reading Norwegian newspapers, having Norwegians visiting one’s home and participating in organizations in Norway. Each of the variables could contribute with 0–3 points, which added up to a scale from 0 to 9.
Information about country of birth, age, gender and residential address was provided from the Norwegian Registry of Vital Statistics. Ethnicity was determined on the basis of country of birth. A cross-check with Statistics Norway’s registers confirmed that in 99·8 % of cases the country of birth was identical to the self-reported ‘country of origin’.
Statistical analyses
Data were analysed using the SPSS statistical software package version 14·0 (SPSS Inc., Chicago, IL, USA). Differences between groups were tested by cross tables and χ 2 statistics. The associations between BMI/WHR and gender, age, years in Norway, nationality, number of children, socio-economic variables (education and income-generating work), integration, smoking and physical activity were tested by multiple linear regression models. We also added different diet-related variables one by one, to find possible associations with BMI/WHR. Only the diet-related variables with significant associations with BMI/WHR were added to the final model. Furthermore, we studied the associations between weight dissatisfaction/slimming and age, nationality, socio-economic position, integration, physical activity and BMI using multiple logistic regression models, and also how being dissatisfied or having tried to lose weight influences eating behaviour. The analyses regarding weight dissatisfaction and slimming were done for men and women separately. The significance level was set to P < 0·05.
Results
Characteristics of the sample
The Sri Lankans were a little younger than the Pakistanis. The participants had been living in Norway between 1 and 34 years, the Pakistanis on average longer than the Sri Lankans (Table 1). Despite shorter time in Norway, the Sri Lankans scored somewhat higher on the index measuring integration (P = 0·008). Sri Lankans also had longer education on average and a higher proportion in income-generating work. Overweight/obesity (BMI ≥ 25·0 kg/m2) was present in 58·2 % of the Sri Lankans and 76·5 % of the Pakistanis; between 22·5 % and 54·9 % had a high health risk (BMI ≥ 27·5 kg/m2). The proportion of obese (BMI ≥ 30·0 kg/m2) individuals varied from 5·5 % among Sri Lankan men to 31·9 % among Pakistani women (Table 1). Mean WHR was 0·85 and 0·86 in women and 0·92 and 0·94 in men from Sri Lanka and Pakistan, respectively. Sri Lankans had on average more daily hot meals and meals in total than Pakistanis, and a higher proportion of Sri Lankans were also within the 30 % with the highest frequency of intake of foods indicating a Norwegian diet, as well as within the 30 % with the highest intake frequency of foods high in fat.
Table 1 Characteristics of the study sample: Pakistani and Sri Lankan immigrants, aged 30–60 years, residing in Oslo, 2002
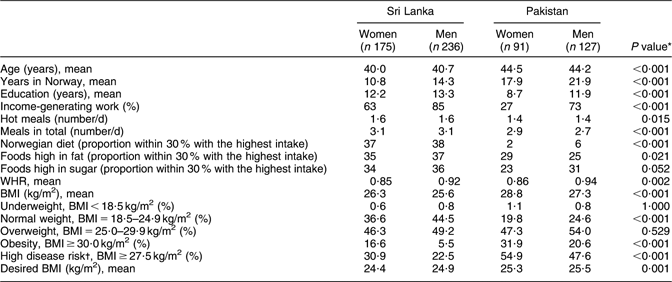
WHR, waist:hip ratio.
*Significance of the difference between nationalities.
†BMI cut-off indicating high risk of chronic diseases among South Asians, suggested by the WHO expert consultation group(25).
BMI/waist:hip ratio related to integration, socio-economic position and diet
After adjustment for age and gender, there was no significant association between the number of years lived in Norway and BMI or WHR. In the multivariate analyses (Table 2), Pakistani origin (P < 0·001) and female gender (P = 0·004) were positively associated with BMI, whereas years of education (P = 0·011) and number of hot meals (P = 0·016) were inversely associated. Male gender (P < 0·001), age (P < 0·001) and foods rich in fat (P = 0·005) were positively associated with WHR, while degree of integration was inversely associated (P = 0·017) with WHR. The multivariate models explained 11 % of the variation in BMI and 35 % of the variation in WHR. The regression analyses were also carried out separately for women and men and for Sri Lankans and Pakistanis, and the associations were in the same direction for both genders and both nationalities.
Table 2 Crude and adjusted coefficients and 95 % confidence intervals for associations between BMI/WHR and demographic, socio-economic and lifestyle variables from linear regression models: Pakistani and Sri Lankan immigrants, aged 30–60 years, residing in Oslo, 2002
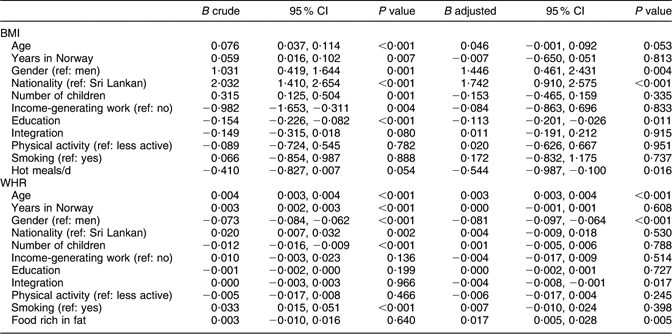
ref, referent category; WHR, waist:hip ratio.
Adjusted for all independent variables.
Adjusted R 2 = 11 % for BMI; adjusted R 2 = 35 % for WHR.
Weight dissatisfaction and slimming
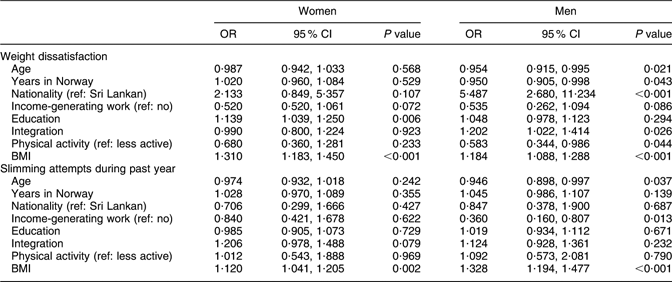
Almost 30 % of the normal-weight men and women, about half of those overweight and most of those obese were dissatisfied with their weight (Fig. 1). A greater proportion of women than men were dissatisfied with their weight (P = 0·002). Among those dissatisfied, 21 % of men and 6 % of women wanted to gain weight (P < 0·001). Out of those with normal weight who wanted to change weight, about 70 % of the men wanted to gain weight, while about 80 % of the women desired a lower weight. Most overweight and all obese who were dissatisfied with their weight wanted to weigh less. Men wanted an average weight change of −2 kg (range: −9 kg to +19 kg), while the respective amount for women was −5 kg (range: −21 kg to +5 kg). Mean desired BMI was within the normal-weight range among the Sri Lankans, but slightly above the cut-off point for overweight among the Pakistanis (Table 1). It was lower than mean actual BMI in both groups (P < 0·001). Desired BMI increased with actual BMI (P < 0·001) and for Sri Lankans it was positively associated with age (P < 0·001 for women and P = 0·014 for men; data not shown). Degree of integration or socio-economic position had no impact on desired BMI, except for Sri Lankan women among whom education was inversely associated with desired BMI (P < 0·001).

Fig. 1 Percentage dissatisfied with their weight (![]() ), wanting to weigh less (
), wanting to weigh less (![]() ) and attempting to slim during the past year (
) and attempting to slim during the past year (![]() ) in each BMI group among Pakistani and Sri Lankan immigrants, aged 30–60 years, residing in Oslo, 2002: (a) men (n 359; normal weight, n 136; overweight, n 184; obese, n 39) and (b) women (n 264; normal weight, n 82; overweight, n 124; obese, n 58). Underweight persons (three men, two women) were excluded
) in each BMI group among Pakistani and Sri Lankan immigrants, aged 30–60 years, residing in Oslo, 2002: (a) men (n 359; normal weight, n 136; overweight, n 184; obese, n 39) and (b) women (n 264; normal weight, n 82; overweight, n 124; obese, n 58). Underweight persons (three men, two women) were excluded
Figure 1 also shows the proportion who had tried to slim in each weight group. A considerably greater proportion had attempted to slim during the past year among those who were dissatisfied with their weight, than among those who were satisfied (40 % v. 15 %; P < 0·001). Of those who wanted to weigh less, 49 % of women and 39 % of men had tried to slim during the past year. Almost all those of normal weight who wanted to weigh less had attempted to slim, whereas the wish for weight reduction corresponded less to slimming among the overweight and obese men and women. The proportion who had attempted to slim was not significantly different between Pakistanis and Sri Lankans (29 % v. 26 %), but there were more women in both groups (P = 0·001; data not shown).
Weight dissatisfaction was increasing with BMI in both genders (P < 0·001 for both; Table 3). Among women dissatisfaction was positively associated with education (P = 0·006); among men it was inversely associated with age (P = 0·021), years lived in Norway (P = 0·043) and physical activity (P = 0·044), and positively associated with Pakistani origin (P < 0·001) and integration (P = 0·026). Slimming was positively associated with BMI in both genders (P = 0·02 for women, P < 0·001 for men), and among men it was inversely associated with age (P = 0·037) and income-generating work (P = 0·013; Table 3).
Table 3 Odds ratios and 95 % confidence intervals for weight dissatisfaction and slimming attempts related to demographic and socio-economic factors, integration and lifestyle from logistic regression models: Pakistani and Sri Lankan immigrants, aged 30–60 years, residing in Oslo, 2002
ref, referent category.
Adjusted for all independent variables.
Results from logistic regression analyses showed that, for women, weight dissatisfaction and slimming were inversely associated with number of daily hot meals and number of meals in total (P < 0·05; data not shown). Women who were slimming had breakfast less frequently than the other women (P = 0·039). For men, being dissatisfied with weight was inversely related to the intake frequency of food items associated with a more Norwegian diet (P = 0·003). There were no significant associations between slimming attempts and dietary indicators among men.
Discussion
Method
Immigrant groups from developing countries are very often excluded from national health studies due to low attendance and language problems. Several means, like the use of mass media, reminders and language support, were employed to enhance the participation rate in Immigrant-HUBRO. Even though the attendance rate achieved for South Asians was similar to that of ethnic Norwegians in HUBRO (44 % v. 46 %), this is still a low attendance rate, which may influence the results. Søgaard et al. analysed the non-responders of HUBRO and found that attendance was associated with age, education, income and female gender, both for ethnic Norwegians and non-Western immigrants(Reference Søgaard, Selmer and Bjertness26). However, the differences were rather small, and they concluded that the results were robust even in light of considerable non-attendance. It is likely that this is also true for Immigrant-HUBRO. The socio-economic profile, i.e. number of years in Norway, level of education and proportion in income-generating work, of the two ethnic groups in the sample was in agreement with data from Statistics Norway(20, 27). This suggests that the findings may be useful in planning interventions among Pakistani and Sri Lankan immigrants in Norway.
Differences in their countries of origin, and also reason for migration, may explain the socio-economic differences between the two groups, with Sri Lankans having the highest scores regarding both education and participation in income-generating work. In Sri Lanka, the literacy level is about 90 %, with small gender differences(28). In Pakistan, the literacy level is about 50 %, with a considerably lower proportion of literate women than men(28). Sri Lankans came originally to Norway as refugees, whereas Pakistanis were work migrants. Later, many have come for family reunion from both groups(20). The educational level in the sample is somewhat lower than in the Norwegian population(20) and the proportion in income-generating work is similar to that in the Norwegian population among men, but lower among women(27).
We chose to use education and employment as indicators of socio-economic position. These two variables were differently associated with BMI, weight dissatisfaction and slimming attempts. They are commonly used indicators of socio-economic position. However, the use of these variables in migrant studies may pose some extra challenges, since their effect may be more complex across ethnic groups than in more homogeneous groups(Reference Kumar, Meyer and Wandel21, Reference Sundquist and Johansson29). During migration, professional status enjoyed in the home country is often lost as education is not recognized by the host country. In the current study we chose to not classify occupational groups, only whether or not the person was employed in income-generating work. Employment will provide income and may give status, access to social contact with ethnic Norwegians, facilitate entry into the Norwegian society and development of language skills. This may happen in most working places. Another problem concerns the different educational systems across the countries. We included education from both the country of origin and Norway. This may have led to a higher risk of misclassification of educational level and given weaker associations than if the educational background had been more homogeneous.
BMI/waist:hip ratio
Mean BMI in our sample was considerably higher than that of South Asians in Pakistan(Reference Jafar, Levey and White30, Reference Jafar, Qadri and Chaturvedi31) and Sri Lanka(Reference Tennakoon32, Reference Wijewardene, Mohideen and Mendis33), as well as among the Norwegian population(Reference Meyer and Tverdal34–Reference Reas, Nygard and Svensson36). The tendency for a higher prevalence of central obesity in South Asians(Reference Kumar, Meyer and Wandel21) was taken into account by using WHR in addition to BMI, and by including the South-Asian-specific BMI cut-off for high disease risk(25). About a quarter of the Sri Lankans and half of the Pakistanis were at high risk for developing chronic diseases.
BMI was inversely associated with education. This is in agreement with previous findings among non-Western immigrant groups in The Netherlands and the USA(Reference Cornelisse-Vermaat and van den Brink37, Reference Yeh, Fahs and Shelley38). Lower socio-economic status is also related to BMI in the Norwegian population(39).
BMI was inversely associated with the number of hot meals, which suggests that hot meals are exchanged with more energy-dense foods. Slimming attempts, being positively related to BMI, may include fewer hot meals and thereby explain some of the association between BMI and hot meals. The socio-economic, demographic and dietary variables explained only a small proportion of the differences in BMI in this group. Other factors, like social codes regarding food and eating, psychological distress as well as underlying genetic factors(Reference O’Dea40, Reference Barker41), may be more powerful explanatory factors for these differences. WHR was to a larger extent than BMI associated with socio-economic, demographic and dietary variables.
Weight dissatisfaction and slimming attempts
In agreement with findings from several ethnic groups(Reference Smith, Thompson and Raczynski42–Reference Cachelin, Rebeck and Chung44), women in Immigrant-HUBRO were more prone to be dissatisfied with their bodies than men, and while women wanted to lose weight, men more often wanted to gain weight. About one out of three normal-weight women were dissatisfied with their weight. Overestimation of one’s own weight among under- and normal-weight women has been found in South Asia(Reference Suhail and Zaib-u-Nisa45–Reference Sinhababu47). Bodily dissatisfaction may influence self-esteem in general and it may lead to unhealthy eating behaviour. The present study also revealed that many of those overweight and obese did not perceive that they weighed too much. This is in line with data from several other Western countries(Reference Crawford and Campbell48, Reference Wardle and Johnson49). A challenge in the prevention of lifestyle-related diseases is to raise awareness of weight-related problems without causing weight dissatisfaction among those of normal weight.
A study of ethnic Norwegian women showed that 80 % of those overweight and 90 % of those obese were slimming(Reference Hjartaker, Laake and Lund35). Among the Pakistani and Sri Lankan women, about 40 % of the overweight and obese had been slimming the past year. Thus, the relationship between BMI and slimming attempts does not seem to be as strong among these two groups as among Norwegian women. Cachelin et al. suggest that the two cultures may have more or less the same body ideal, but the pressure to achieve it may vary(Reference Cachelin, Rebeck and Chung44).
The women with higher education displayed more dissatisfaction with their weight, despite lower BMI, similar to findings among Western women(Reference Wardle and Johnson49, Reference McLaren and Kuh50). Integration and length of stay in Norway had no significant associations with the women’s weight dissatisfaction or with slimming. A thin ideal is not necessarily enough to affect degree of dissatisfaction or weight-related behaviour; the value must first be internalized(Reference Fingeret and Gleaves51). Media exposure influences how people view themselves(Reference Hatoum and Belle52–Reference Cahill and Mussap54), and so will those they spend time with, look up to and compare themselves with. Warren et al. suggest that ethnicity may protect women against bodily dissatisfaction in two ways: either because the group they belong to has ideals other than the ultra-thin Western ideal, or because they are valued for qualities other than external appearance(Reference Warren, Gleaves and Cepeda-Benito55).
Our results show differences in how men and women attempt to diet. Women who were dissatisfied with their weight and/or attempted to slim had fewer daily meals, and those slimming also had breakfast less frequently. Most of the dissatisfied normal-weight men wanted to gain weight. Whether this is related to, or irrespective of, desired increased muscle size cannot be discerned from our data(Reference Ricciardelli, McCabe and Williams17). However, the inverse association between physical activity and weight dissatisfaction suggests that physical activity is more important than diet for attempts to achieve weight regulation among South Asian men.
Conclusions
The present study adds knowledge about some diet-related and socio-economic factors associated with weight, weight dissatisfaction and slimming among immigrants in Oslo. Our results show that both bodily dissatisfaction and unrecognized overweight exist among South Asians in Norway. It is necessary to understand how different ethnic groups in the population think regarding body weight and slimming, in order to prevent or treat obesity as well as eating disorders(Reference Thompson56). More research is needed regarding factors influencing bodily dissatisfaction, the relationship between perception of weight and weight-change attempts, and how this affects the overall health situation among immigrants in Norway.
Acknowledgements
The data collection was conducted as part of the Oslo Immigrant Health Study carried out in 2002 as a collaboration between the Norwegian Institute of Public Health and the University of Oslo. No external funding was used, and no conflict of interest exists for any of the authors. All authors contributed in the conception and the writing of the article. Statistical analyses were executed by M.R.


