


When breast milk alone is no longer nutritionally sufficient for an infant after 6 months of age, the initiation of complementary feeding allows the child to transition gradually to eating family foods. It is estimated that 6 % of deaths among under-5 s could be prevented through the achievement of universal coverage with improved complementary feeding alone(1, Reference Lutter2). The WHO infant feeding guidelines recommend that infants should be exclusively breast-fed for the first 6 months of life, after which complementary foods may be introduced in conjunction with continued breast-feeding to achieve optimal growth, development and health(3–5). In many developing countries, complementary foods consist of cereals or starchy roots that have been prepared as a thin gruel. Coupled with very few feeds per day, the lack of energy and nutrient content of the complementary foods further increases the risk of child growth retardation and malnutrition(Reference Gibson, Ferguson and Lehrfeld6). With approximately one-third of all children in developing countries under the age of 5 years having low height-for-age and many more being deficient in one or more micronutrients, child undernutrition is a major public health problem in many resource-poor communities in the world(Reference Black, Allen and Bhutta7, Reference Ruel, Brown and Caulfield8).
Since the first definitions of infant and young child feeding indicators were proposed by WHO in 1991, there have been important developments in scientific knowledge about what constitutes optimal breast-feeding and complementary feeding practices. In particular, the 1991 infant and young child feeding indicators included only one indicator for complementary feeding – timely complementary feeding. This indicator provided information about the consumption of complementary foods but not about the quantity or quality of those foods. In response to concerns about the lack of adequate indicators of complementary feeding, WHO in 2002 began a process to review and develop new indicators of complementary feeding practices(9). The new indicators of complementary feeding allowed for the calculation of four outcome variables which in turn provided much more comprehensive definitions.
The present paper focuses on the Republic of Indonesia, the fourth most populated country in the world. Despite a majority of all Indonesian children being breast-fed and receiving some form of complementary foods, at the current mortality levels, out of 1000 live births, thirty-one infants die before reaching 5 years of age and 28 % of children in the same age bracket are underweight. With 44 % of all children being stunted and a further 9 % of infants having low birth weight, childhood undernutrition is a significant problem that continues to need to be addressed(10, 11).
However, there are few reports about complementary feeding practices within Indonesia, and there are no previous reports examining complementary feeding using the new WHO recommended complementary feeding indicators.
Therefore the present study aims to describe patterns of complementary feeding in Indonesia using the new WHO complementary feeding indicators by analysing the 2007 Indonesia Demographic and Health Survey data. The study also seeks to identify factors associated with inappropriate complementary feeding practices in Indonesia.
Methods
Data sources
The data examined were from the 2007 Indonesia Demographic and Health Survey (IDHS), which was conducted in all thirty-three provinces of Indonesia. The survey aimed to gather information about child mortality and maternal and child health, as well as on family planning and other reproductive health issues.
It is a useful and valid source of information on infant and child feeding practices from a representative national household sample of 40 701 households. The data collection was based on three main questionnaires: the Household Questionnaire (HQ), the Ever-Married Women's Questionnaire (EMWQ) and the Married Men's Questionnaire (MMQ).
Census blocks were used as the primary sampling unit and the sampling was stratified by urban and rural areas within each province. Systematic random sampling was used to select census blocks followed by a random selection of twenty-five households. Further details of the sampling design and survey methodology are available in the IDHS 2007 report(12).
In this IDHS, 99 % of the 41 131 available households were successfully interviewed, and 32 895 women were interviewed which comprised 96 % of the 34 227 eligible women. Of the 9716 eligible men identified, 8758 were successfully interviewed, yielding a response rate of 90 %. The present analysis includes a weighted total (numbers adjusted by the sampling weights) of 4604 children aged 6–23 months.
Conceptual framework
Figure 1 presents the framework used in the current analysis, along with the selected possible predictors of complementary feeding in Indonesia. The individual-level factors include variables from attributes of the parents, infant and mother–infant dyad. Household environmental factors include the household wealth index and community-level factors include type of residence and geographical region(Reference Mosley and Chen13, Reference Hector, King and Webb14).
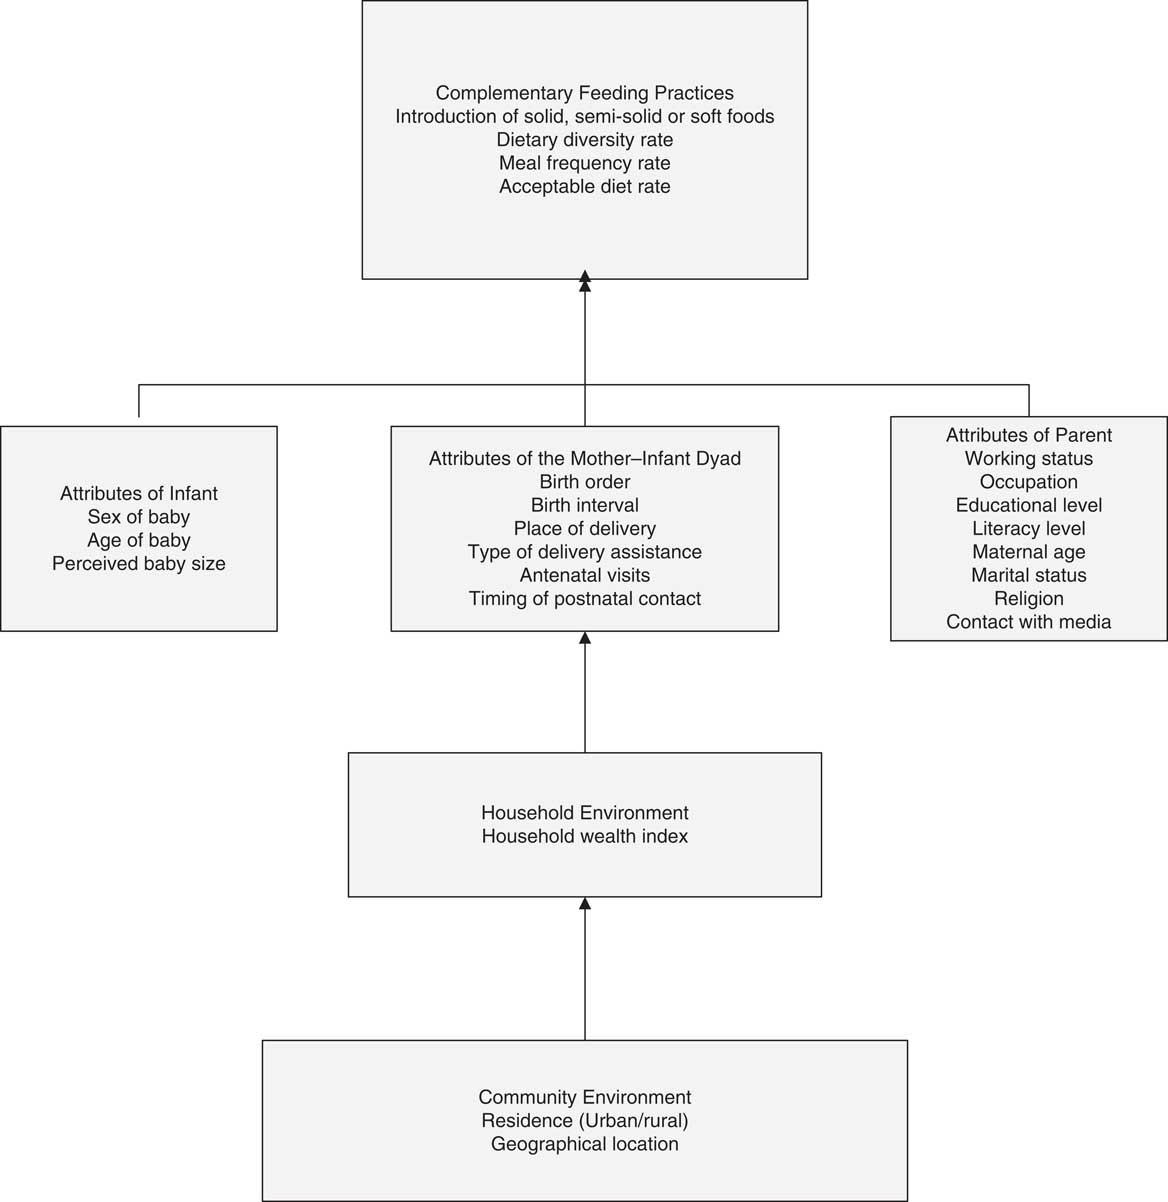
Fig. 1 Conceptual framework of factors influencing complementary feeding practices in Indonesia. Adapted from Mosley and Chen(Reference Mosley and Chen13)
Complementary feeding indicators and explanatory variables
Complementary feeding practices were assessed using the key indicators recommended by WHO in 2007(9), which are based on 24 h recall data and are defined as follows.
1. Introduction of solid, semi-solid or soft foods: the percentage of infants 6–8 months of age who received solid, semi-solid or soft foods.
2. Minimum dietary diversity: the percentage of children 6–23 months of age who received foods from four or more food groups. There were only six food groups in the IDHS data instead of seven recommended in the WHO guidelines because eggs and flesh foods were combined as one group. The combined food group of eggs and meat was arbitrarily assigned a weight of two when calculating the dietary diversity index. This is likely to have produced slightly over-optimistic estimates for the minimal dietary diversity index.
3. Minimum meal frequency: the percentage of breast-fed and non-breast-fed infants 6–23 months of age who received solid, semi-solid or soft foods the minimum number of times or more. For breast-fed infants aged 6–8 months, the minimum was two times or more during the previous day and this was increased to at least three times for infants aged 9–23 months. For non-breast-fed infants aged 6–23 months, this was established as being fed solid, semi-solid or soft foods for at least four times or more during the previous day.
4. Minimum acceptable diet: the percentage of children 6–23 months of age who received a minimum acceptable diet apart from breast milk. This includes breast-fed and non-breast-fed children 6–23 months of age who had at least the minimum dietary diversity and minimum meal frequency during the previous day with the addition of at least two milk feedings for the non-breast-fed infants. There were no variables available in the IDHS data sets for non-breast-fed children; therefore results presented for this indicator pertain to breast-fed children.
The consumption of Fe-rich or Fe-fortified foods was not examined in this analysis because these data were not collected in IDHS.
Complementary feeding was examined by:
1. individual-level factors, which included mother's working status, father's occupation, mother's working at home or away, mother's education, father's education, mother's literacy, mother's age, mother's marital status, mother's religion, birth order, birth interval, sex of infant, age of child, size of baby, place of delivery, type of delivery assistance, antenatal clinic visits, timing of postnatal check-up, and mother having interaction with the media (newspaper, radio, television);
2. household-level factors, which included the household wealth index; and
3. community-level factors, such as the place of residence and geographical region.
The household wealth index was calculated as score of household assets such as ownership of transportation devices, ownership of durable goods and household facilities, which was weighted using the principal components analysis method(Reference Filmer and Pritchett15).
Data analysis
Analyses were confined to the youngest child 6–23 months of age living with the respondent (ever married women aged 15–49 years), although some of the indicators were applicable to different age categories within this range.
The prevalence of infant and young child feeding indicators was estimated across different explanatory variables, and the χ 2 test was used to test the statistical significance. Confidence intervals were calculated for prevalence estimates using the survey (SVY) commands to allow for adjustments for the sampling weight and cluster sampling design used in the surveys when estimating confidence intervals around prevalence estimates.
Univariate associations were examined by unadjusted odds ratios for all four selected indicator variables, namely introduction of solid, semi-solid or soft foods, minimum dietary diversity, minimum meal frequency and minimum acceptable diet. Multiple logistic regression analysis was used in a stepwise backward regression model to estimate the adjusted odds ratios and 95 % confidence intervals which allows for identification of the factors significantly associated with complementary feeding practices. Only the variables with statistical significance of P ≤ 0·05 were retained in the final step of modelling and are presented in the results tables of multivariate analyses. Data analysis was performed using the STATA statistical software package version 10·0 (2007; Stata Corporation, College Station, TX, USA).
Results
Characteristics of the sample
Table 1 presents the distribution of the individual-, household- and community-level characteristics of 4604 (weighted total) children aged 6–23 months. The sample had a low percentage of working mothers and a very high percentage of literate mothers, with more than half having completed secondary or higher education. More than half of the surveyed mothers had more than one child, and more than half had a preceding birth interval of more than 24 months. According to the mothers’ perception of birth size, which has been shown to be a good population-level indicator of birth weight(Reference Boerma, Weinstein and Rutstein16, Reference Mbuagbaw and Gofin17), about one in seven of the infants was of small size at birth. Of the total births, half were home deliveries and slightly more than half had received trained health professional assistance during delivery. Nearly all mothers had made at least one antenatal clinic visit during their pregnancy.
Table 1 Individual-, household- and community-level characteristics of infants 6–23 months of age, Indonesia, 2007 (n 4604)
NTB, Nusa Tenggara Barat; NTT, Nusa Tenggara Timur.
†Weighted total was 4604 unless stated otherwise in parentheses.
Complementary feeding indicators
Of the breast-fed and non-breast-fed children aged 6–23 months, a high percentage (87·3 %) of those aged 6–8 months had been given solid, semi-solid or soft foods (Table 2). The percentage of infants who had received foods from four or more food groups increased with age from 47·7 % at 6–11 months to 84·2 % at 18–23 months. For non-breast-fed children, the percentage meeting the minimum dietary diversity criterion was 60·2 % for children aged 6–11 months, 79·6 % for children aged 12–17 months and 88·4 % for children aged 18–23 months.
Table 2 Percentage of children who did not reach minimum criteria for complementary feeding indicators among breast-fed and non-breast-fed children 6–23 months of age, Indonesia, 2007 (n 4604)
†Minimum for dietary diversity: received foods from four or more food groups, consumption of any amount from each food group.
‡Minimum for meal frequency: two meals for breast-fed infants aged 6–8 months, three meals for breast-fed children aged 9–23 months, four meals for non-breast-fed children aged 6–23 months.
§Minimum for acceptable diet: combination of dietary diversity and meal frequency.
∣∣Calculated only for breast-fed children.
More than half (53·0 %) of infants aged 6–23 months received food 2–4 times or more on the day prior to the survey, but the percentage meeting the minimum meal frequency criterion decreased with increasing age. For non-breast-fed children, the prevalence of minimum meal frequency was 5·7 % for children aged 6–11 months, 13·7 % for children aged 12–17 months and 13·5 % for children aged 18–23 months.
The prevalence of minimum acceptable diet in infants aged 6–23 months was only 44·9 %, indicating that a greater proportion were either not given food from four or more of the recommended food groups in their diet or the meal frequencies were less than the recommended 2–4 times daily.
Determinants of complementary feeding indicators: univariate analyses
Table 3 shows the prevalence of complementary feeding indicators across Indonesia and reveals that the percentage of those introduced to solid, semi-solid or soft foods remained relatively high across all the factors examined. There was a significantly lower percentage of introduction of complementary feeds to infants aged 6–8 months for mothers or fathers with no formal education, illiterate or formerly married mothers, no use of antenatal care services or postnatal check-ups, and residence in outer islands especially Kalimantan.
Table 3 Percentage of children with appropriate introduction of solid, semi-solid or soft foods, minimum dietary diversity, minimum meal frequency and minimum acceptable diet by individual-, household- and community-level characteristics, Indonesia, 2007

NTB, Nusa Tenggara Barat; NTT, Nusa Tenggara Timur.
χ 2 test was applied to test statistical significance.
*P < 0·05; **P < 0·001.
†Calculated only for breast-fed children.
The minimum dietary diversity prevalence was significantly lower in non-working mothers and fathers, including fathers who worked in agriculture, mothers or fathers with no formal education, mothers who were illiterate, younger mothers, mothers of Christian religion, younger infants, home delivered infants, deliveries attended by traditional birth attendants, mothers who did not read newspapers/magazines, listen to the radio or watch television, infants from the poorest households and those who lived in rural areas.
The prevalence of children meeting the minimum meal frequency criterion varied less across the factors examined compared with the other indicators. Minimum meal frequency was significantly lower in mothers with no formal education, illiterate and formerly married mothers, older infants, small sized infants, and in infants from selected geographic areas, especially Sumatra and Kalimantan.
The prevalence of infants meeting the minimum acceptable diet criterion was low in each of the individual-, household- and community-level factors examined. The percentage of infants currently being fed from four or more food groups, 2–4 times daily was 36·4 % in infants from the ‘poorest’ wealth index compared with 54·7 % in infants from the ‘wealthiest’ wealth index. The prevalence of minimum acceptable diet was significantly lower for infants whose parents had a lower level of education, whose mothers did not work, for younger infants, delivered by a traditional birth attendant, whose mother did not attend antenatal care services, whose mothers did not read newspapers/magazines, listen to the radio or watch television, and infants from rural settings.
Within each region, the prevalences of complementary feeding and minimum dietary diversity were better than both the minimum meal frequency and minimum acceptable diet.
Determinants of complementary feeding indicators: multivariate analyses
Unadjusted and adjusted odds ratios were calculated to estimate the strength of association between independent variables and the four key complementary feeding outcomes: (i) not being introduced to solid, semi-solid or soft foods; (ii) not meeting minimum dietary diversity; (iii) not meeting minimum meal frequency; and (iv) not meeting minimum acceptable diet.
As shown in Table 4, delay in initiating complementary feeding at 6–8 months was significantly associated with decreased age of the child and with a poor household wealth index.
Table 4 Survey logistic modelling of a child not currently receiving adequate complementary feeding (unadjusted and adjusted odds ratios), Indonesia, 2007
NTB, Nusa Tenggara Barat; NTT, Nusa Tenggara Timur.
The categories of explanatory variables have been ordered by placing the category with the lowest risk of the adverse feeding pattern first and this sequence may vary from earlier tables.
As expected, mother's education had a positive impact on dietary diversity (Table 4). Women from wealthier households or urban areas reported significantly higher dietary diversity than those from poorer households or rural areas. Increasing child's age also had a positive association with dietary diversity. Infants whose mothers read newspapers/magazines and watched television every day were significantly less likely to be fed with four or more food groups. As compared with the Sumatra region, only Kalimantan was significantly more likely to meet minimum dietary diversity criterion.
As seen in Table 4, adequate meal frequency was significantly associated with older age of the child, home delivered or male infants, higher educated mothers and all the regions other than Sumatra. In contrast, meal frequency was significantly lower in women who were divorced, separated or widowed and who had more contact with the media.
Meeting minimum acceptable diet was significantly associated with mothers who were working, mothers with higher levels of education, increasing infant's age, urban residence, and in Kalimantan and Sulawesi.
Discussion
The present analysis of complementary feeding in Indonesia, which used recent nationally representative data and the new WHO indicators, has revealed that overall the level of the indicators were above 50 % except for the acceptable diet indicator. This is the first report describing complementary feeding indicators in Indonesia using the new WHO indicators.
The study has several strengths. First, the 2007 IDHS was a nationally representative survey using standardised methods that achieved high individual and household response rates. Second, the analyses used the recently recommended WHO infant feeding indicators(9). These new indicators have never been analysed for Indonesia and should help guide the development of appropriate programmes to improve complementary feeding in Indonesia. Finally, the analyses used appropriate adjustments for the complex sampling design of the IDHS.
The study has several potential limitations that should be noted when interpreting the results. First, several variables in the study were not specific to the infants included in the analysis because they reflected only the most recent conditions or birth, such as maternal and paternal occupation, which represented the employment status within the last 12 months preceding the survey. Second, there are limited variables available to measure household- and community-level factors. Third, the cross-sectional design of the study means that causal factors for inappropriate complementary feeding could not be established.
Complementary feeding indicators
Introduction of solid, semi-solid or soft foods
The household wealth index emerged as one of the strongest predictors of poor initiation of solid, semi-solid or soft foods. In a number of studies, household wealth index was related to poor infant feeding and was closely associated with low birth weight and stunting(Reference Fadnes, Engebretsen and Wamani18, Reference Engebretsen, Tylleskär and Wamani19). Shorter birth intervals of less than 12 months have been reported in earlier literature as a strong predictor of poor infant feeding(Reference Naylor and Morrow20–24). This could be related to maternal depletion syndrome and resource competition between siblings, in addition to a lack of care and attention experienced by first-born infants(Reference Bushra, Ahmad and Hussain25–Reference Zenger28).
Dietary diversity
A close relationship was observed between the utilisation of media such as newspapers, magazines and television and a lower prevalence of adequate dietary diversity. However, this result suggests that the mass media has the potential to promote dietary diversity, educating and advising parents or caregivers of the benefits of serving a variety of foods. A project undertaken in Indonesia in 1985, which drew on the mass media to improve child feeding practices at home, led to much improvement in infant feeding knowledge and practices among mothers(29). It is established that educational interventions can lead to improved feeding practices(Reference Bhandari, Mazumder and Bahl30). In Peru, a community-based controlled efficacy study assessed the impact of regular nutrition advice in the home on dietary intake in infants 7–11 months of age. The results showed that complementary food intake, and thus intakes of energy and nutrients, increased during the short study period. This was achieved through increasing consumption of certain food groups and recommended food preparations, including foods from animal sources(Reference Daelmans and Saadeh31, Reference Sellen32).
At the household level, high wealth index demonstrated a significant association with dietary diversity. There was a progressive increase in the prevalence of children meeting the dietary diversity criterion as wealth index increased. Although most mothers or caregivers were aware that dietary diversity plays an important role in the child's health, this knowledge–practice discrepancy appears to imply that lack of resources acts as a barrier for mothers in their efforts to put knowledge into practice(Reference Wamani, Astrøm and Peterson33).
The geographic differences in dietary diversity were significant in the multivariate analysis, with infants living in Java and Bali less likely to be given four or more food groups than those living in Sumatra. This might relate to different food cultures or beliefs about the variety of foods that are suitable for infants or the availability of foods.
Meal frequency and acceptable diet
Feeding patterns such as the timing and number of meals or snacks require close attention(Reference Lutter2). One of the independent variables likely to interact with the intake of complementary foods is the behaviour of the caregiver, which includes the level of encouragement provided to the child during feeding, the frequency the food is being fed and the environment where feeding takes place(Reference Lutter2, Reference Dewey and Brown34–Reference Daelmans, Martines and Saadeh36).
Mothers who gave birth in a health facility had a poor association with meal frequency. This is a contradictory finding, with further examination of the data also revealing that the prevalence of bottle-feeding was higher in women who delivered in health facilities (42·9 %) than in those who delivered at home (24·2 %). This can be explained by wealthier women, who were more likely to bottle-feed, giving birth in health facilities, thus explaining the lower prevalence of adequate meal frequency. This also indicates that women delivering in health facilities may not have been appropriately counselled or given advice about infant feeding, suggesting a need to improve the delivery of infant and young child feeding messages in health facilities.
Mothers who were divorced, separated or widowed also had a negative association with meeting the meal frequency criterion. Studies have shown that single mothers lack support from families or communities, which causes poor infant feeding practices(37). This indicates that health institutions and health-care professionals can play a significant role in promoting complementary feeding. Evidence(Reference Daelmans, Martines and Saadeh36) shows that infant feeding counselling in health facilities is effective, not only to improve breast-feeding practices, but also to improve complementary feeding. In one population where the duration of breast-feeding was typically short and where complementary foods were introduced early, the provision of counselling in health facilities was attributed to a decline in growth faltering among children older than 6 months. Through improvements to maternal complementary feeding knowledge, increases in energy and nutrient intakes were observed and were qualitatively demonstrated through improved feeding practices such as the timely introduction of complementary foods and the quality of such foods(Reference Santos, Victora and Martines38). Similar findings were observed in a large community-based study in Haryana, India where complementary feeding practices were improved through the provision of appropriate information and support to families and caregivers through the health system and the community(Reference Bhandari, Bahl and Mazumdar39).
However, mother's education demonstrated a significant association with both meal frequency and the acceptable diet criterion. The present analysis revealed that more educated mothers were more likely to feed their child 2–4 times or more on the previous day, which allows higher likelihood of the child consuming at least one animal-source food and at least one fruit or vegetable that day. Similar findings associating infant feeding with education have also been described in studies undertaken in Uganda and Pakistan(Reference Fadnes, Engebretsen and Wamani18, Reference Liaqat, Rizvi and Qayyum40). Higher-educated mothers were associated with more beneficial feeding practices than their less-educated peers, indicating that nutrition and feeding guidance for mothers needs to be especially targeted to lower-educated mothers(Reference Fein, Labiner-Wolfe and Scanlon41).
The prevalences of adequate meal frequency and acceptable diet were both shown to be positively significant within all geographic regions.
Conclusions
The importance of improving appropriate complementary feeding practices is paramount in reducing undernutrition and excess morbidity and mortality in children in developing countries. There is an urgent need for a collective effort to achieve the Millennium Development Goals for the prevention of undernutrition and to improve child survival. Furthermore, infant feeding recommendations need to be adapted to the specific settings in which they are to be implemented. Previous research has shown that complementary feeding can be improved and one possible method in achieving this goal is through promotion programmes that provide counselling and education to mothers regarding appropriate foods and frequency of feeding of young children.
Most complementary feeding indicators in Indonesia could be improved in order to gain the full benefits of appropriate complementary feeding in reducing undernutrition, morbidity and mortality in young children.
Acknowledgements
This research received no specific grant from any funding agency in the public, commercial or not-for-profit sectors. This analysis is part of the first author's dissertation to fulfil the requirements for a Master of International Public Health with Honours at the University of Sydney. There are no conflicts of interest. C.S.N. and M.J.D. designed the study; C.S.N. performed the analysis and prepared the manuscript; M.J.D. and K.E.A. provided data analysis advice. M.J.D. provided revision of the final manuscript. All authors read and approved the manuscript. C.S.N. would like to thank Associate Professor Michael J Dibley for helping with the study design and Dr Kingsley Agho for help with the analysis.


