


Diet is an important factor in order to maintain good health throughout the life course(1). Knowledge on healthy dietary behaviours and other lifestyle factors related to the development of obesity is needed to understand the prevalence of obesity and other non-communicable diseases(Reference Moreno, Rodriguez and Fleta2, Reference van der Sluis, Lien and Twisk3). Establishing healthy eating habits is of importance during adolescence, given that these behaviours tend to be continued into adulthood(Reference Kelder, Perry and Klepp4–Reference Wang, Bentley and Zhai8). Promotion of fruits and vegetables, and reducing the intake of energy-dense and sugary foods, are recommended in order to prevent non-communicable diseases(1, 9).
Changes in an individual's eating habits may occur between childhood and adolescence due to physiological changes and social interactions influenced by the adolescent's development and environment(Reference Wang, Bentley and Zhai8, Reference Story, Neumark-Sztainer and French10, Reference Due, Krolner and Rasmussen11). Investigating eating behaviours in children longitudinally during the transition into adolescence is recommended in order to provide important information on when, how and why dietary changes occur(Reference Moreno, Rodriguez and Fleta2, Reference Lytle, Seifert and Greenstein6, Reference Cutler, Flood and Hannan12, Reference Resnicow, Smith and Baranowski13). This will in turn enable the development of strategies for interventions(Reference Lake, Mathers and Rugg-Gunn14, Reference de Vet, de Ridder and de Wit15) and then further influence future health.
The concept of tracking is used in epidemiology literature to describe the longitudinal development of variables(Reference Twisk, Kemper and Mellenbergh16) and is generally used to indicate the risk of future diseases in subjects at an early age(Reference Twisk17). Dietary tracking can be defined as the relative stability of dietary habits over time(Reference Mikkila, Rasanen and Raitakari7) or the maintenance of relative position in rank of dietary behaviours over time(Reference Kelder, Perry and Klepp4). The existence of dietary tracking from adolescence to adulthood has been reported in several studies(Reference Lien, Lytle and Klepp5, Reference Lake, Mathers and Rugg-Gunn14, Reference Kvaavik, Andersen and Klepp18–Reference te Velde, Twisk and Brug20), but relatively few previous longitudinal studies have reported on dietary tracking in children during the transition into adolescence(Reference Wang, Bentley and Zhai8, Reference Li and Wang21, Reference Patterson, Warnberg and Kearney22). Wang et al.(Reference Wang, Bentley and Zhai8) found tracking of fruits and vegetables in Chinese children with a mean age of 9 years at baseline and followed up after 6 years. Patterson et al.(Reference Patterson, Warnberg and Kearney22) showed slight tracking coefficients for most food groups in Swedish children of average age 10 years at baseline and followed up 6 years later. However, the intake data were based on one 24 h recall at each time point, which may influence foods that are not consumed on a daily basis. There are limited studies focusing on the tracking of energy-dense and sugary foods over time(Reference Pearson, Salmon and Campbell23).
Parents play an important role in shaping the dietary habits of their children by determining what foods are available and how foods are prepared in the home(Reference Larson and Story24, Reference Swinburn, Caterson and Seidell25). Moreover, socio-economic status (SES) has been shown to be a strong determinant of children's and adolescents’ dietary intake(Reference Rasmussen, Krolner and Klepp26–Reference Bjelland, Lien and Grydeland28). Little research has investigated home environmental factors that may influence changes or predict the tracking of dietary behaviours from childhood to adolescence(Reference Wang, Bentley and Zhai8, Reference Story, Neumark-Sztainer and French10, Reference Pearson, Ball and Crawford29). Social inequalities related to the tracking of adolescents’ health behaviours are of importance in order to investigate unequal distributions of health, but few studies have investigated the influence of SES on tracking of dietary behaviours in adolescence(Reference Due, Krolner and Rasmussen11). Wang et al.(Reference Wang, Bentley and Zhai8) indicated that urban–rural residence, family income and mother's education were important predictors of dietary tracking among Chinese children and adolescents.
The purpose of the present study was to investigate changes and tracking of dietary behaviours in a group of Norwegian 11-year-olds over a time period of 20 months. Moreover, the aim was to examine the associations between parental education and dietary tracking in children during the transition into adolescence.
Materials and methods
Participants and study design
The HEalth In Adolescents (HEIA) study is a school-based group-randomized controlled survey, designed to promote healthy weight development through dietary behaviours and physical activity. A total of 177 public schools were invited to take part in the HEIA study, resulting in thirty-seven participating schools situated in seven counties surrounding Oslo, Norway. Approval for the study was obtained from the Regional Committees for Medical Research Ethics and the Norwegian Social Science Data Service. The design and methodology are described in detail elsewhere(Reference Lien, Bjelland and Bergh30).
The HEIA cohort study consists of data collected from twenty-five control schools in the HEIA study. All 6th graders from the control schools were invited to participate, resulting in a HEIA cohort of 1381 adolescents. At the baseline survey (T0) in September 2007, 975 (71 %) of these adolescents participated. In May 2008, 970 (70 %) participants attended the first follow-up (T1), and 20 months after attendance at T0, 945 (68 %) adolescents participated at the second follow-up (T2), during May 2009. For the purpose of the present paper, only participants attending all three time points were included in the analyses, resulting in a total sample of 885 (64 %) adolescents with the mean age of 11·2 (sd 0·3) years at T0.
Data collection
Informed consents were collected from parents or legal guardians (hereafter called ‘parents’) and included questions on parents’ education. Internet-based questionnaires were filled in during school hours at three time points, taking about 45 min to complete. The questionnaires assessed dietary and physical activity behaviours and their determinants by mostly pre-coded answer categories; the dietary variables investigated were fruits, vegetables, snacks and the intake of beverages. Trained staff was available during all data collection sessions, collecting anthropometric measurements at T0 and T2.
Variables
Intake of fruits was assessed by one question and intakes of raw and cooked vegetables were assessed by two questions asking for frequency of usual intake. Frequencies were measured by eight categories; from never/seldom to three or more times daily. Sweet (candies and chocolate) and salty (chips and popcorn) snacks was assessed by two questions asking for frequency of usual intake, measured by seven categories; from never/seldom to two or more times daily. All variables were recoded into frequency of intake per week by using the midpoints of categories (i.e. making 1–2 times/week equal 1·5 times/week). Intake of vegetables was calculated from the sum of raw and cooked vegetables, and intake of snacks was calculated from the sum of sweet and salty snacks.
Usual consumption of sugar-sweetened beverages (SSB), as carbonated sugar-sweetened soft drinks (hereafter called ‘soft drinks’) and squash (defined as sugar-sweetened concentrates of fruit and berries), was calculated as decilitres per week from the sum of five weekdays and two weekend days. During weekdays the consumption of soft drinks and squash was assessed by frequency (six categories; from never/seldom to every weekday) and amount in glasses for each occasion (four categories; from one glass to four glasses or more). For weekends the consumption was measured by the total number of glasses over both days (eight categories; from never/seldom to seven glasses or more). It was stated in the questionnaire that 0·5 litre of beverage equalled three glasses, making one glass equal to 1·67 dl.
Parental education was categorized into three levels: low (≤12 years), medium (13–16 years) and high (>16 years), based on categories from Statistics Norway. Values from the parent with the longest education level were used, or else from the one available. Both parents’ education levels were reported for 81 % of these adolescents. BMI was calculated from anthropometric measurements of height and weight.
A separate test–retest study among 6th graders (n 114) from the same sampling area as the main study was conducted prior to baseline data collection. The self-reported measures for fruits, vegetables, snacks, soft drinks and squash obtained acceptable to good values (Spearman's ρ = 0·49–0·78; data not shown).
Data analysis
All statistical analyses were performed using the statistical software package IBM® SPSS® Statistics version 18·0 (IBM Corp.). Mean differences in characteristics at T0 between participants and drop-outs were tested with the independent-sample t test for demographic variables and dietary behaviours. The cluster effect for each of the behavioural variables was tested by using linear mixed models. Only 0·3–5·6 % of the unexplained variance in the behaviours was shown to be at the group level, and therefore multilevel analyses were not performed(Reference Heck, Thomas and Tabata31). One-way ANOVA was used to investigate the difference between dietary behaviours and level of parental education at T0. Significant differences in dietary intake between time points were assessed using one-way repeated-measures ANOVA with Bonferroni correction of multiple testing.
Several methods were used to describe the tracking of dietary behaviours over time. First, tracking patterns were illustrated as consumers’ relative position in rank by mean dietary intakes at T0, T1 and T2 in groups of low, medium and high consumption at T0. Intakes of fruits and vegetables were categorized as low (<5), medium (5–13) or high (≥14) consumption in times per week. Snack intake was similarly categorized into low (≤2), medium (3) or high (≥4) consumption in times per week. Soft drinks and squash were categorized based on intake in decilitres per week, into low (0), medium (≤7 but >0) or high (>7) consumption. Grouping of variables was based on weekly intake and the Norwegian dietary guidelines. Between-group differences at each time point were calculated using one-way ANOVA with Bonferroni correction of multiple testing. Second, stability and change in dietary behaviours from T0 to T2 was assessed from cross-tabulation of intake patterns at T0 and T2. Stability was shown by the percentage of individuals remaining in the same group of consumption at both time points and change was presented by percentages of decrease or increase in consumption over time. Third, Cohen's kappa was used as tracking coefficients to test the agreement between each individual's relative position in rank from T0 to T2. Kappa values were weighted (κ w) to take into account their squared position of concordance between groups(Reference Cohen32). Because this command was currently unavailable in SPSS, the available command syntax for SPSS from the IBM® webpage was used(33). Cut-offs suggested by Landis and Koch(Reference Landis and Koch34) were used for the interpretation of kappa values.
Multinomial logistic regression analyses were performed to assess the association between level of parental education and the tracking of each of the dietary variables from T0 to T2. For the purpose of these analyses differences between stable high consumers and stable low consumers were of interest, hence a variable of four tracking groups was made. Tracking groups indicating stability were spilt into those who maintained a stable low (low and medium consumption groups) or a stable high (high consumption group) intake at both T0 and T2. Tracking groups indicating change were kept as participants who either increased or decreased their consumption between these time points. A stable high intake was the reference category for the dependent variable, and a low level of education was the reference category for the independent variable.
Results
Mean age of participating boys (n 466) and girls (n 419) was 11·2, 11·9 and 12·9 years for both genders at T0, T1 and T2, respectively. Attrition analysis showed no significant differences in the demographic variables gender, age, BMI and parental education, or in dietary behaviours at T0, between the sample of adolescents included in the present paper and those excluded (n 90) due to lack of participation at all three time points (data not shown).
Changes in dietary intake
The intake of soft drinks increased significantly over time, by 0·9 and 0·7 dl/week among boys and girls, respectively, from T0 to T2 (Table 1). No significant changes were seen for the intake of soft drinks between T0 and T1, or for the intake of fruits, vegetables, snacks or squash between T0 and T1 or between T0 and T2.
Table 1 Means and changes of dietary behaviours according to gender in Norwegian 11-year-olds, HEalth In Adolescents (HEIA) cohort study
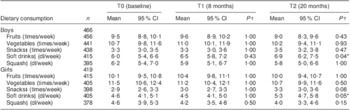
*P < 0·05.
†P value for the significance of the difference from T0 by one-way repeated-measures ANOVA.
‡Sweet candies and chocolate, salty chips and popcorn snacks.
§Carbonated soft drinks with sugar, non-carbonated squash with sugar.
Tracking patterns and stability
Adolescents kept their relative position in rank over time when grouped by dietary intake at T0, except for girls’ intake of fruits and boys’ intake of snacks (Fig. 1(a) to (j)). Low and medium consumers of fruits among girls at T2 were no longer statistically different, neither were low and medium consumers of snacks among boys at T1 or T2. A tendency of regression towards the mean was generally observed, as group means seemed to converge towards the distribution of the middle group.
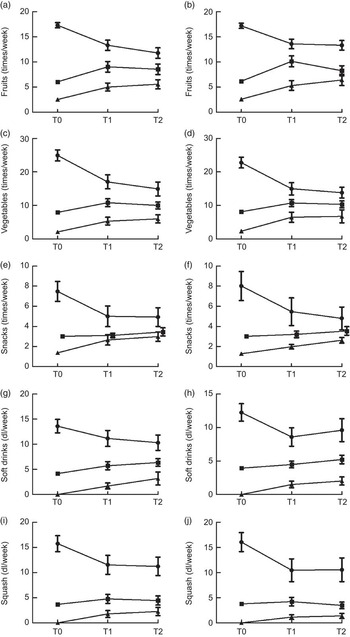
Fig. 1 Tracking patterns in Norwegian 11-year-olds, HEalth In Adolescents (HEIA) cohort study. Mean dietary intakes, with their 95 % confidence intervals represented by vertical bars, in consumption groups ( $$$$
, high;
$$$$
, high;  $$$$
, medium;
$$$$
, medium;  $$$$
, low) at baseline (T0), followed up after 8 months (T1) and 20 months (T2): (a) boys (n 456); (b) girls (n 415); (c) boys (n 441); (d) girls (n 405); (e) boys (n 438); (f) girls (n 398); (g) boys (n 415); (h) girls (n 405); (i) boys (n 395); (j) girls (n 378). Intake categories (times/week) for fruits and vegetables: high, ≥14; medium, 5–13; low, <5. Intake categories (times/week) for snacks: high, ≥4; medium, 3; low, ≤2. Intake categories (dl/week) for soft drinks and squash: high, >7; medium, ≤7 but >0; low, 0
$$$$
, low) at baseline (T0), followed up after 8 months (T1) and 20 months (T2): (a) boys (n 456); (b) girls (n 415); (c) boys (n 441); (d) girls (n 405); (e) boys (n 438); (f) girls (n 398); (g) boys (n 415); (h) girls (n 405); (i) boys (n 395); (j) girls (n 378). Intake categories (times/week) for fruits and vegetables: high, ≥14; medium, 5–13; low, <5. Intake categories (times/week) for snacks: high, ≥4; medium, 3; low, ≤2. Intake categories (dl/week) for soft drinks and squash: high, >7; medium, ≤7 but >0; low, 0
Tables 2 and 3 present the proportion of stability in dietary behaviours between T0 and T2, based on groups of low, medium and high consumption, for boys and girls, respectively. The highest proportion of stability was seen for the intake of squash in both genders. The largest changes were seen for the intake of fruits among boys and snacks among boys and girls, where more than 50 % changed their dietary behaviour by either decreasing or increasing intake over time.
Table 2 Proportion of stability and tracking coefficients in Norwegian 11-year-old boys (n 466), HEalth In Adolescents (HEIA) cohort study
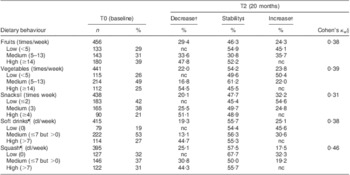
nc, no changes as increase/decrease of behaviour possible.
†Proportion of individuals’ behavioural change as decreased or increased dietary intake from T0 to T2.
‡Proportion of individuals’ unchanged behaviour as stable dietary intake from T0 to T2.
§Tracking coefficient of weighted Cohen's kappa.
∥Sweet candies and chocolate, salty chips and popcorn snacks.
¶Carbonated soft drinks with sugar, non-carbonated squash with sugar.
Table 3 Proportion of stability and tracking coefficients in Norwegian 11-year-old girls (n 419), HEalth In Adolescents (HEIA) cohort study
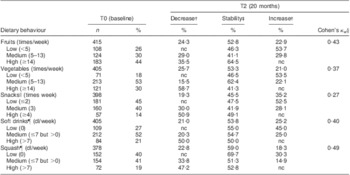
nc, no changes as increase/decrease of behaviour possible.
†Proportion of individuals’ behavioural change as decreased or increased dietary intake from T0 to T2.
‡Proportion of individuals’ unchanged behaviour as stable dietary intake from T0 to T2.
§Tracking coefficient of weighted Cohen's kappa.
∥Sweet candies and chocolate, salty chips and popcorn snacks.
¶Carbonated soft drinks with sugar, non-carbonated squash with sugar.
Tracking coefficients
Tracking coefficients measured by Cohen's kappa indicated fair tracking of fruits, vegetables, snacks and soft drinks, and moderate tracking of squash, in boys (Table 2). Fair tracking coefficients of vegetables and snacks and moderate tracking coefficients of fruits, soft drinks and squash were seen in girls (Table 3). The lowest tracking coefficient was observed for the intake of snacks and the highest tracking coefficient was observed for the intake of squash, in both genders.
Parental education and adolescents’ dietary tracking
Parental education was given by 865 (98 %) of the parents at T0, of whom 30 % were categorized at the low level, 35 % at the medium level and 32 % at the high level of parental education (data not shown). At T0 significant negative differences were observed between level of parental education and the intake of soft drinks (P < 0·01 in boys and girls) and squash (P = 0·01 in boys and P = 0·02 in girls). However, no such differences were seen for the intake of fruits, vegetables or snacks (data not shown).
Boys and girls with parents of high education had higher odds of a stable low intake of soft drinks (OR = 3·92, 95 % CI 1·80, 8·53, P < 0·01 in boys and OR = 2·64, 95 % CI 1·11, 6·29, P < 0·05 in girls) and squash (OR = 3·00, 95 % CI 1·35, 6·64, P < 0·01 in boys and OR = 2·95, 95 % CI 1·13, 7·69, P < 0·05 in girls), when compared with those with parents of low education (Table 4). Boys of parents with a medium level of education had higher odds of a stable low intake of soft drinks (OR = 2·24, 95 % CI 1·12, 4·51, P = 0·02) when compared with those having parents with a low parental education level (data not shown). No significant associations were seen between parental education level and adolescents’ tracking of fruits, vegetables or snacks.
Table 4 Associations between 20 months of dietary tracking and level of parental education (PE) according to gender in Norwegian 11-year-olds, HEalth In Adolescents (HEIA) cohort study
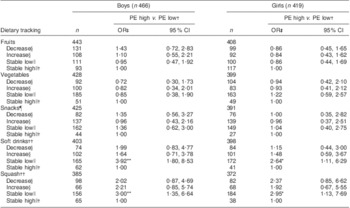
*P < 0·05, **P < 0·01.
†Reference group.
‡OR and 95 % CI obtained by multinomial logistic regression.
§Proportion of individuals’ behavioural change as decreased or increased dietary intake from T0 to T2.
∥Proportion of individuals’ unchanged behaviour as stable low or high dietary intake from T0 to T2.
¶Sweet candies and chocolate, salty chips and popcorn snacks.
††Carbonated soft drinks with sugar, non-carbonated squash with sugar.
Discussion
Childhood and adolescence are key periods in life for the development of long-lasting dietary behaviours. The current study adds to the limited knowledge regarding tracking patterns of snacks, soft drinks and squash in children during the transition into adolescence. The study found associations between having parents of a high education level and consuming a stable low intake of soft drinks and squash between the ages of 11 to 13 years, when compared with participants having parents of a lower level of education.
Our findings showed a non-significant decrease in the intake of fruits and vegetables between ages 11 and 13 years. These results are comparable with other studies published on young adolescents’ intake of fruits and vegetables over time(Reference van der Sluis, Lien and Twisk3, Reference Pearson, Ball and Crawford29). Tracking coefficients of fruits and vegetables indicated that adolescents maintained fair to moderate tracking of fruits and vegetables from T0 to T2. Similar stability was shown for the consumption of vegetables at dinner in Norwegian 12-year-olds, measured over a time period of 3 years(Reference Vejrup, Lien and Klepp35). Slight to fair tracking coefficients have been reported previously for the intake of fruits and vegetables in adolescents of this age(Reference Wang, Bentley and Zhai8, Reference Patterson, Warnberg and Kearney22). Overall, a larger proportion of females than of males maintained a stable intake of fruits of ≥14 times/week.
No significant changes were seen for the mean weekly intake of snacks among boys and girls during the period of 20 months. This has also been observed by others(Reference van der Sluis, Lien and Twisk3, Reference Lytle, Seifert and Greenstein6, Reference Pearson, Ball and Crawford29), although comparisons in the intake of snacks were challenging because of the differences in definitions between studies. Tracking patterns of snack intake showed that girls kept their relative position in rank over time, when grouped by consumption level at T0. There were no significant differences between low and medium consumption groups among boys at T1 and T2, indicating that boys did not keep their relative position in rank for the intake of snacks over time. Tracking coefficients of adolescents’ snack intake showed fair tracking in both genders from T0 to T2. Earlier findings on the tracking of snacks in adolescents of this age group were inconsistent(Reference Li and Wang21, Reference Patterson, Warnberg and Kearney22). In our study narrow confidence intervals were generally seen between consumption groups, indicating consistent results for the intake of snacks over time. In relation to tracking, this may further have increased the possibility of changes between groups.
A significant increase in mean soft drink consumption was observed among boys and girls from T0 to T2, simultaneously with a non-significant decline in the intake of squash. There are few longitudinal studies reporting on the trends of soft drink and squash consumption separately, which makes it difficult to conclude on intake patterns based on earlier findings. However, Lytle et al.(Reference Lytle, Seifert and Greenstein6) found a significant increase in the consumption of soft drinks and fruit drinks among students going from 5th to 8th grade. A significant increase in adolescents’ soft drink intake was reported by others(Reference van der Sluis, Lien and Twisk3, Reference Libuda, Alexy and Sichert-Hellert36), although the definition of soft drinks varies between studies. Tracking coefficients for the intake of soft drinks and squash indicated that adolescents maintained fair to moderate tracking over a period of 20 months. Stability was seen among 56 % of soft drink consumers and 58 % of squash consumers in boys; for girls stability was seen among 54 % and 59 %, respectively. The one study found to report on tracking of SSB in adolescents of this age found slight tracking (κ w = 0·07) for the consumption of sweetened drinks during a period of 6 years(Reference Patterson, Warnberg and Kearney22), although results were obtained with methodological differences. Our results suggest that the intakes of soft drinks and squash track well in this age group, and interventions that reduce intake are therefore encouraged to start at an early age.
The overall small changes and the fair to moderate tracking observed in dietary behaviours from the age of 11 to 13 years in the present study may be anticipated, because in general we expect small changes in the home or school environment during this time period. However, a significant increase in the intake of soft drinks was observed, and this could be due to, for instance, personal maturation and higher accessibility to money. The adolescents may be more independent in their preferences at the age of 13 years, and the amount of pocket money may have increased allowing the adolescents to buy what they want.
Adolescents with lower levels of SES have been found to have poorer diets than adolescents with higher levels of SES(Reference Rasmussen, Krolner and Klepp26, Reference Hanson and Chen37). However, such relationships have not conclusively been demonstrated among younger children(Reference de Vet, de Ridder and de Wit15). In our study, significant differences were seen between level of parental education and the intakes of soft drinks and squash at T0. No such differences were observed for the intake of fruits or vegetables, as already reported and discussed in the HEIA intervention study(Reference Bjelland, Lien and Grydeland28), neither for the intake of snacks. Adolescents having parents with a higher level of education had higher odds of consuming a stable low intake of soft drinks and squash, when compared with having parents with a low level of education. The results imply that inequalities in parental education were maintained in adolescents’ consumption of soft drinks and squash from the age of 11 to 13 years. No such associations were seen between level of parental education and adolescents’ tracking of fruits, vegetables or snacks. Inconsistent results were shown earlier by Wang et al.(Reference Wang, Bentley and Zhai8), who found that mothers with a higher education level predicted a stable high intake of fruit and vegetables in Chinese children and adolescents. More studies are needed in order to conclude on the association between parental education and tracking of dietary behaviours in children during the transition into adolescence.
Changes in energy balance-related behaviours may occur during key life stages such as children growing into adolescence. Knowledge about the determinants of such change is important in the prevention of non-communicable diseases(Reference Brug, Kremers and Lenthe38); however, few studies have examined the determinants of change in adolescents’ dietary behaviours longitudinally(Reference Pearson, Ball and Crawford29, Reference Ezendam, Evans and Stigler39). Previous studies show that availability/accessibility, parental intake/modelling and preferences all seem to be strong determinants of children's and adolescents’ consumption of SSB(Reference Bjelland, Lien and Grydeland28, Reference Grimm, Harnack and Story40–Reference Verloigne, Van Lippevelde and Maes42). Further studies should investigate the determinants of adolescents’ change in soft drink intake longitudinally.
There are some general methodological aspects to be aware of when doing tracking analysis. Our results of dietary tracking patterns showed that most adolescents kept their relative position in rank over time, when grouped on consumption level at T0. By introducing cut-offs on continuous variables, it is however important to notice that some information will be lost when the outcome variables are grouped(Reference Twisk43). A tendency of regression towards the mean was observed in these analyses, which may partially be caused by changes in extreme values when repeating observations, as well as by individual changes over time. Moreover, tracking coefficients indicated fair to moderate tracking of dietary behaviours during this period of 20 months. As reported by Twisk(Reference Twisk17), it is important to take into account the fact that a high tracking coefficient during a short period of time does not necessarily indicate more tracking than a modest tracking coefficient during a long time span, when comparing the results.
These results should be viewed in light of some limitations. While the participation rate of sampled schools was 21 % in the present study, the participation rate among invited adolescents in the participating schools was high across time points. Furthermore, participating schools were from all counties targeted by the HEIA study. Thus we do not believe that adolescents’ dietary tracking patterns were influenced by low participation at the school level. Data collection was based on self-reported measures of FFQ, which may raise possible challenges due to misreporting of dietary intake. However, the questionnaire obtained moderate to high test–retest correlations, indicating reliability of the results. The questions on dietary behaviours used in the HEIA questionnaire have previously been validated in another study within the same age group(Reference Lillegaard, Overby and Andersen44). Dietary behaviours only measuring intake by frequencies may be a limitation to the study, but an earlier validation study showed that increasing frequency of intake corresponded with increasing amount of intake measured by a pre-coded food diary(Reference Lillegaard, Overby and Andersen44). Finally, tracking is influenced by the duration of follow-up, and differences in parental education are not necessarily disclosed in the context of dietary tracking during 20 months. Nevertheless, the transition period between childhood and adolescence is a critical period during which rapid changes are expected to occur.
Strengths of the present study were the longitudinal study design based on a relatively large sample size at a narrow age range, with a high participation rate over time. Furthermore, drop-out analysis showed that individuals lost to follow-up did not differ significantly from the included participants in demographic variables or dietary intakes. Additional strengths were the use of multiple methods to describe tracking patterns over time. Parental education was collected for this purpose from the parents of the adolescents, which reduced both the problem of measurement error and the tendency of missing data. In our study both healthy and unhealthy dietary behaviours were investigated, giving the possibility to look at diverse dietary behaviours of children during the transition into adolescence.
Conclusion
The study showed that a number of dietary behaviours in this population of Norwegian schoolchildren track between the ages of 11 and 13 years. Promotion of healthy dietary behaviours at an earlier age is important in order to prevent the establishment of unfavourable dietary behaviours later in adolescence. Our study indicated that interventions should have a particular focus on adolescents from families with low parental education and their consumption of SSB.
Acknowledgements
This project was funded by the Norwegian Extra Foundation for Health and Rehabilitation through the National Association of Public Health. The HEIA study was originally supported by the Norwegian Research Council (grant number 155323/V50) with supplementary funds from the Throne Holst Nutrition Research Foundation, the University of Oslo and the Norwegian School of Sport Sciences. All authors declare that they have no conflicts of interest. T.H.T. drafted the first manuscript, conducted the statistical analyses and made the greatest contribution to the paper. L.F.A., N.L., M.B., M.G., I.H.B. and K.I.K. participated in designing the study, project planning and data collection. All authors have critically read and revised the paper, and approved the final version of the manuscript. The authors would like to thank all the participants who took part in this study, as well as the project staff.


