The prevalence of obesity has been increasing progressively across the globe( 1 ) and excess body weight as a risk factor for mortality and morbidity from a number of diseases, including type 2 diabetes, CVD, hypertension, gallstones, musculoskeletal disorders and certain cancers, causing nearly 3 million deaths every year worldwide, is well documented( 1 – Reference Finucane, Stevens and Cowan 3 ). Worldwide, at least 2·8 million people die each year as a result of being overweight or obese and an estimated 35·8 million (2·3 %) of global disability-affected life years are caused by overweight or obesity( 2 ). The worldwide prevalence of obesity more than doubled between 1980 and 2008. In 2008, 10 % of men and 14 % of women globally were obese (BMI ≥ 30·0 kg/m2), compared with 5 % for men and 8 % for women in 1980. Currently, an estimated 205 million men and 297 million women over the age of 20 years are obese – a total of more than half a billion adults worldwide( Reference Finucane, Stevens and Cowan 3 ). Even in countries like India, which are typically known for a high prevalence of undernutrition, a significant proportion of overweight and obese people now coexists with those who are undernourished( Reference Popkin 4 ). Most recent data available from India show that overweight and obesity together among women is 12·6 % and almost similar percentages of underweight and overweight women coexist in urban India (25·0 % underweight and 23·5 % overweight or obese)( 5 ). In the light of the increase in population weight, it is worthwhile to examine the issue of perceptions and actions around weight and weight control more specifically among adult women in India, who suffer the largest weight gain as compared with men( 5 ).
Research in developed countries has shown it is not just that some underweight people feel they are fat( Reference Pritchard, King and Czajka-Narins 6 ), but also that many overweight people are unaware that their body weight is too high( Reference Wardle and Griffith 7 – Reference Chang and Christakis 9 ). Inappropriate body-shape desire might predispose individuals to unhealthy weight-loss or weight-gain behaviours( Reference Cheung, Lee and Ho 10 ). In developed countries, a thin body is an ideal and preferred among females( Reference Emslie, Hunt and Macintyre 11 ); however, in developing countries, a heavier body is more desirable although there is a shift towards a thin body among people of higher class in countries of the Middle East( Reference Khawaja and Afifi-Soweid 12 ). Recognizing overweight is one step on the way to implementing changes in diet and physical activity; the next stage is trying to lose weight. The self-perception of weight appropriateness is thus an important component of eating and weight-management behaviours( Reference Chang and Christakis 9 ). Self-perceived weight status, however, is not fully explained by objective weight status. Weight behaviours are multifaceted and complex, and their aetiology is multifactorial( Reference Cheung, Ip and Lam 13 ). Self-perception of weight is one of the motivating factors for weight-control behaviours( Reference Cash and Pruzinsky 14 ) and is a better predictor of actual weight than diet or exercise( Reference Desmond, Price and Gray 15 ).
For preventing and reducing excessive weight, realistic perception and self-awareness of own body weight is essential. Inaccurate recognition of weight status is a threat to healthy weight management. Inaccurate body-size perceptions may influence compliance to dietary and lifestyle advice. Although body-weight perception studies are abundant in developed countries and form an important research basis for weight-management behaviour and programmes, in developing country such as India, where 13 % of adult women are either overweight or obese( 5 ), body-weight perception has been hardly studied. In the present paper we examine the socio-economic differential in self-perception about body weight, future intention for weight management and actual weight-management behaviour among normal-weight, overweight and obese women in a community-based follow-up study in the national capital territory of Delhi, representing urban India.
Methods
Study location and population
The present paper utilizes data collected for the doctoral dissertation of the first author( Reference Agrawal 16 ). Full details of the study have been presented elsewhere( Reference Agrawal 16 ). Briefly, during May–June 2003, a follow-up survey was carried out in the national capital territory of Delhi using the same sample derived from the National Family Health Survey-2 (NFHS-2) conducted during 1998–99. Delhi – which has a heterogeneous, multicultural population representative of the Indian urban scenario – was chosen as the preferred location for this study. NFHS-2 collected demographic, socio-economic and health information from a nationally representative sample of 90 303 ever-married women aged 15–49 years in all states of India (except the union territories), covering more than 99 % of the country's population with a response rate of 98 %. Details of the sample design, including the sampling frame, are provided in the national survey report( 17 ).
From the 1998–99 NFHS-2 Delhi samples, 325 women aged 15–49 years, chosen systematically, were re-interviewed in a follow-up survey after four years in 2003 using an interview schedule. Their weights and heights were again recorded in the follow-up study by the researcher (using the same equipment as used in NFHS-2) to compute their current BMI. In addition to these measurements, detailed information was collected on their dietary habits and sedentary lifestyle behaviour along with other sociodemographic characteristics. Information on the woman's perception about her own weight and weight-management behaviour was also collected, which is the main response variable in the present paper.
Sample selection, response rate and sample size
Earlier studies on obesity in India and other developing countries have shown that overweight and obesity are predominant in urban areas and among women( Reference Agrawal 16 , Reference Agrawal 18 – Reference Shetty and James 25 ). Therefore, only urban primary sampling units were chosen for the follow-up survey in Delhi. The sample frame for the follow-up survey was fixed to include women in all BMI categories and literacy levels. The aim was to have a sample size of at least 300 women, 100 from each of the three BMI categories (normal weight, overweight and obese). At the time of revisit, several issues such as migration, change of address, non-response and non-availability of respondents tend to reduce the desired sample size. Potential loss during follow-up( Reference Montori and Guyatt 26 , Reference Altman 27 ) was dealt with by increasing the initial sample size (double that required) to get the desired sample size for the study.
In the NFHS-2 Delhi sample, 1117, 500 and 203 women were normal-weight, overweight and obese, respectively. In the NFHS-2 survey questionnaire respondents were asked, ‘Would you mind if we come again for a similar study at some future date after a year or so?’ Those women who objected to a revisit were excluded from the follow-up survey, and thus there remained 1050 normal-weight, 476 overweight and 177 obese women in the sampling frame. Samples were drawn from each of these three categories through systematic stratified random selection using a random number. From the normal BMI category, every fourth woman and from the overweight category every second woman was drawn. In the obese category all women were included in the sample to get the desired sample size. This resulted in selection of a total of 677 women: 262 of normal weight, 238 overweight and 177 obese. For the follow-up survey, the addresses of the selected women were obtained from the NFHS-2 Household Questionnaires. Sample size was further reduced due to non-availability of some questionnaires and non-identified addresses. Finally, a total of 595 women – 217 of normal weight, 227 overweight and 151 obese – were selected for the follow-up interview. Details of the sample selection and the response rate are illustrated in Fig. 1.
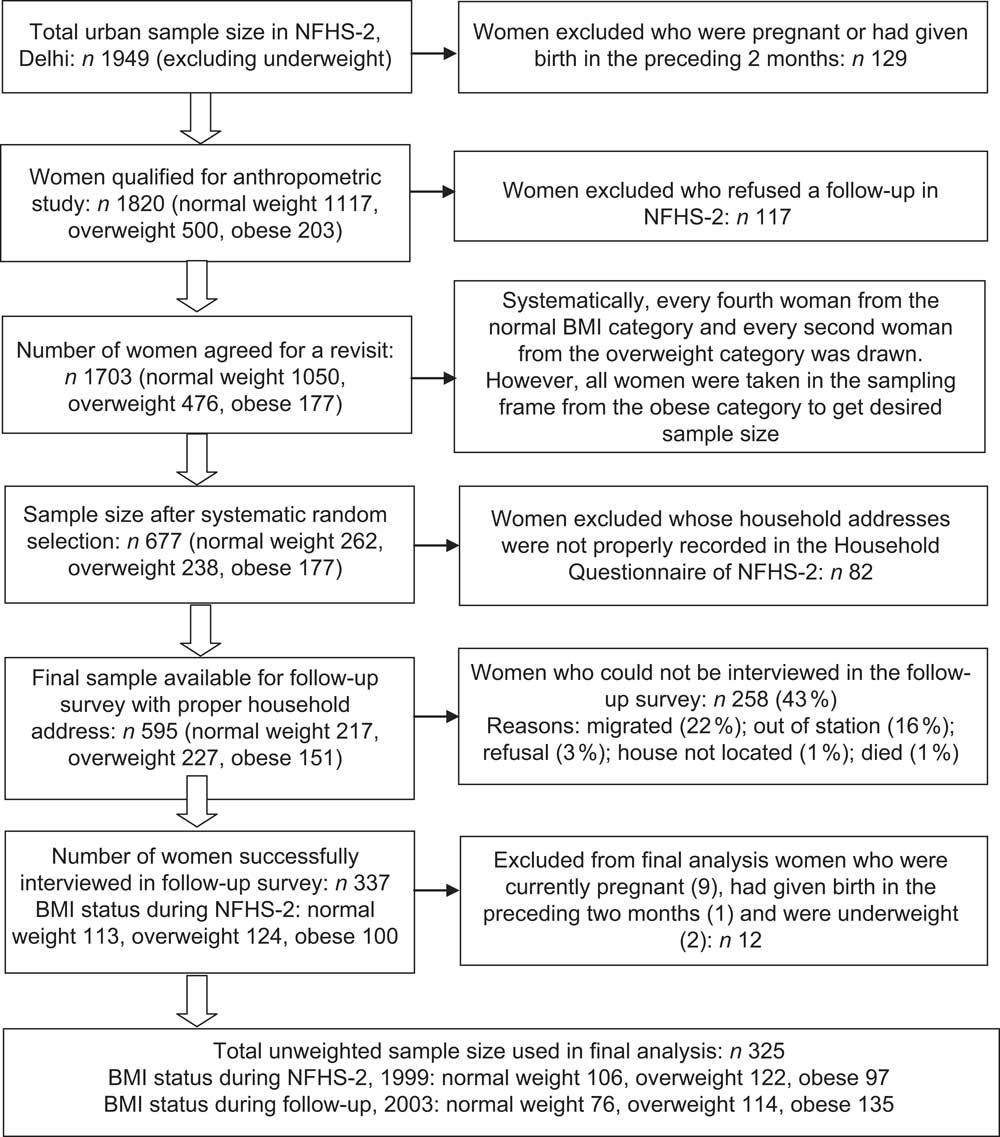
Fig. 1 Selection of sample in the follow-up survey and response rate
In the follow-up survey, 57 % of the eligible sample (337 women) was successfully interviewed: 113 normal-weight, 124 overweight and 100 obese women. Forty-three per cent of the sample (258 women) could not be interviewed because they were out of station (16 %), had migrated (22 %), their residence was not located (1 %), they had died (1 %) or refused an interview (3 %). Women who were pregnant (n 9) at the time of the follow-up survey, women who had given birth during the two months preceding the survey (n 2) and underweight women (n 1) have been excluded from the final analysis. Therefore, the findings are based on the remaining 325 respondents of the follow-up survey. A separate analysis using NFHS-2 data showed that the sociodemographic characteristics of those were interviewed and those could not be interviewed in the follow-up survey were similar (data not shown), indicating that the follow-up sample appears representative of the NFHS-2 sample population.
Anthropometric measurements
In NFHS-2 (executed by the field investigators) as well as in the follow-up survey (executed by the researcher), each ever-married woman was weighed in light clothes with shoes off using a solar-powered digital scale with an accuracy of ±100 g. Her height was also measured using an adjustable wooden measuring board, specifically designed to provide accurate measurements (to the nearest 0·1 cm) in a developing country field situation. These data were used to calculate the individual BMI for each woman. Practical and clinical definitions of overweight and obesity are based on the BMI, which is computed by dividing weight (in kilograms) by the square of height (in metres)( Reference Gopinath, Chadha and Jain 21 ). A woman with a BMI between 25·0 and 30·0 kg/m2 is considered to be overweight, a BMI of greater than 30·0 kg/m2 is considered to be obese. A woman with a BMI between 18·5 and 24·9 kg/m2 is considered to have normal weight, and if the BMI is below 18·5 kg/m2 the woman is considered to be underweight( 28 ).
Variables studied
To understand women's self-perception of their current body weight, a question was asked: ‘How do you feel about your current weight?’ The answer categories were: ‘I feel I am less than normal weight’ or ‘I feel I am normal weight’ or ‘I feel I am more than normal weight’. The question to understand future intention of weight management was: ‘If given a chance to you, would you prefer to reduce your weight or increase your weight or maintain as it is?’ Questions to understand actual action undertaken by women for weight management were: ‘Do you do any type of physical activity (moderate to intense) to reduce your weight?’ If the response was ‘yes’, then a supplementary question was asked: ‘How frequently do you do physical activity?’ This question was followed by: ‘What type of physical activity do you mainly do and how much time (in minutes) do you devote to that activity?’ The activity categories were: ‘brisk walking’, ‘jogging’, ‘running’, ‘yoga’, ‘going to the gymnasium’, ‘doing aerobics’, ‘swimming’, ‘cycling’ and ‘others’. Other questions on weight management were also asked of the respondent, such as questions on fasting (used synonymously as ‘dieting’; see Appendix 1 for an explanation of Indian women's fasting behaviour): ‘Do you keep a fast (at least for 24 h)?’. If the response was ‘yes’ another question followed: ‘How frequently you keep a fast?’ Based on responses to the above questions, self-perception, future intention to reduce weight and weight-management behaviour of the women were analysed in our study.
Characteristics of the respondents included as potential confounders in the study were: (i) levels of sedentary lifestyle (low, medium, high; see Appendix 2 for details); (ii) age group in years (20–29, 30–39, 40–54); (iii) women's education (illiterate, literate but less than middle school complete, middle school complete, high school complete and above); (iv) employment status (not working, working); (v) caste/tribe status (Scheduled caste/tribe, Other ‘deprived’ class, Others); (vi) religion (Hindu, Muslims, Sikh and others); (viii) household standard of living (low/medium, high); and (ix) media exposure (never reads newspapers, reads newspapers occasionally, reads newspapers daily). For a full definition of variables see Table 1.
Table 1 Characteristics of the study population (n 325) aged 20–54 years in the follow-up survey, Delhi, 2003
*Women who were pregnant at the time of the survey, or who had given birth during the two months preceding the survey, were excluded from these anthropometric measurements.
†Sedentary lifestyle was examined on the basis of the following questions, which were asked to every woman during the time of personal interview: (i) ‘Do you have any full-time or part-time maid in your house to help you?’ (ii) ‘Mostly who does the following household activities: sweeping and swabbing, cleaning of utensils, cooking, washing clothes, other household chores?’ (iii) ‘How much time do you devote to watching television during a normal day?’ A composite score for sedentary lifestyle was made based on the value assigned to indicators. Based on the mean and value of ±0·5 sd of the score value, the sedentary lifestyle index is categorized into three, as low, medium and high (see Appendix 2).
‡Illiterate = 0 years of education; literate but <middle school complete = 1–5 years of education; middle school complete = 6–8 years of education; high school complete or more = 9+ years of education.
§Buddhist, Christian, Jain, Jewish, Zoroastrian.
∥Scheduled castes and Scheduled tribes are identified by the Government of India as socially and economically ‘deprived’ and needing protection from social injustice and exploitation; Other ‘deprived’ class category is a diverse collection of intermediate castes that were considered low in the traditional caste hierarchy but are clearly above the Scheduled castes; ‘Others’ is a default residual group that enjoys higher status in the caste hierarchy.
¶Standard of living (SLI) was defined in terms of household assets and material possessions, which have been shown to be reliable and valid measures of household material well-being. It is an index which is based on ownership of a number of different consumer durables and other household items. It is calculated by adding the following scores. House type: 4 for pucca, 2 for semi pucca, 0 for kachha; toilet facility: 4 for own flush toilet, 2 for public or shared flush toilet or own pit toilet, 1 for shared or public pit toilet, 0 for no facility; source of lighting: 2 for electricity, 1 for kerosene, gas or oil, 0 for other source of lighting; main fuel for cooking: 2 for electricity, liquefied natural gas or biogas, 1 for coal, charcoal or kerosene, 0 for other fuel; source of drinking water: 2 for pipe, hand pump or well in residence/yard/plot, 1 for public tap, hand pump or well, 0 for other water source; separate room for cooking: 1 for yes, 0 for no; ownership of house: 2 for yes, 0 for no; ownership of agricultural land: 4 for 5 acres or more, 3 for 2·0–4·9 acres, 2 for less than 2 acres or acreage not known, 0 for no agricultural land; ownership of irrigated land: 2 if household owns at least some irrigated land, 0 for no irrigated land; ownership of livestock: 2 if own livestock, 0 if not own livestock; durable goods ownership: 4 for a car or tractor, 3 each for a moped/scooter/motorcycle, telephone, refrigerator or colour television, 2 each for a bicycle, electric fan, radio/transistor, sewing machine, black and white television, water pump, bullock cart or thresher, 1 each for a mattress, pressure cooker, chair, cot/bed, table or clock/watch. Index scores range from 0–14 for low SLI to 15–24 for medium SLI to 25–67 for high SLI.
Statistical methods
Data were analysed using descriptive statistics as well as multivariate methods. The association between overweight/obesity and self-perception of body weight, future intention to reduce weight and weight-management behaviour (such as doing physical activity or keeping a fast) was estimated using the multiple logistic regression method (see Appendix 3 for details on the implication of logistic regression) after controlling for socio-economic and demographic factors and examining for the independent effects of covariates. Because of re-sampling, the proportions of normal-weight, overweight and obese women collected in the follow-up data were not proportional to those in the actual population. To restore the NFHS-2 sample proportions, the follow-up survey data were assigned appropriate sample weights before the analysis (see Appendix 4 for sample weight calculation). All analyses were done using the statistical software package IBM SPSS Statistics version 19.
Ethical approval
The study received ethical approval from the International Institute for Population Science's Ethical Review Board. Informed consent was obtained from all respondents in both NFHS-2 and the follow-up survey before asking questions and before obtaining measurements of their height and weight. The analysis presented in the current paper is based on secondary analysis of the survey data with all identifying information removed.
Results
Characteristics of the study population
Table 1 presents the characteristics of the study population. Almost equal percentages of normal-weight (38·9 %) and overweight (36·8 %) women were found in our study sample while one in four was obese. One out of five women had a high level of sedentary lifestyle, more than one-third had a medium level whereas two out of five had a low level of sedentary lifestyle. Half of the respondents were aged 40 years and above and 14 % were under 30 years of age. The mean age of the respondents was 38·4 years. Nearly half of the study population (46 %) had completed high school education while one-fifth was illiterate. Over 80 % of the respondents were Hindu, the rest being Muslim, Sikh and others. Regarding caste/tribe distribution, Other castes were predominant (73 %), followed by Scheduled castes/tribes and Other ‘deprived’ class. More than three-quarters of the respondents belonged to households with a higher standard of living (SLI) whereas less than 22 % of women belonged to households with a medium or lower SLI. More than nine out of ten women were not working.
Women's self-perception of body weight and future intention for weight management according to BMI status and other characteristics
Women's self-perception of body weight and future intention for weight management according to BMI status and other characteristics are presented in Table 2. Compared with overweight women (73 %), a higher proportion of obese women (92 %) perceived their weight as more, while a quarter of overweight women and almost one in ten obese women perceived their weight as normal (P < 0·0001). A majority (86 %) of normal-weight women perceived their weight as normal, while 14 % overestimated their weight. Irrespective of their actual BMI, a high percentage of women (56 %) with a low sedentary lifestyle perceived their current weight as normal but three out of four women with a high sedentary lifestyle perceived their current weight as more (P < 0·0001). A majority of the illiterate women perceived their current weight as normal but a larger percentage of women with completed high-school education perceived their body weight as more (P < 0·0001). More women (69 %) belonging to the Scheduled caste/tribe category perceived their current weight as normal while a majority of women in the Others caste/tribe category perceived their current weight as more (P < 0·0001). Regarding media exposure, women who had never read a newspaper perceived their current weight as normal while women who read a newspaper daily perceived their weight as more (P < 0·0001).
Table 2 Self-perception about current weight and future intention for weight management among women according to their current BMI status and other selected characteristics, Delhi, India, 2003
*Only one case was found who perceived her weight as less.
†Only two cases were found who wanted to increase weight.
Considering the future intention of women on their weight management (Table 2), although a majority of overweight and obese women wanted to reduce their weight, quite a significant proportion of them (a quarter of overweight and 4 % of obese women) reported that they would like to maintain their weight as it is. Four out of five normal-weight women reported that they wanted to maintain or increase their current weight (P < 0·0001). A significant association of future intention to reduce weight was found with some of the women's socio-economic and demographic characteristics and media exposure. Four out of five women with a high sedentary lifestyle wanted to reduce their weight, but 17 % of them also reported wanting to maintain or increase their weight (P < 0·0001). Higher percentages of women who were educated to high school and above (79 %), belonged to the Other caste/tribe category (68 %), lived in a high SLI household (62 %) and read a newspaper daily (85 %) were found to have intention to reduce their weight rather than maintain or increase their weight. On the contrary, women who were illiterate, belonged to the Other ‘deprived’ class category and never a read newspaper reported wanting to maintain or increase their current weight rather than reduce their weight.
Both unadjusted and adjusted logistic regression results showed that women were significantly more likely to perceive their body weight as more if they read a newspaper daily (adjusted OR (AOR) = 8·78; 95 % CI 2·15, 37·97; P = 0·003) with reference to those who did not (Table 3). As expected, overweight (AOR = 3·11; 95 % CI 2·58, 8·65; P = 0·006) and obese (AOR = 4·29; 95 % CI 1·63, 12·80; P = 0·004) women were also more likely to perceive their body weight as more than normal-weight women. However, those working as compared with those not working were less likely (AOR = 0·21; 95 % CI 0·08, 0·71; P = 0·020) to perceive their body weight as more. No other characteristics of women were found to be significant in the adjusted analysis.
Table 3 Logistic regression results showing the adjusted effects (odds ratios with 95 % confidence intervals) of BMI and other characteristics on self-perception of present weight as more and future intention to reduce weight among women in Delhi, India, 2003
Dependent variable: self-perception of present weight as more, yes = 1, no = 0; future intention to reduce weight, yes = 1, no = 0.
*Ref., reference category.
Considering future intention to reduce weight, both unadjusted and adjusted logistic regression results showed that women were significantly more likely to have intention to reduce their weight if they read a newspaper daily (AOR = 16·38; 95 % CI 2·04, 25·26; P = 0·009) with reference to those who did not (Table 3). As expected, overweight (AOR = 10·93; 95 % CI 6·77, 41·35; P = 0·008) and obese (AOR = 13·69; 95 % CI 2·28, 79·42; P = 0·006) women were also more likely to have future intention to reduce weight than normal-weight women. Although education of the women showed an association with future intention to reduce weight, the association was attenuated in the adjusted analysis.
Actual weight management among women according to BMI status and other characteristics
Actual weight management was seen in terms of doing physical activity or keeping a fast. Overall, two out of five women were performing physical activity in order to reduce their weight and more than half of the women were keeping a fast; one out of three women were keeping a fast at least once weekly while 72 % of women reported that they keep a fast more than once weekly (data not shown). One in three overweight and one in four obese women were doing physical activity to reduce weight. Higher percentages of women with high school education and above, belonging to the Other caste/tribe category, belonging to a household with a high SLI and who read a newspaper daily were doing physical activity to reduce weight. A majority of Muslim and Hindu women were keeping a fast (data not shown). Multiple logistic regression results (adjusted) for physical activity showed that overweight (AOR = 6·07; 95 % CI 2·21, 16·59; P = 0·080) and obese (AOR = 3·17; 95 % CI 1·06, 9·78; P = 0·082) women were more likely to do physical activity than normal-weight women (Table 4). Unadjusted analysis showed that women educated to high school and above were more likely to report performing physical activity than illiterate women, but the association was attenuated in the adjusted analysis. However, except for caste/tribe status (Others category: AOR = 7·17; 95 % CI 1·72, 29·87), no other factors were found to be significant for keeping a fast, not even women's current BMI status.
Table 4 Logistic regression results showing the unadjusted and adjusted effects (odds ratios with 95 % confidence intervals) of BMI and other characteristics on physical activity and fasting among women in Delhi, India, 2003
Dependent variable: exercise, yes = 1, no = 0; fasting, yes = 1, no = 0.
*Ref., reference category.
Discussion
Our study systematically examined the associations between actual body-weight status, body-weight perception, weight-management intention and actual weight-management behaviour among adult married women in India. This is the first empirical evidence of this association in a developing country such as India which is facing an increasing level of obesity in its adult female population. Our results show that there was an inconsistency between self-perceived body weight and actual body weight among Indian women. Our findings also highlight that a considerable proportion of overweight women intended to maintain their weight. Other recent studies in Morocco and Seychelles also found a substantial proportion of overweight and obese women to underestimate their actual weight and wished to gain weight( Reference Lahmam, Baali and Hilali 29 , Reference Alwan, Viswanathan and Williams 30 ). This urgently needs to be corrected through public health messages.
The socio-economic position of women plays an important role in perceiving their body weight. Our study found that higher proportions of women perceive themselves as normal weight, despite being classified as overweight or obese, if they belong to households with a lower SLI or the Other ‘deprived’ class caste/tribe category, are not exposed to mass media, have a low education and a high sedentary lifestyle. Multivariate results for self-perception of women's body weight and weight-management behaviour substantiate that self-perception of body weight and actual weight-management behaviour of women were positively associated with their current BMI status, education and media exposure. Several studies in the West also showed that the perception about own body weight is influenced by several factors including culture and ethnicity( Reference Paeratakul, White and Williamson 31 ).
We found that women's present and future intention of weight management was directly related to their perception of current weight status. Actual weight-management behaviour in terms of doing physical activity and keeping a fast among overweight and obese women was limited to less than one-third of them. Our finding of substantial weight misperception among women in the reproductive age has several implications. First and most significant, there is a lower likelihood among overweight and obese women to practise healthy weight-loss behaviour. Second, there is a higher likelihood among normal-weight women not to maintain their weight and as a consequence they may become overweight and obese, increasing the burden of obesity problem which has already became a serious public health threat in India. Therefore, it is important to understand the magnitude of the weight-status distortion problem within the overweight range. The failure to accurately recognize own body-weight status may prevent women from changing behaviours that might in turn contribute to additional weight gain and to becoming medically obese.
Some strengths of our study deserve comment. First, our study is based in the national capital territory of Delhi which typifies a multicultural and multiethnic population representing India's growing urban scenario. Second, there is dearth of studies in India which examine self-perception of body weight among overweight and obese women taking representative data on anthropometric measures, which is exceptional in India. Our study used actual measured weights and heights without relying on self-reported values for these measures, which could otherwise be over- or underestimated. For these reasons our study is an important contribution to address this existing gap in knowledge in India.
Some limitations also deserve attention. Although rigorous methods, for example cross-checks and back-checks, were employed to achieve high-quality data, some measurement errors cannot be ruled out. This may partially explain the absence of a statistically significant association with some important factors such as education in our study. Second, although we adjusted for several key sociodemographic factors, there may be other potentially confounding characteristics and behaviours that may not have been measured in our study.
Conclusion
Our finding that a substantial proportion of overweight women wrongly perceived their weight as normal and wanted to maintain their weight is very important for public health interventions in obesity care. Considering the magnitude of the problem of overweight and obesity among women in India, health-promotion programmes should focus on the realistic perception of body weight among women which should be incorporated in the school curriculum itself. Effective strategies should be designed urgently for proper knowledge of correct body weight among all women, and among normal-weight and overweight women in particular. Implementation of health promotion and health education in the community should use effective school education and mass-media programmes to make women aware of their appropriate body weight, without falling into the danger of ‘generating body image dissatisfaction’, to combat the growing health problems associated with obesity among Indian women.
Acknowledgements
Sources of funding: S.A. is supported by a Wellcome Trust Strategic Award (grant no. Z/041825). Conflict of interest: All authors declared that they do not have any conflict of interest. Authors’ contributions: P.A. conceived and designed the study, analysed and interpreted the data, and wrote and drafted the manuscript; K.G. and V.M. helped in conceptualization of the study design and interpretation of the results; S.A. helped the data collection, data analysis and literature review, and reviewed the manuscript for important intellectual content.
Fasting in India
Keeping a fast is an integral part of the Indian culture and tradition. It basically connotes willingly abstaining oneself from eating certain or any kind of food, drink or both. It is known as Vrat in Indian households. The period of fasting also varies, i.e. it could be partial or prolong for 24 h. However, there are many others who keep a fast solely for maintaining good health. People also fast these days for health reasons, because fasting helps detoxify the body. In a medical context, fasting refers to the state achieved after digestion of a meal. A number of metabolic adjustments occur during fasting and many medical diagnostic tests are standardized to fasting conditions. Thus fasting has both religious and medical significance in India.
Appendix 2
Questions and weights given to each response and construction of sedentary lifestyle index
Distribution of sedentary lifestyle index along with cut-off points for levels, and overall mean and standard deviation of the score
Distribution of sedentary lifestyle levels (%) according to BMI category
Logistic regression
When the dependent variable is categorical, the logistic regression is preferred over the simple regression partly because it is easy to interpret the results and partly because it leads to a logit model that drives the relative likelihood of occurrence of the event of interest. The logistic regression is the most preferred type of regression, partly because it is comparatively easy to work with mathematically and partly because it leads to a model (the logit regression model) that is comparatively easy to interpret.
The basis form of logistic function is
 $$P\, = \,\frac{1}{{1\, + \,{{\rm{e}}^{ - z}} }},\eqno\rm$$
where z is the predictor variable and e is the base of the natural logarithm, equal to 2·71828, and P is an estimated probability. Now, subtracting 1 from both sides of equation (1) will give:
 $$1 - P\, = \,1 - \frac{1}{{1\, + \,{{\rm{e}}^{ - z}} }}\, = \,\frac{{{{\rm{e}}^{ - z}} }}{{1\, + \,{{\rm{e}}^{ - z}} }}.\eqno\rm$$
Dividing equation (1) by equation (2) we get:
 $$\frac{P}{{1 - P}}\, = \,{{\rm{e}}^{ - z}} .\eqno\rm$$
Taking the natural logarithm of both sides of equation (3) we get:
 $${\rm{Log}}\;\frac{P}{{1 - P}}\, = \,z,\eqno\rm$$
where P/(1 − P) is called the odds and the quantity log [P/(1 − P)] is called the log odds or the logit of P. Then equation (4) is rewritten as:
 $${\rm{Logit}}\;P\, = \,\log \;\frac{P}{{1 - P}}.\eqno\rm$$
Equation (1) is a logistic function. For multivariate purposes, we assume that z is a linear function of a set of explanatory variables, then:
 $$z\, = \,{{b}_0}\, + \,{{b}_1}{{x}_1}\, + \,{{b}_2}{{x}_2}\, + \, \cdots \, + \,{{b}_k}{{x}_k},\eqno\rm$$
where bk is the unknown coefficient to be estimated and xk is the attribute. Substituting equation (6) into equations (4) and (5) we get:
 $${\rm{Logit}}\;P\, = \,\log \;\frac{P}{{1 - P}}\, = \,{{b}_0} + {{b}_1}{{x}_1} + {{b}_2}{{x}_2} + \cdots \, + {{b}_k}{{x}_k}.\eqno\rm$$
The logistic regression equation estimates the effect of a one-unit change in the independent variable (when x is discrete) on the logarithm of odds (log-odds) that the dependent variable takes when controlled for the effects of other independent variables( Reference Retherford and Choe 32 – 34 ). The parameters in the logistic models were estimated using the maximum likelihood method. Further, the problems of multicollinearity associated with independent variables were taken into consideration before introducing them into the regression equations.
Appendix 4
Calculation of sample weights