


In recent decades, the increase in the prevalence of overweight and obesity has been dramatic in Denmark and in the rest of the world( Reference Bendixen, Holst and Sørensen 1 – 3 ). Predictions suggest that if this increase continues, 38 % of the world's adult population will be overweight and 20 % will be obese in 2030( Reference Kelly, Yang and Chen 4 ). Overweight and obesity are a major threat to public health due to their role in chronic diseases such as CVD, diabetes and several cancers. These diseases increase the risk of premature death, reduce life expectancy and affect the quality of life( 3 , Reference Stewart, Cutler and Rosen 5 ). Reversing the trend towards overweight and obesity is therefore a significant public heath challenge worldwide. If maintained, even a modest weight loss (5–10 % reduction in total body weight) in overweight and obese individuals is associated with health benefits. Even modest weight reductions can improve blood pressure, serum lipid levels and glucose tolerance, and they reduce the incidence of hypertension, hyperlipidaemia and diabetes in the population as a whole( Reference Orzano and Scott 6 , Reference Willett, Dietz and Colditz 7 ).
Self-perceived overweight status is reported to be positively associated with effective weight-control and weight-loss behaviour in adults( Reference Wardle and Johnson 8 – Reference Duncan, Wolin and Scharoun-Lee 13 ). Awareness of overweight is important, if people are to prevent increases in body weight and to achieve weight-loss goals by modifying diet and physical activity behaviour( Reference Wardle and Johnson 8 , Reference Wardle, Haase and Steptoe 9 , Reference Duncan, Wolin and Scharoun-Lee 13 , Reference Gregory, Blanck and Gillespie 14 ). Behaviour changes are largely motivated by perceived health risk( Reference Gregory, Blanck and Gillespie 14 , Reference Bleich 15 ). In many countries, the prevention and control of overweight and obesity are hampered by underestimation of body weight in the adult population( Reference Paeratakul, White and Williamson 16 – Reference Chuang and Lee 22 ). Weight misperception is of public health concern because it can result in large numbers of overweight and obese individuals failing to understand the need for weight control or losing weight. Overweight and obese individuals may not perceive their excess weight as a risk factor for chronic diseases that impair health and increase the risk of premature death( Reference Gregory, Blanck and Gillespie 14 , Reference Gregory, Blanck and Gillespie 23 ). This can limit the effectiveness of public health initiatives aimed at reducing excess weight in the population.
Little is known about the public perception of overweight and whether it has changed over time with the growing obesity epidemic( Reference Bleich 15 ). An increased or stable misperception of overweight has been reported in some countries in recent decades( Reference Johnson, Cooke and Croker 18 – Reference Chuang and Lee 22 , Reference Marques-Vidal, Melich-Cerveira and Marcelino 24 ). To our knowledge, however, no population-based studies have previously been conducted in Scandinavia to determine whether weight misperception has changed among overweight individuals with the increasing prevalence of overweight and obesity. Understanding the factors related to weight misperception may be of great importance in planning and implementing media campaigns and public health programmes aimed at correcting misperceptions and thereby reducing overweight in the population( Reference Miller, Schulz and Bibeau 25 ).
The aims of the present research were to examine changes in the prevalence of overweight and in weight misperception among overweight 15–75-year-old Danes in 1995, 2000–2004 and 2005–2008 and to identify factors associated with weight misperception in overweight individuals.
Methods
Study populations
The study populations comprised Danes who took part in the Danish National Survey of Diet and Physical Activity (DANSDA) in 1995, 2000–2004 and 2005–2008. DANSDA is a nationwide, representative cross-sectional survey that was conducted in three periods in 1995 (February, May and August) and then continuously in 2000–2004 and 2005–2008. The study sample comprised non-institutionalized, free-living Danish citizens retrieved from the Danish Civil Registration System. Foreign citizens who did not speak Danish, and people living in institutions or whose diets were prepared outside the home, were excluded from participation. After excluding pregnant and breast-feeding women, the study populations consisted in a total of 1714, 5660 and 2249 individuals aged 15–75 years in 1995, 2000–2004 and 2005–2008, respectively.
The DANSDA surveys were conducted in accordance with the guidelines laid down in the Declaration of Helsinki and were approved by the Danish Data Protection Agency. The Danish National Committee on Health Research Ethics decided that DANSDA did not require their approval. Verbal informed consent was obtained from all participants.
Measures
Information about the core variables, such as self-reported weight and height, and self-perception of overweight status, was obtained through personal face-to-face interviews, which were carried out by trained interviewers from PLS Consult (1995) and SFI Survey (2000–2004 and 2005–2008). Respondents reported whether they had any of the following chronic diet-related diseases: diabetes, hypertension, heart disease, stroke, hypercholesterolaemia, food allergy or overweight. Only the response on self-perception of overweight status is discussed in the present paper.
BMI was used as an indicator of body fat and calculated from self-reported weight and height, by dividing weight in kilograms by the square of height in metres (kg/m2). In accordance with WHO guidelines( 3 ), individuals with BMI of 25·0–29·9 kg/m2 were classified as overweight and individuals with BMI ≥ 30·0 kg/m2 were classified as obese. However, throughout the present paper, ‘overweight’ includes adults classified as ‘obese’ unless otherwise stated. Weight misperception was defined as present when overweight respondents did not perceive themselves as overweight.
Other variables
Information on gender, age, educational level, intention to eat healthily, leisure-time physical activity (last 12 months), smoking, self-rated health and survey year were included as covariates in the regression models to analyse factors associated with weight misperception.
Statistical analysis
Differences in categorical variables between survey periods were analysed by means of χ 2 tests and Z tests. The Z tests were adjusted using the Bonferroni correction. Only data from the two most recent surveys (2000–2004 and 2005–2008) could be used to identify factors associated with weight misperception, because the variable ‘self-rated health’ was not included in the data collected in 1995. Multiple logistic regression analysis was used to examine the association between weight misperception (misperceivers v. correct perceivers) and sociodemographic factors (gender; age (15–24 years, 25–44 years, 45–64 years, 65–75 years); educational level (<12 years, 12 years, 13 years practical, 13–14 years theoretical, 15–16 years, ≥17 years)); intention to eat healthily (‘never’, ‘occasionally’, ‘very often/often’); leisure-time physical activity (sedentary, light, moderate, vigorous); current smoking status (yes v. no); self-rated health (‘fair/poor’, ‘good’, ‘excellent/very good’); survey year (2000–2004, 2005–2008)). Logistic regression models were stratified for gender. Statistical analyses were carried out using the statistical software packages SPSS version 14·0 and SAS Enterprise Guide version 3. A P value <0·05 was considered statistically significant.
Results
The response rates for completing the face-to-face interview were 61 %, 62 % and 54 % in 1995, 2000–2004 and 2005–2008, respectively. Characteristics of the study populations are presented in Table 1.
Table 1 Characteristics of the study population in 1995, 2000–2004 and 2005–2008; data from the Danish National Survey of Diet and Physical Activity (DANSDA)

*Leisure-time physical activity over the last 12 months. Level 1, mainly sedentary or light physical activity <2 h/week (‘sedentary’); level 2, light physical activity 2–4 h/week (‘light’); level 3, light physical activity >4 h/week or vigorous physical activity 2–4 h/week (‘moderate’); level 4, vigorous physical activity >4 h/week or regular hard exercise and participation in competitive sports several times per week (‘vigorous’).
†The question on self-rated health was only part of the interview in 2000–2004 and 2005–2008.
The study populations had an equal representation of gender. Approximately half of the participants were 15–44 years old. About 25–35 % reported having completed a short-, medium- or long-term further education course, and the proportion of participants with a higher educational level increased over time. From 1995 to 2005–2008, the prevalence of overweight increased in 15–75-year-old Danes (from 35·1 (95 % CI 32·5, 37·7) % to 43·0 (95 % CI 40·9, 45·1) %, P < 0·001). The increase was observed in both genders (men: from 43·8 (95 % CI 40·1, 47·5) % to 51·2 (95 % CI 48·2, 54·2) %; women: from 26·0 (95 % CI 22·6, 29·4) % to 35·4 (95 % CI 32·6, 38·2) %; both P < 0·001, Fig. 1). No statistically significant change in prevalence of overweight was observed between 2000–2004 and 2005–2008.
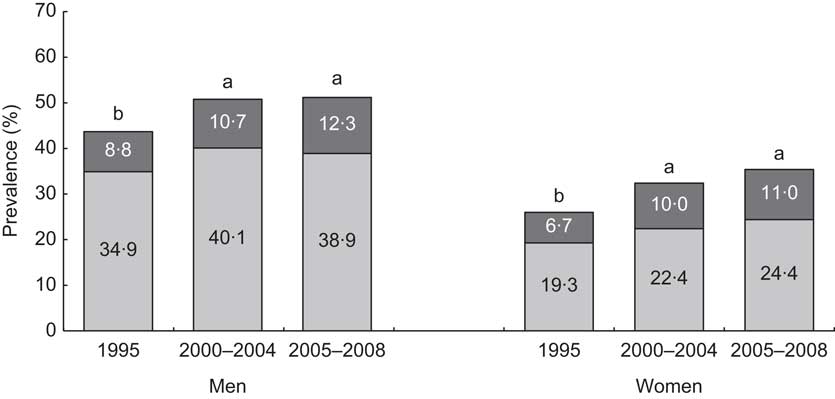
Fig. 1 Trends in prevalence of overweight (BMI = 25·0–29·9 kg/m2; ![]() ) and obesity (BMI ≥ 30·0 kg/m2;
) and obesity (BMI ≥ 30·0 kg/m2; ![]() ) in Danish men and women from 1995 to 2005–2008; data from the Danish National Survey of Diet and Physical Activity (DANSDA). a,bPrevalence estimates of overweight (BMI ≥ 25·0 kg/m2) with unlike superscript letters were significantly different between survey periods for men (P < 0·05) and for women (P < 0·05), separately
) in Danish men and women from 1995 to 2005–2008; data from the Danish National Survey of Diet and Physical Activity (DANSDA). a,bPrevalence estimates of overweight (BMI ≥ 25·0 kg/m2) with unlike superscript letters were significantly different between survey periods for men (P < 0·05) and for women (P < 0·05), separately
Concurrent with the rising prevalence of overweight from 1995 to 2005–2008, weight misperception decreased among overweight men (from 77·5 (95 % CI 72·6, 82·4) % to 71·4 (95 % CI 67·5, 75·2) %) and overweight women (from 54·8 (95 % CI 47·2, 62·4) % to 51·9 (95 % CI 47·0, 56·8) %). The decrease in weight misperception among men was statistically significant (P = 0·001), but not among women (P = 0·24; Fig. 2). The proportion of overweight men misperceiving their weight was also significantly lower in the 2005–2008 survey than in 2000–2004. For overweight women, a lower proportion misperceived their weight in 2005–2008 than in 2000–2004 (Table 2). Furthermore, a lower proportion of overweight women than men misperceived their weight in all survey periods (P < 0·05). In 2005–2008, for instance, 69·2 (95 % CI 63·8, 74·7) % of the overweight (BMI = 25·0–29·9 kg/m2) women and 83·9 (95 % CI 80·3, 87·5) % of the overweight men misperceived their weight. The corresponding proportions for obese (BMI ≥ 30·0 kg/m2) women and men were 13·7 (95 % CI 7·7, 19·7) % and 32·0 (95 % CI 23·9, 40·1) %, respectively.
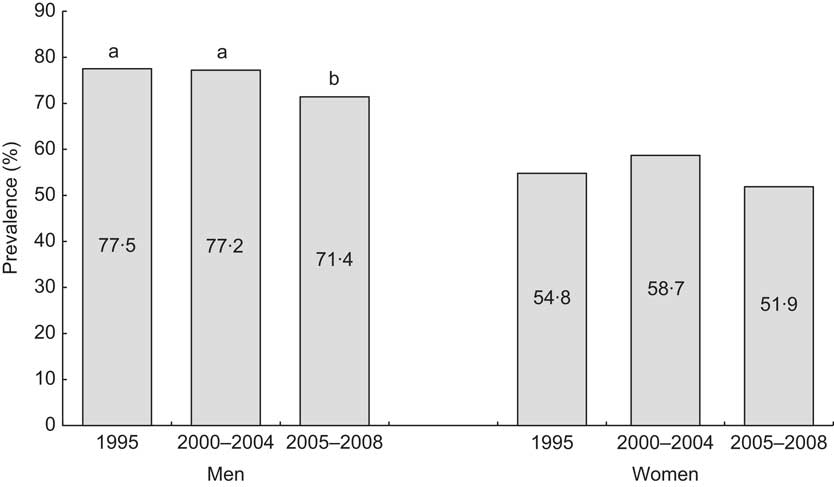
Fig. 2 Trends in percentage of weight misperception in overweight (BMI ≥ 25·0 kg/m2) Danish men and women from 1995 to 2005–2008; data from the Danish National Survey of Diet and Physical Activity (DANSDA). Misperceived weight corresponds to overweight individuals who did not acknowledge their overweight. a,bPercentages of weight misperception with unlike superscript letters were significantly different between survey periods for men (P < 0·05)
Table 2 Percentage and adjusted odds ratio of factors associated with weight misperception in overweight (BMI ≥ 25·0 kg/m2) Danish men and women in 2000–2008; data from the Danish National Survey of Diet and Physical Activity (DANSDA). Only significant factors are shown

Multiple logistic regression analysis was used to identify the factors associated with weight misperception. Variables included in the final regression analyses: for men, intention to eat healthily, leisure-time physical activity, self-rated health and survey year); for women, leisure-time physical activity, self-rated health and survey year.
*‘Misperceivers’ refers to overweight individuals who did not perceive themselves as overweight, while ‘correct perceivers’ refers to overweight individuals who did perceive themselves as overweight.
†Proportion of weight misperceivers among overweight Danes.
‡No association was found in women.
The factors associated with weight misperception in overweight men and women are presented in Table 2. For overweight men, the intention to eat healthily was inversely associated with misperception of overweight. However, only overweight men who ‘occasionally’ intended to eat healthily misperceived their overweight significantly less than those who never intended to eat healthily. The proportion of weight misperceivers increased for both men and women with higher levels of leisure-time physical activity. Compared with sedentary overweight individuals, moderately and vigorously active overweight men and women were about twice as likely to misperceive their overweight status (Table 2). Weight misperception was also found to be associated with better self-rated health among overweight individuals. Overweight men and women who perceived their own health to be very good or excellent were 2·73 (95 % CI 1·90, 3·92) and 2·28 (95 % CI 1·61, 3·24) times more likely to perceive themselves as not being overweight, respectively, than individuals who rated their health to be fair or poor. Weight misperception was not associated with age, educational level or smoking status in overweight men and women.
Discussion
The present study is the first one in Scandinavia to explore whether weight misperception has changed over time in the overweight adult population and try to identify factors associated with weight misperception in overweight individuals. Our main finding was that the increase in overweight from 1995 to 2005–2008 was accompanied by a reduction in the proportion of overweight men misperceiving their weight. This indicates that more men are aware of their overweight status today. This is important for the formulation of effective weight-control and weight-reduction initiatives aimed at a general population which has an increasing proportion of overweight (BMI = 25·0–29·9 kg/m2) and obese (BMI ≥ 30·0 kg/m2) men. Our findings in this Danish population contrast with reports from other European countries, Australia and the USA. In these countries, increasing or stable misperceptions of overweight have been found in recent decades( Reference Johnson, Cooke and Croker 18 – Reference Chuang and Lee 22 , Reference Marques-Vidal, Melich-Cerveira and Marcelino 24 ). Nevertheless, the degree of weight misperception among overweight Danes is very high. The high proportion of weight misperceivers in the current study compared with those reported in other countries might partly be explained by the fact that data on weight misperception in the current surveys were extracted from questions relating to disease. Johnson et al. ( Reference Johnson, Cooke and Croker 18 ) have suggested that focus on the health risks of excess weight may lead overweight individuals to be less likely to perceive themselves as overweight.
Weight misperception appeared to be normal in overweight individuals with BMI of 25·0–29·9 kg/m2 (i.e. it was observed in more than 50 % of the respondents), but not in the obese (BMI ≥ 30·0 kg/m2). This means that, for a significant proportion of overweight individuals, their perceptions of their own weight do not accord with medical and public health standards. This is perhaps because many have not experienced health-related complications as a result of their excess weight, as is also suggested by Janssen et al. ( Reference Janssen, Katzmarzyk and Ross 26 ). Since morbidity rates increase with increasing degrees of overweight( 3 ), overweight individuals at the lower end of the BMI = 25·0–29·9 kg/m2 range may be in overall good health and have experienced no risk factors of chronic diseases or weight-related co-morbidities as yet. They may not consider their excess weight as a threat to health in the same way as obese individuals( Reference Gregory, Blanck and Gillespie 23 ). Overweight individuals who do not perceive their excess weight as a threat to health have been reported to be less likely to be trying to lose weight( Reference Gregory, Blanck and Gillespie 23 ). The absence of health-related complications associated with overweight may also explain why overweight men and women with better self-rated health in the present study were more likely to misperceive their excess weight. Our finding of an association between self-rated better health and weight misperception among overweight individuals is consistent with the findings of previous studies( Reference Gregory, Blanck and Gillespie 14 ). Other studies have shown that current health status plays an important role in perceived health risks arising from excess weight( Reference Gregory, Blanck and Gillespie 23 ).
Gender, age and education
We found a lower proportion of overweight women than men misperceiving their weight across time. The gender differences are consistent with findings from other studies in this area( Reference Johnson, Cooke and Croker 18 , Reference Johnson-Taylor, Fisher and Hubbard 19 , Reference Salcedo, Gutiérrez-Fisac and Guallar-Castillón 21 , Reference Chuang and Lee 22 , Reference Marques-Vidal, Melich-Cerveira and Marcelino 24 , Reference Chang and Christakis 27 ). This suggests that women are more aware of their overweight status than men. Some of the difference observed is probably due to the fact that women are more likely to be concerned about body image and are more dissatisfied with their weight than men. This may be due to cultural norms and societal pressure from advertisements and mass media dictating stricter standards of ideal weight for women than for men( Reference Yaemsiri, Slining and Agarwal 12 , Reference Gregory, Blanck and Gillespie 14 , Reference Paeratakul, White and Williamson 16 , Reference Chuang and Lee 22 ).
We did not find age or educational level to be associated with misperception of overweight. This contrasts with the findings of some previous studies( Reference Kuchler and Variyam 17 , Reference Salcedo, Gutiérrez-Fisac and Guallar-Castillón 21 , Reference Chuang and Lee 22 , Reference Chang and Christakis 27 ), but not all( Reference Gregory, Blanck and Gillespie 14 , Reference Miller, Schulz and Bibeau 25 ). Some of the differences observed may be attributable to the use of different measures of weight misperception. Our findings, supported by previous reports of Gregory et al.( Reference Gregory, Blanck and Gillespie 23 ), suggest that misperception of overweight in relation to chronic disease may not be associated with age or education in overweight Danes.
Intention to eat healthily and physical activity
Overweight men who intended to eat healthily have a lower misperception of their overweight status. Previous studies in Danish adults have shown that the higher the intention to eat healthily, the healthier the diet is( Reference Groth and Fagt 28 ). This suggests a link between healthy eating and a lower likelihood of weight misperception in overweight men. No such association was found in women.
One finding of interest was the association of physical activity with weight misperception in a dose–response manner in overweight individuals. A higher level of leisure-time physical activity increased the odds of weight misperception. Being physically active seems to strengthen the perception of not seeing oneself as overweight. These results have been confirmed by others( Reference Chuang and Lee 22 , Reference Miller, Schulz and Bibeau 25 ), although Duncan et al.( Reference Duncan, Wolin and Scharoun-Lee 13 ) recently reported weight misperception among overweight adults to be associated with less physical activity. Our findings indicate that living a healthy lifestyle (healthy eating and higher level of leisure-time physical activity) weakens the perception of being overweight, especially among men. The observation of misperceivers of overweight being more physically active might be explained by some physically active individuals with BMI of 25·0–29·9 kg/m2. These individuals may not be overweight, but fit, with their higher BMI caused by a larger muscle mass. This may especially be the case for men, who have a higher ratio of muscle to fat than women, and may have affected the results suggesting that men are more likely to misperceive their weight than women( Reference Chuang and Lee 22 ).
Possible explanations for the trend of decreasing weight misperception
The trend of decreasing weight misperception in overweight Danish men may be due to growing awareness of the obesity epidemic and increased publicity about overweight as a health risk in media presentations and health campaigns. This may have increased knowledge and awareness of the medical and public health standards for overweight and obesity so that more overweight men are able to assess their weight status correctly( Reference Gregory, Blanck and Gillespie 14 , Reference Johnson, Cooke and Croker 18 ). However, we do not know whether respondents have used the medical and public health standards as a reference point when reporting their perception of overweight in relation to chronic disease. A variety of factors such as family history, previous health issues and current health behaviour may affect the assessment of overweight as a health risk( Reference Gregory, Blanck and Gillespie 23 ). Overweight individuals who are more physically active and have better self-rated health may not consider their excess weight a health problem.
Strengths and limitations
One major strength of our study lies in the large sample size and its nationwide character. The data are based on a nationally representative sample covering a wide age range of 15–75-year-old Danes, providing data on weight misperception among overweight individuals in all regions of Denmark. This makes it possible to generalize from the results to the Danish population as a whole.
One limitation of the study is the response rate of 54–62 %, which might place a question mark about the representativeness of the study sample. However, a comparison with census data on gender, age and educational level showed that the study sample was close to being representative for the Danish population, although young men, elderly women and groups with a short education were slightly under-represented( Reference Pedersen, Fagt and Groth 29 ). Under-representation could have introduced selection bias, because non-responders in population-based health surveys are likely to differ from responders in lifestyle and health consciousness( Reference Nyholm, Gullberg and Råstam 30 , Reference Tolonen, Laatikainen and Helakorpi 31 ). If we assume that non-responders can be expected to have a higher BMI( Reference Nyholm, Gullberg and Råstam 30 ) and to be less conscious about health and weight, the actual level of weight misperception in the overweight Danish population is probably higher than observed in the current study.
The use of self-reported height and weight may have resulted in some misclassification, but this weakness is less pronounced in face-to-face interviews, as used in the present study, than in questionnaire data( Reference Kuskowska-Wolk, Karlsson and Stolt 32 , Reference Kuskowska-Wolk, Bergström and Boström 33 ). Results from a similar Danish study investigating the validity of self-reported overweight showed that the prevalence of overweight was underestimated by 12 % in 15–75-year-old men (61 % instead of 49 %) and 1 % in women (36 % instead of 35 %)( Reference Rothausen, Gille and Biltoft-Jensen 34 ). The consequence of such systematic bias is a potential underestimation of the true prevalence of overweight. The proportion of overweight Danes misperceiving their overweight might therefore have been higher than reported here. This bias seems to be more evident for men than for women.
The question used to assess weight misperception in the present study may have some limitations. Weight misperception was assessed in DANSDA using a single question about diet-related chronic diseases. This did not allow a more gradual judgement or in-depth assessment of weight appropriateness, as was the case in other studies( Reference Wardle and Johnson 8 , Reference Lemon, Rosal and Zapka 10 , Reference Yaemsiri, Slining and Agarwal 12 , Reference Gregory, Blanck and Gillespie 14 , Reference Johnson, Cooke and Croker 18 – Reference Chuang and Lee 22 ). However, since the question used to assess weight misperception and the mode of administration (face-to-face interview) were identical in all three survey periods we consider it adequate for the purpose of our study, which was to determine changes in weight misperception over time among overweight Danes.
Conclusions
The increase in the prevalence of overweight from 1995 to 2005–2008 among Danish adults was accompanied by a reduction in the proportion of overweight men misperceiving their weight. This may indicate that more men see overweight as a personally relevant health problem. Nevertheless, weight misperception remains a considerable problem in men. Our findings also suggest that overweight individuals who are more physically active and have better self-rated health may not consider their excess weight a health problem. New public health initiatives may be necessary to reach this group, because they may not be receptive to existing health campaigns aimed at controlling or reducing unhealthy weight in the population. One possibility would be counselling people to be both physically active and maintain a healthy weight to prevent chronic disease.
Acknowledgements
Sources of funding: This research received no specific grant from any funding agency in the public, commercial or not-for-profit sectors. Conflicts of interest: The authors declare no conflicts of interest. Authors’ contributions: J.M. designed and performed the statistical analyses in cooperation with V.K.K. and wrote the manuscript. J.M., A.B.-J., S.F. and M.V.G. were responsible for the study design and collection of data. J.M., A.B.-J., S.F., V.K.K., I.T. and M.V.G. all participated in interpretation of the data and critical revision of the paper, and all approved the final version of the manuscript. Acknowledgements: The authors wish to thank Data Warehouse Manager Karsten Kørup and Data Scanning Manager Hanne-Jette Hinsch for contributing to the data processing. The authors would also like to express their gratitude to all participants in DANSDA.


