


The use of dietary quality measures in nutritional epidemiology to study diet–health relationships has increased rapidly over the past two decades( Reference Waijers, Feskens and Ocke 1 – Reference Kant 4 ), enabling examination of associations between a combination of foods and health rather than focusing on single foods or nutrients. Diet quality is often measured by scoring food patterns or nutrient intakes in terms of how closely they align with national dietary guidelines( Reference Wirt and Collins 2 ). These measures are based on quantities of major food groups or intakes of key nutrients. The most commonly used diet quality indices have been developed in the USA( Reference Kant 3 , Reference Kant 4 ) and so far no diet quality index has been specifically developed for the UK, although some of the existing diet quality indices have been applied to UK populations( Reference Maynard, Ness and Abraham 5 – Reference Holmes and Roberts 7 ).
The aim of the current research was to develop a simple index that discriminates those who make healthy choices from those who do not for use in analysis of large surveys, with an emphasis on eating behaviours rather than quantities of foods or nutrients consumed. Such an index would provide a single figure for the healthiness of dietary choices which can be taken into account in analyses of other variables. The index could also be used as a short stand-alone questionnaire to categorize individuals in large surveys with many thousands of individuals, where interview time for a dietary component is very limited. The proposed Eating Choices Index (ECI) score therefore comprises only four key elements: (i) consumption of breakfast; (ii) consumption of two portions of fruit per day; (iii) type of milk consumed; and (iv) type of bread consumed. The ECI score was originally developed to be used as a single value to represent diet quality as a confounding variable in a study on diabetes and cognition( Reference Richards, Stephen and Mishra 8 ). However, the ECI score required further testing and the aim of the present study was to compare the ECI score with dietary data obtained from food diaries, correlating the ECI score with indicator nutrients, including macronutrients, dietary fibre (NSP), vitamin C, Fe, Ca and folate, and exploring associations of the ECI score with demographic factors such as sex, BMI, socio-economic status (SES), marital status, smoking status and physical activity.
Experimental methods
Study members
The Medical Research Council National Survey of Health and Development (NSHD; 1946 British birth cohort) is a longitudinal study based on a social class-stratified sample of 5632 singleton births occurring within marriage in England, Scotland and Wales during one week of March 1946( Reference Wadsworth, Kuh and Richards 9 ). Adult dietary data were collected when participants were aged 36, 43, 53 and 60–64 years, in 1982, 1989, 1999 and 2006–2011, respectively. For the present study, only those who completed more than 3 d of the 5 d food record at age 43 years were included (n 2256); intakes of dietary supplements were not included in this analysis.
The present study was conducted according to the guidelines laid down in the Declaration of Helsinki and all procedures involving human subjects were approved by the Joint UCL/UCLH Committee on the Ethics of Human Research.
Dietary assessment and non-dietary variables
Dietary data were collected by research nurses providing food diaries during home visits to be completed over five consecutive days( Reference Prynne, Paul and Mishra 10 ). All foods and drinks consumed both at home and away were recorded using household measures, and portion sizes were estimated using detailed guidance notes and photographs provided at the beginning of the diary( Reference Prynne, Paul and Mishra 10 ). Diaries were coded at the Dunn Nutrition Unit in Cambridge using the program Diet In Data Out (DIDO)( Reference Price, Paul and Key 11 ), a dietary assessment system developed in house and incorporating McCance and Widdowson's The Composition of Foods 4th edition( Reference Paul and Southgate 12 ) and its supplements( Reference Holland, Unwin and Buss 13 , Reference Holland, Unwin and Buss 14 ). Records were included if cohort members completed ≥3 d and the majority completed 5 d (n 2082; 92·3 %).
Information on demographic and socio-economic variables at age 43 years was obtained through a structured questionnaire( Reference Kuh, Pierce and Adams 15 ) and included SES (non-manual and manual), marital status (married, single, divorced/widowed/separated), smoking status (current, ex-smoker, never smoker) and physical activity (categories: none, 1–4 times per month, 5 or more times per month). Height and weight were measured during a home visit by a nurse and BMI (in kg/m2) was subsequently calculated.
Construction of the Eating Choices Index score
The ECI score was designed for the NSHD dietary data at age 43 years (collected in 1989). The scoring system was determined following exploration of the consumption data and discussion with other researchers.
The ECI score comprised four elements: (i) consumption of breakfast; (ii) consumption of fruit; (iii) type of milk consumed; and (iv) type of bread consumed. These four elements were included based on current dietary recommendations, previous findings in the literature( Reference Stephen, Dahl and Sieber 16 – Reference Deshmukh-Taskar, Nicklas and O'Neil 18 ) and the ease and accuracy of obtaining correct responses from study participants( Reference Chaplin 19 ).
Table 1 describes the four components of the ECI score and the scoring for each component. Consumption of breakfast was classified as consuming breakfast on no days (score 1), consuming breakfast on some days but not all days (score 3) and consuming breakfast on all days (score 5). Breakfast was defined as energy intake >418·4 kJ (>100 kcal) in the time slot allocated to breakfast so as to include not just a cup of tea or coffee with milk. Fruit consumption was scored as consuming two portions of fruit on no days (score 1), consuming two portions of fruit on some days but not all (score 3) or consuming two portions of fruit on all days (score 5). A portion of fruit was defined as 80 g and did not include fruit juices. Type of milk was scored as only consuming whole milk (3·5 % fat; score 1), sometimes consuming whole milk/sometimes semi-skimmed milk (1·7 % fat; score 2), consuming only semi-skimmed milk (score 3), sometimes consuming semi-skimmed milk/sometimes consuming skimmed milk (0·1 % fat; score 4) and consuming only skimmed milk (score 5). Type of bread consumed was scored as only consuming white bread (score 1), sometimes consuming white bread/sometimes consuming brown or granary bread (score 2), consuming only brown or granary bread (score 3), sometimes consuming brown or granary bread/sometimes consuming wholemeal bread (score 4) and only consuming wholemeal bread (score 5). Granary bread is made with brown flour with added maltose whole grains and wholemeal bread contains all parts of the milled wheat grain. The quantities of bread or milk consumed were not relevant; it was about whether people chose to consume these products regardless of the quantities. Intakes from mixed dishes were not included in these analyses.
Table 1 The components and scoring of the Eating Choices Index (ECI) score which was applied to a 5 d food record but could also be used in the stand-alone questionnaire

†Breakfast is defined as consuming >418·4 kJ (>100 kcal) in the first time slot of the food diary.
‡A portion of fruit was defined as 80 g and did not include fruit juices.
Scores were assigned on the daily intake level then aggregated to reflect the intake over the 5 d of recording. After assigning the scores to the four individual components, a summary score was calculated to yield the ECI score, ranging from 4 to 20, with a score of 20 indicating the healthiest diet.
Statistical analyses
General characteristics and dietary intakes of the indicator nutrients were presented for men and women as well for cohort members with a low v. high ECI score (using the median ECI score as cut-off). Differences between men and women were tested using a t test.
The ECI score was correlated with indicator nutrients, which included the macronutrients fat, protein and carbohydrate as a percentage of energy, and fibre (as NSP; g/d), vitamin C (mg/d), Fe (mg/d), Ca (mg/d) and folate (μg/d), using Pearson correlation coefficients. Pearson correlation coefficients were used in the case of normally distributed dietary data; otherwise an appropriate transformation of the data was applied. We hypothesized that the ECI score would be positively correlated with intakes of carbohydrate, NSP, vitamin C, Fe, Ca and folate and negatively correlated with intake of fat.
Partial correlations of indicator nutrients with the ECI score were also explored, adjusting for BMI and SES. The ECI score was presented in quartiles and a P for trend across ECI score quartiles was calculated using the χ 2 test.
Further, it was explored how the ECI score was associated with sex, BMI categories (<18·5 kg/m2 (underweight), 18·5–24·9 kg/m2 (normal weight), 25·0–29·9 kg/m2 (overweight) and ≥30·0 kg/m2 (obese)), social class, marital status, smoking status and categories of physical activity, comparing quartiles of the ECI score and using the χ 2 test to test for trend across ECI score quartiles (the ECI score quartile cut-offs were <10, 10–12, 12–14 and >14). A multiple linear regression model was used to examine how much of the variation of ECI score could be explained by these factors. Data were missing for n 152 for SES, n 13 for BMI, n 1 for marital status and n 4 for smoking status. Data analysis was carried out using the statistical software package IBM SPSS Statistics for Microsoft Windows version 21·0 and a P value of <0·05 was considered statistically significant.
Results
Characteristics of study population
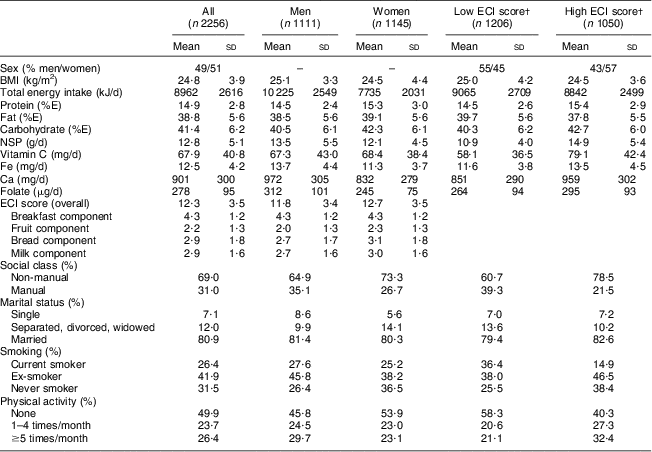
Table 2 shows the characteristics of the study population, including the individual components of the ECI score (breakfast, fruit, milk and bread). The proportions of men and women were equal in this population; the average BMI was 24·8 (sd 3·9) kg/m2. The mean ECI score was 12·3 (sd 3·5) for all and was slightly but not statistically significantly higher in women (12·7 (sd 3·5)) compared with men (11·8 (sd 3·4)). The biggest difference in ECI score components between men and women were found for bread (P < 0·05) as women were more likely to consume wholemeal bread. Individuals with a higher ECI score (above the median) seemed more likely to be female, of non-manual SES, married, more physically active and less likely to smoke (Table 2).
Table 2 Characteristics of the individuals at age 43 years (in 1989), Medical Research Council National Health and Development Survey
%E, percentage of energy; CHO, carbohydrate; ECI, Eating Choices Index.
†Based on median ECI score of 11 (low, <11; high, ≥11).
Eating Choices Index scores and correlations with indicator nutrients
Table 3 shows the correlations of the ECI score with the indicator nutrients. The ECI score was significantly negatively correlated with fat (r = −0·2, P < 0·001) and positively correlated with protein (r = 0·2, P < 0·001), carbohydrate (r = 0·3, P < 0·001), dietary fibre (as NSP; r = 0·5, P < 0·001), vitamin C (r = 0·4, P < 0·001), Fe (r = 0·3, P < 0·001), Ca (r = 0·2, P < 0·001) and folate (r = 0·2, P < 0·001). The ECI score was not significantly correlated with total energy intake (r = −0·02, P = 0·49). As NSP and folate intake data were not normally distributed they were log-transformed for statistical testing.
Table 3 Intakes of indicator nutrients per ECI score quartile and the correlations of indicator nutrients and ECI score (correlation coefficient r) among individuals at age 43 years (in 1989), Medical Research Council National Health and Development Survey

ECI, Eating Choices Index; %E, percentage of energy; CHO, carbohydrate; SES, socio-economic status.
*P < 0·001.
†The ECI score quartile cut-offs were <10, 10–12, 12–14 and >14.
‡Correlation coefficient for continuous variable.
§Correlation coefficient for continuous variable adjusted for BMI and SES.
||Data were log-transformed to gain normality for statistical testing but are presented here non-transformed.
The correlations between the ECI scores and indicator nutrients were comparable when analysing men and women separately, although correlations tended to be somewhat stronger for women for fat, protein, Ca and folate (Table 3) and results were comparable when correcting for BMI and SES (Table 3).
The ECI score is also presented as quartiles (Table 3); for all indicator nutrients, the P for trend across quartiles was statistically significant (P < 0·001), except for total energy intake, which showed no statistical association, nor in men or women separately.
Eating Choices Index scores and other factors
Figure 1 shows the association between ECI score quartiles and the different BMI categories for men and women combined. It shows that individuals with a low ECI score were more likely to be overweight or obese than those with a high ECI score, who were more likely to be normal weight (P < 0·05). Further, it was shown that with higher quartiles of the ECI score, individuals were more likely to be non-manual class (P < 0·001; data not shown) and more likely to be married, although this was not a statistically significant trend (P = 0·14; data not shown). Individuals in higher quartiles of the ECI score were also likely to smoke less (P < 0·001; data not shown) and be more physically active (P < 0·001; data not shown).
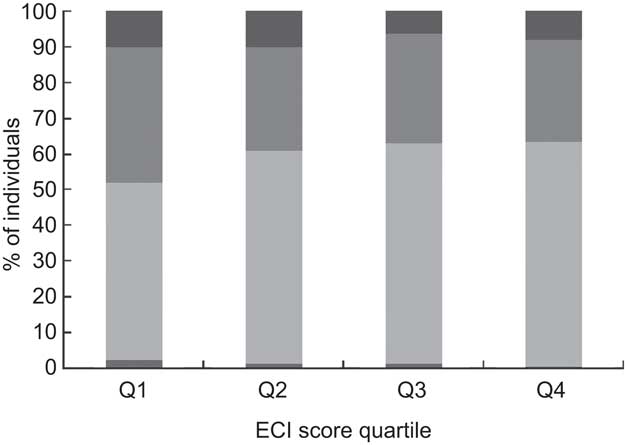
Fig. 1 Association of the Eating Choices Index (ECI) score quartile with BMI category (![]() , obese, BMI ≥ 30·0 kg/m2;
, obese, BMI ≥ 30·0 kg/m2; ![]() , overweight, BMI = 25·0–29·9 kg/m2;
, overweight, BMI = 25·0–29·9 kg/m2; ![]() , normal weight, BMI = 18·5–24·9 kg/m2;
, normal weight, BMI = 18·5–24·9 kg/m2; ![]() , underweight, BMI < 18·5 kg/m2; P for trend = 0·0 0 1) in 2243 individuals at age 43 years (in 1989), Medical Research Council National Health and Development Survey. n 517 for Q1 (ECI score < 10), n 682 for Q2 (ECI score = 10–12), n 415 for Q3 (ECI score = 12–14), n 629 for Q4 (ECI score > 14); for n 13 BMI is missing
, underweight, BMI < 18·5 kg/m2; P for trend = 0·0 0 1) in 2243 individuals at age 43 years (in 1989), Medical Research Council National Health and Development Survey. n 517 for Q1 (ECI score < 10), n 682 for Q2 (ECI score = 10–12), n 415 for Q3 (ECI score = 12–14), n 629 for Q4 (ECI score > 14); for n 13 BMI is missing
Multiple linear regression showed that sex, BMI, SES, marital status, smoking status and physical activity explained 14·5 % of the total variation in ECI score, revealing that females, having a lower BMI, having a non-manual SES and being a non-smoker and physically active were associated with a higher ECI score (Table 4).
Table 4 Results of multiple linear regression analysis of possible determinants of ECI scores in 2097 individuals† at age 43 years (in 1989), Medical Research Council National Health and Development Survey

ECI, Eating Choices Index; SES, socio-economic status.
R 2 = 14·5 %.
†n was 2243 but data were missing for n 152 for SES, n 13 for BMI and n 1 for marital status.
Discussion
The results of the present study showed that ECI score was significantly correlated with nutrient profiles that are consistent with a healthy diet: as the ECI score increased, intakes of the nutrients protein, carbohydrate, fibre, vitamin C, Fe, Ca and folate also increased and total fat intake decreased; no correlation was observed with total energy intake. The correlations with the indicator nutrients were modest to good (0·2–0·6) and were all in line with our hypotheses. It was not expected that correlations would be very strong since the ECI score is a short measure of the healthiness of the diet and includes only a small number of eating choice characteristics. Therefore we included the analyses of quartiles of ECI score and all showed statistically significant associations, except for total energy for which no significant observations were found. This was in line with expectations as the ECI score was not designed to assess energy intake; it was intended to address diet healthiness and for use in situations where no measure of energy intake is available.
Individuals with a higher ECI score were more likely to be female, have a lower BMI, to be non-manual social class, smoke less and be more physically active. These findings are in line with other work. Several studies have described numerous differences in food choice and health behaviours between men and women( Reference Westenhoefer 20 – Reference Baker and Wardle 22 ). Wardle et al. reported that women were more likely than men to report avoiding high-fat foods, eating fruit and fibre, and limiting salt( Reference Baker and Wardle 22 , Reference Wardle, Haase and Steptoe 23 ). It has been found that diet quality predicts the development of overweight and obesity in women( Reference Wolongevicz, Zhu and Pencina 24 ), in line with the findings for BMI here. For differences between social status, whole grains, low-fat dairy and fresh fruit and vegetables are more likely to be consumed by groups of higher SES( Reference Darmon and Drewnowski 25 , Reference Galobardes, Morabia and Bernstein 26 ). In our analyses we found that in the lowest category of ECI score there were more separated, divorced or widowed men than women but also more single women; and in the highest category of ECI score there were relatively more married individuals, both men and women. However, this association was not statistically significant. Overall, these explorative analyses indicated that the ECI score distinguished dietary behaviours in line with the existing literature.
A review by Waijers et al.( Reference Waijers, Feskens and Ocke 1 ) on diet quality indices has identified key issues in the construction of such an index: it needs to have a clear objective, a rationale for the choice of index components, clear information on assigning foods to food groups, include an exact quantification of the index components against cut-off values, energy adjustment (or not), and information on the relative contribution of individual components to the total score. The objective of our proposed ECI score was to measure the extent to which eating behaviour is healthy. The ECI score is determined by food choices within the population, and it includes items that are not strongly correlated and have no need for energy adjustment. All four factors contributed equally to the total score. The ECI score therefore satisfies the ‘Waijers criteria’. It should be noted that the ECI score may be culture-specific, and it remains to be seen how the ECI score can be applied to populations other than the UK. It is likely that the ECI score could be applicable in most Western populations; however, it is also capable of adaptation to other populations.
The study was limited by the fact that the ECI score will be affected by changes in food product availability and may therefore need to be updated as new food products become available. Dietary behaviour and eating choices are part of a complex behaviour( Reference Steptoe, Pollard and Wardle 27 ) and therefore by including only four elements in the ECI score, it could be argued that this approach may have been too simplistic. However, the ECI score was not intended to capture the whole breath of dietary behaviour and/or dietary intake but to serve as a measure to differentiate individuals based on their dietary choices. The selection of four elements of the ECI score was based on years of experience in this field, previous findings in literature( Reference Stephen, Dahl and Sieber 16 – Reference Deshmukh-Taskar, Nicklas and O'Neil 18 ), current dietary recommendations in the UK( 28 ), and the ease and accuracy of obtaining correct responses from study participants( Reference Chaplin 19 ). The rationale as to why the ECI score included two portions of fruit intake rather than fruit and vegetables was that capturing vegetable intake on its own is difficult and more challenging than fruit intake( Reference Chaplin 19 ) as vegetables are often consumed as part of mixed dishes( Reference Fitt, Mak and Stephen 29 ). In the UK the current dietary recommendation for fruit and vegetable consumption is to consume five portions daily( 30 ). The average fruit consumption in the recent National Diet and Nutrition Survey was about 100 g/d in adults( Reference Bates, Lennox and Prentice 31 ), which is just over one portion per day when defining a fruit portion as 80 g. However, to distinguish those with healthy dietary behaviour we chose to include two portions of fruit per day, which is also in line with the Dutch dietary recommendations( Reference Demetriou, Hadjisavvas and Loizidou 32 ).
The present study benefits from the use of dietary information assessed by a 5 d food diary, which is considered to be the gold standard for dietary assessment. The majority of cohort members completed 5 d of recording and a sensitivity analyses showed that those who completed 3 or 4 d of recording where not different in terms of BMI, sex, SES or marital status. The ECI score could also be derived using other methods of dietary assessment, such as 24 h recall and FFQ, provided that the FFQ has asked about frequency of breakfast consumption, which is not always the case.
The next step will be to validate and test the reliability of the ECI score comparing its use as a short questionnaire with detailed dietary intakes and to examine the discriminant validity of the questionnaire by studying the ECI score in relation to health outcomes.
Conclusion
The ECI score has great potential to be used in large-scale observational studies to rank individuals on dietary choices where time and resources for dietary assessment are limited. The ECI score could also be used as confounding variable in statistical analyses where adjustment for dietary behaviour is required.
Acknowledgements
Sources of funding: This research received no specific grant from any funding agency in the public, commercial or not-for-profit sectors. Conflicts of interest: None. Ethical approval: All procedures involving human subjects were approved by the Central Manchester Research Ethics Committee for the data collection taking place in Manchester, Birmingham, Cardiff and London; and by the Scottish A Research Ethics Committee for the data collection taking place in Edinburgh. Authors’ contributions: G.K.P. analysed and interpreted the data, and wrote the manuscript. A.M.S., C.J.P. and M.R. designed and supervised the research. Acknowledgements: The authors would like to thank the members of the 1946 birth cohort who recorded their food intake, the staff of the National Centre for Social Research who collected the data in 1999, and Warren Hilder and Mark Connor at NSHD who collated the data. The 1999 DIDO was compiled by Michael Tumilty, who also supervised the coding of the 1999 diaries, which was carried out by Anna Gent and Donna Thomas. The authors also thank Darren Cole for his help with data management.


