


The prevalence of overweight and obesity is progressively increasing worldwide( Reference de Onis, Blossner and Borghi 1 , Reference Kanter and Caballero 2 ). Overweight and obesity are major risk factors for numerous co-morbidities( Reference Guh, Zhang and Bansback 3 ). However, the effects of overweight and obesity on the risk of death are controversial( Reference Jee, Sull and Park 4 , Reference Flegal, Kit and Orpana 5 ). Jee et al. showed that underweight, overweight and obese men and women have higher death rates than men and women with normal body weight( Reference Jee, Sull and Park 4 ). Flegal et al. performed a systematic review and meta-analysis, and reported a significantly higher risk for all-cause mortality for obese compared with people of normal weight, especially for class II and class III obesity. However, mortality was significantly lower among overweight people compared with people of normal weight( Reference Flegal, Kit and Orpana 5 ). Overweight refers to an excess amount of body weight that may come from muscle, bone, fat and water. Obesity refers to an excess amount of body fat.
BMI is a simple index of weight to height that is commonly used to classify overweight and obesity in adults. It is calculated as a person’s weight in kilograms divided by the square of his or her height in metres (kg/m2). The WHO and the National Heart, Lung, and Blood Institute have defined four weight groups: underweight (BMI<18·5 kg/m2), normal weight (18·5 kg/m2≤BMI<25·0 kg/m2), overweight (25·0 kg/m2≤BMI<30·0 kg/m2) and obese (BMI≥30·0 kg/m2)( Reference Kuczmarski and Flegal 6 ). Because of differences in body size among various ethnic groups, the WHO proposed that Asian adults with a BMI≥23·0 and <25·0 kg/m2 be considered overweight and those with a BMI ≥25·0 kg/m2 be considered obese( 7 ). The Department of Health in Taiwan further classified adults as underweight (BMI<18·5 kg/m2), normal weight (18·5 kg/m2≤BMI<24·0 kg/m2), overweight (24·0 kg/m2≤BMI<27·0 kg/m2), mildly obese (27·0 kg/m2≤BMI<30·0 kg/m2), moderately obese (30·0 kg/m2≤BMI<35·0 kg/m2) and severely obese (BMI≥35·0 kg/m2)( 8 ).
The government is dedicated to a weight control programme for Taiwanese citizens and initiated a nationwide weight-loss promotion campaign in 2011( 9 ). This campaign has attracted over 720 000 Taiwanese citizens, resulting in a total weight loss of 1100 tonnes by the end of 2012( 10 ). As more people, including elderly people, are becoming overweight or obese, weight loss is recommended to improve one’s health. Health risks are lowered in overweight children and adults by dieting and exercise. However, the health benefits of weight loss in elderly people, particularly by energy restriction, are uncertain. Jee et al. demonstrated that underweight men and women had a higher risk of death than those of normal weight( Reference Jee, Sull and Park 4 ). Abhyankar et al. found that overweight and obesity may be positive factors, and reported improved survival rates both 30 d and 1 year after treatment in an intensive care unit( Reference Abhyankar, Leishear and Callaghan 11 ). Beleigoli et al. showed that overweight (BMI=25·0–30·0 kg/m2) is inversely associated with mortality in older Brazilian adults( Reference Beleigoli, Boersma and Diniz Mde 12 ). Deurenberg et al. showed that the relationship between body fat percentage and BMI varied among racial groups( Reference Deurenberg, Yap and van Staveren 13 ). Based on the inconsistency of the results regarding the relationship between body weight and mortality among various groups, we investigated whether the normal BMI cut-off point is suitable for middle-aged and older Taiwanese adults regarding all-cause mortality.
Methods
Study participants
A population-based longitudinal cohort study, the Survey of Health and Living Status of the Elderly in Taiwan (SHLSET), renamed the Taiwan Longitudinal Study on Aging (TLSA), with a nationwide representative random sample of middle-aged and older adults, was conducted in 1989, with follow-ups in 1993, 1996, 1999, 2003 and 2007. Details of the TLSA study design have been published( Reference Hsu 14 ). The data used in the present study were retrieved from the TLSA, which was funded by the US National Institute of Aging, the Taiwan Bureau of Health Promotion and the Population Studies Center at the University of Michigan. Data files that identified people were encrypted and the identification was removed.
The study participants were recruited at baseline in 1996, and followed up in 1999, 2003 and 2007. Participants who passed away in the first 3 years of follow-up were excluded, as were participants who provided incomplete age or sex information. Patients who were not followed up were also excluded (Fig. 1).
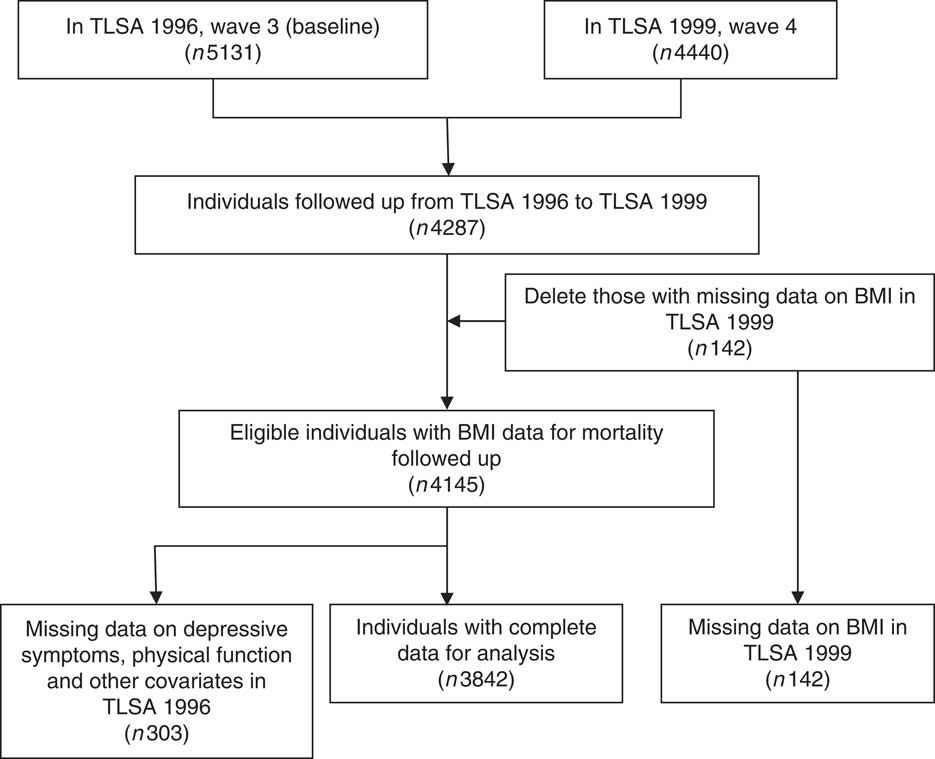
Fig. 1 Flow diagram of the sampling scheme in the present study (TLSA, Taiwan Longitudinal Study on Aging)
Outcome measurement
The outcome measurement included all-cause mortality for the study participants during the follow-up periods. The follow-up person-years were estimated for the study participants from the index date until death or until the end of 2007.
Exposure measurement
Exposure variables comprised demographic variables, co-morbid medical illness, physical function and depression status. Demographic variables included age, age cohort (50–64 years and ≥65 years), sex, ethnicity, education level, marital status, smoking status, alcohol consumption and BMI.
Ethnicity was categorized as Fu-Kien, Hakka, Mainlander and Other. Education levels were divided into illiterate (0 years of education), elementary school (1–6 years), junior to senior high school (7–12 years) or college degree and above (>12 years). Marital status was entered as a dichotomous variable: with spouse (living with spouse or companion) or without spouse (not married, widowed, divorced or separated). Smoking status was dichotomized as current user and current non-user. Alcohol consumption was also dichotomized as heavy drinking (more than 30 g alcohol/d) and not heavy drinking. BMI was calculated from self-reported weight and height and categorized as underweight (BMI<18·5 kg/m2), normal weight (18·5 kg/m2≤BMI<24·0 kg/m2), overweight (24·0 kg/m2≤BMI<27·0 kg/m2) or obese (BMI≥27·0 kg/m2), according to the Taiwan Department of Health guidelines. We further categorized obesity into BMI=27·0–28·0 kg/m2, BMI=28·0–29·0 kg/m2 and BMI≥29·0 kg/m2. Co-morbidities were based on records of self-reported chronic diseases that may affect mortality (hypertension, diabetes, heart diseases, stroke, cancer, lung diseases).
The physical function variable included eight items for the assessment of mobility limitations: (i) ability to stand for 15 min; (ii) ability to squat; (iii) ability to reach overhead; (iv) ability to grasp with the fingers; (v) ability to carry a weight of 11 kg; (vi) ability to run 20 to 30 m; (vii) ability to walk 200 to 300 m; and (viii) ability to walk up two to three flights of stairs. Limitations in the performance of each mobility task were rated (0=not at all, 1=mild, 2=moderate, 3=severe). A higher score indicated a higher level of difficulty.
Depression status was measured by the ten-item Center for Epidemiologic Studies Depression Scale (CES-D)( Reference Lee and Chokkanathan 15 ). A summary of the depression status scores (range: 0–30) was created from the sum of the responses to the ten items in the scale. A total score ≥8 was defined as depression( Reference Yen, Yeh and Wang 16 ).
Statistical analysis
We described baseline participant characteristics of the total population, the surviving group and the deceased group. Associations of the categorical risk factors of mortality were compared using the χ 2 test. Student’s t test was performed to identify the differences in the continuous variables between the surviving and deceased groups. Multivariable Cox proportional-hazards regression models were used to calculate hazard ratios (HR) and 95 % confidence intervals with stratification based on BMI, marital status, smoking habit, alcohol consumption, number of co-morbidities, depression status and physical function. We further used multivariable Cox proportional-hazards regression models to examine the relationship between BMI and mortality, and investigated the optimal BMI cut-off point for participants with and without pre-existing diseases, including those who presented with hypertension, CHD, diabetes, depression and health. Adjusted potential confounders included sociodemographic variables, spouse status, health-related behaviour, co-morbidity, depression and physical function. To model the relationships of the follow-up years and all-cause mortality among the four BMI categories, we used the LIFETEST component (the Kaplan–Meier estimator) of the SAS statistical software package. All statistical analyses were performed using SAS version 9·2. All statistical tests were two-tailed and the significance level was set at 0·05.
Results
Demographic characteristics of the study participants in 1996
A total of 4145 middle-aged and older adult cases were followed, totalling 42 353 person-years. Of these, 2208 (53·3 %) were men and 1937 (46·7 %) were women. During the follow-up period, 1263 (30·5 %) participants passed away. The deceased group was significantly older at death than the surviving group (71·6 (sd 8·6) years v. 62·9 (sd 8·1) years). A significantly lower proportion of women passed away during the follow-up period than did men (25·9 % v. 34·5 %). Race did not appear to be a factor in the risk of death. More educated participants had significantly lower death rates. Participants with spouses had significantly lower death rates than those who did not have spouses (25·9 % v. 42·8 %). Participants who smoked had significantly higher death rates than those who did not smoke (35·5 % v. 28·6 %). Participants who consumed alcohol had significantly lower death rates than those who did not consume alcohol (25·5 % v. 31·9 %). Regarding the relationship between BMI categories and all-cause mortality, obese participants had lower death rates than overweight, normal-weight and underweight participants (obese: 21·2 %, overweight: 25·0 %, normal weight: 31·1 %, underweight: 49·6 %; Table 1).
Table 1 Comparison of demographic characteristics between the surviving group and the deceased group during follow-up among 4145 middle-aged and older adults, totalling 42 353 person-years, Taiwan Longitudinal Study on Aging, 1996–2007
Underweight, BMI<18·5 kg/m2; normal weight, 18·5 kg/m2≤BMI<24·0 kg/m2; overweight, 24·0 kg/m2≤BMI<27·0 kg/m2; obesity, BMI≥27·0 kg/m2.
† Values are presented as mean and standard deviation.
Relationships between BMI and all-cause mortality and co-morbidities
Table 2 shows that the participants with higher BMI values had lower all-cause mortality rates. The most common co-morbidities among the middle-aged and older adults were depression status, hypertension, heart disease and diabetes (27·6 %, 25·6 %, 14·0 % and 9·9 %, respectively). The adults with higher BMI values had lower rates of depression. Participants with higher BMI values had higher rates of hypertension and diabetes. In general, participants with higher BMI values had more co-morbidities. Higher levels of physical function impairment appeared in participants who were underweight or obese.
Table 2 Relationships between BMI categories and all-cause mortality, co-morbidities and physical function among 4145 middle-aged and older adults, totalling 42 353 person-years, Taiwan Longitudinal Study on Aging, 1996–2007
Underweight, BMI<18·5 kg/m2; normal weight, 18·5 kg/m2≤BMI<24·0 kg/m2; overweight, 24·0 kg/m2≤BMI<27·0 kg/m2; obesity, BMI≥27·0 kg/m2.
† Values are presented as mean and standard deviation.
Factors influencing all-cause mortality of middle-aged and older adults
Model A1 showed that underweight participants had a 1·35-fold higher risk of death compared to those of normal weight, after adjusting for demographic variables. Obese participants had a 20 % lower risk of death compared with participants of normal weight, after adjusting for demographic variables. Participants with a spouse had a 15 % lower risk of death compared with participants without a spouse, after adjusting for demographic variables. Current smokers had a 1·26-fold higher risk of death than non-smokers, after adjusting for demographic variables. Participants who consumed alcohol had a decrease in adjusted HR of death compared with those who did not consume alcohol. Considering co-morbidities in model B1, we found that underweight participants still had a 1·45-fold higher risk of death compared with those of normal weight. Overweight and obese participants had a 14 % and 26 % decreased risk of death, respectively, compared with participants of normal weight, after adjusting for demographic variables and co-morbidities. Participants had a 1·35-fold increase in adjusted HR of death if they had an additional co-morbidity. Participants who were depressed had a 1·20-fold higher risk of death than those who were not depressed, after adjusting for demographic variables and co-morbidities. Model C, a full model, showed that underweight participants had a 1·36-fold higher risk of death compared with those of normal weight, after adjusting for demographic variables, co-morbidities and physical function impairment. Overweight and obese participants had a 16 % and 30 % decrease in adjusted HR of death, respectively, compared with those of normal weight. Furthermore, we analysed subgroup of obesity in model C1 and found that participants with a BMI of 27·0–28·0 kg/m2 exhibited a 50 % decrease in adjusted HR of death compared with that of normal-weight participants. Current smokers had a 1·32-fold higher adjusted HR of death compared with non-smokers. Participants had a 1·28-fold increase in adjusted HR of death if they had an additional co-morbidity. Participants had a 3·79-fold increase in adjusted HR of death per increased standard score of physical function impairment (Table 3).
Table 3 Factors influencing all-cause mortality among 4145 middle-aged and older adults, totalling 42 353 person-years, Taiwan Longitudinal Study on Aging, 1996–2007
HR, hazard ratio.
All models were adjusted for age, gender, education level and ethnicity.
Underweight, BMI<18·5 kg/m2; normal weight, 18·5 kg/m2≤BMI<24·0 kg/m2; overweight, 24·0 kg/m2≤BMI<27·0 kg/m2; obesity, BMI≥27·0 kg/m2.
*P<0·05, **P<0·01, ***P<0·0001.
Relationship between BMI category and all-cause mortality among participants with or without a pre-existing disease
Among participants with pre-existing hypertension, underweight individuals exhibited a 1·65-fold greater adjusted HR of death than did people of normal weight. Obese people exhibited a 31 % decrease in adjusted HR of death compared with people of normal weight. We further found that obese participants with a BMI of 27·0–28·0 kg/m2 had a 50 % decrease in adjusted HR of death compared with those of normal weight. Among the participants with pre-existing diabetes, obese participants with a BMI of 27·0–28·0 kg/m2 had a 59 % decrease in adjusted HR of death compared with participants of normal weight. Among the participants without any co-morbidity, underweight participants had a 1·55-fold higher adjusted HR of death compared with those of normal weight (Table 4).
Table 4 Relationship between BMI categories and all-cause mortality among 4145 middle-aged and older adults with or without pre-existing diseases, totalling 42 353 person-years, Taiwan Longitudinal Study on Aging, 1996–2007
HR, hazard ratio; M, number of deceased subjects in that group/total number of subjects in that group.
All models were adjusted for age, gender, education level, ethnicity, spouse status, current smoking and alcohol drinking status, co-morbidities and physical function impairment.
Underweight, BMI<18·5 kg/m2; normal weight, 18·5 kg/m2≤BMI<24·0 kg/m2; overweight, 24·0 kg/m2≤BMI<27·0 kg/m2; obesity, BMI≥27·0 kg/m2.
*P<0·05, **P<0·01, ***P<0·0001.
† Healthy participants had no co-morbidities.
Relationships of follow-up years and survival among the four BMI categories
Underweight participants had a significantly lower survival rate than normal-weight, overweight and obese participants during follow-up. Conversely, obese participants had a higher survival rate compared with other weight groups during follow-up (Fig. 2).
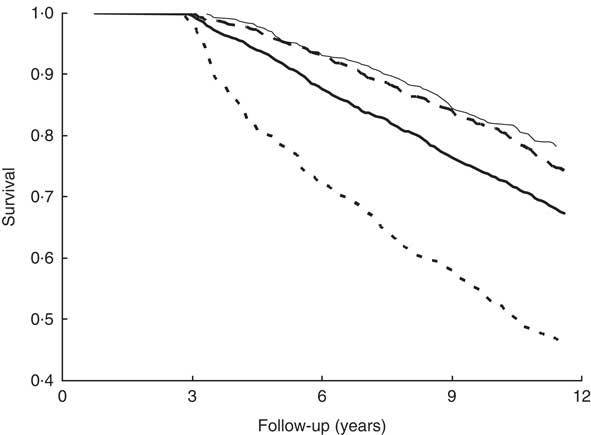
Fig. 2 Relationship of follow-up years and survival among the four BMI categories (![]() , underweight, BMI<18·5 kg/m2;
, underweight, BMI<18·5 kg/m2; ![]() , normal weight, 18·5 kg/m2≤BMI<24·0 kg/m2;
, normal weight, 18·5 kg/m2≤BMI<24·0 kg/m2; ![]() , overweight, 24·0 kg/m2≤BMI<27·0 kg/m2;
, overweight, 24·0 kg/m2≤BMI<27·0 kg/m2; ![]() , obesity, BMI≥27·0 kg/m2) using Kaplan–Meier analysis among 4145 middle-aged and older adults, totalling 42 353 person-years, Taiwan Longitudinal Study on Aging, 1996–2007
, obesity, BMI≥27·0 kg/m2) using Kaplan–Meier analysis among 4145 middle-aged and older adults, totalling 42 353 person-years, Taiwan Longitudinal Study on Aging, 1996–2007
Discussion
We investigated the relationship between all-cause mortality in middle-aged and older adults and current standard BMI categories used in Taiwan in a nationwide prospective cohort study. Participants with obesity had a 33 % lower risk of death compared with those of normal weight, after adjusting for demographic variables, smoking status, co-morbidities and physical function. The present study demonstrates that BMI, whether alone or adjusted for covariates, is inversely related to mortality among middle-aged and older adults, which is consistent with previous studies( Reference Beleigoli, Boersma and Diniz Mde 12 , Reference Auyeung, Lee and Leung 17 , Reference Janssen, Katzmarzyk and Ross 18 ).
Previous studies have demonstrated a strong relationship between BMI and total body fat( Reference Storti, Brach and FitzGerald 19 , Reference Taylor, Jones and Williams 20 ). BMI may not only be a good marker of adiposity in elderly people, but may also indicate that adiposity offers some protection against fatal diseases( Reference Chang, Beason and Hunleth 21 , Reference Singanayagam and Chalmers 22 ). The possible biological mechanisms that explain this ‘obesity survival paradox’ in elderly people may be associated with a lower rate of bone mass loss, which reduces the effects of fall and trauma episodes, and greater nutritional reserves to accommodate periods of acute stress( Reference Bouillanne, Dupont-Belmont and Hay 23 , Reference Chapman 24 ). Hong et al. indicated that the good prognosis among overweight or obese elderly may reflect the relative safety of storing lipophilic chemicals in adipose tissue rather than in other critical organs( Reference Hong, Kim and Lee 25 ).
It is important to consider pre-existing diseases when investigating the relationship between BMI and all-cause mortality for middle-aged and older adults. Because a lower BMI may be the result, not the cause, of pre-existing diseases, co-morbidities at baseline can result in reverse causation( Reference Flegal, Williamson and Pamuk 26 , Reference Hu, Willett and Stampfer 27 ). Table 2 shows that participants with higher BMI values had higher rates of hypertension and diabetes. However, Table 3 shows that the effect of obesity on the risk of death remained protective after adjusting for co-morbidities and symptoms of depression. This accentuates the effect of obesity on the lower risk of all-cause mortality, after adjusting for co-morbidities, symptoms of depression and physical function impairment. Conversely, underweight participants had a 1·36-fold higher risk of death compared with participants of normal weight, after adjusting for covariates.
Previous studies have shown that total mortality has a J- or U-shaped relationship with BMI. Mortality rates increase sharply at BMI values of less than 18·5 kg/m2 and greater than 30 kg/m2 ( Reference Jee, Sull and Park 4 , Reference Heymsfield and Cefalu 28 – Reference Pan, Yeh and Chen 30 ). However, previous research has not clearly defined the optimal BMI values for various age groups, with or without pre-existing diseases, based on all-cause mortality. Our study showed that obese participants with a BMI of 27·0–28·0 kg/m2 had the lowest all-cause mortality rate compared with normal BMI values when obese participants had hypertension or diabetes. In addition, people with higher BMI values had a lower rate for depression in our study. The finding is consistent with relatively fewer depressive symptoms among the obese population and a ‘jolly fat’ hypothesis in Chinese elderly( Reference Li, Ho and Chan 31 , Reference Yu, Chen and Liu 32 ).
The present nationwide longitudinal cohort study of middle-aged and older adults demonstrates that obesity is associated with a lower risk of death. We excluded deaths in the first 3 years of follow-up to limit the possibility of reverse causation. We also examined how a comprehensive assessment of baseline health status and physical function affects the relationship between BMI and all-cause mortality. The results are robust, and we used numerous models of multivariate logistic regression analysis and Kaplan–Meier analysis for the decreased risk of death in obese people. However, our study is restrained by some limitations for the following reasons. First, weight, height and co-morbidities used self-reported information, which might result in biased estimation. The lack of data on medication use, health behaviours and disease severity, which are potential confounding factors, may be a major limitation of the study.
Conclusion
In conclusion, our nationwide longitudinal study performed in Taiwan shows an increased risk of death in underweight people and a decreased risk of death in overweight and mildly obese people compared with people of normal weight among middle-aged and older adults. For people with hypertension or diabetes, mildly obese participants with a BMI of 27·0–28·0 kg/m2 had a lower adjusted HR of all-cause mortality compared with those having normal BMI values. An optimal BMI may be based on the individual, who exhibits pre-existing diseases or not.
Acknowledgements
Financial support: This work received part of financial support and administrative support from the Clinical Epidemiology Laboratory, Taichung Hospital, Ministry of Health and Welfare; and the Health Promotion Administration, Ministry of Health and Welfare. The funders had no role in the design, analysis or writing of this article. Conflict of interest: The authors declared that they had no conflict of interest. Authorship: All authors contributed significantly to the study. W.-S.C. and C.-J.Y. were responsible for the study conception/design. W.-S.C. and C.-J.Y. performed the collection and/or assembly of data. All authors contributed to data analysis and interpretation, writing of the manuscript and final approval of the manuscript. All authors are in agreement with the content of the manuscript. Ethics of human subject participation: The study was approved by the Ethics Review Board of the Health Promotion Administration, Ministry of Health and Welfare (BHP-2007-002).


