


Severe sepsis and septic shock are commonly encountered by medical-surgical intensive care unit (ICU) staff with an incidence rate of 3 per 1000 population.Reference Angus, Linde-Zwirble, Lidicker, Clermont, Carcillo and Pinsky 1 In spite of modern therapeutic interventions, in-hospital mortality rates remain relatively high ranging from 15-20%Reference Regazzoni, Zamora and Petrucci 2 , Reference Seymour, Rea, Kahn, Walkey, Yealy and Angus 3 and long-term mortality rates as high as 57%.Reference Storgaard, Hallas, Gahrn-Hansen, Pedersen, Pedersen and Lassen 4 Severe sepsis frequently leads to the onset of delirium, which is defined as an “acute, fluctuating change in mental status, with inattention and altered levels of consciousness”.Reference Pandharipande, Jackson and Ely 5 Prevalence of delirium is as high as 80% in critically ill patientsReference Barr, Fraser, Puntillo, Ely, Gélinas, Dasta, Davidson, Devlin, Kress, Joffe, Coursin, Herr, Tung, Robinson, Fontaine, Ramsay, Riker, Sessler, Pun, Skrobik and Jaeschke 6 and infection is a major etiological factor.Reference Arinzon, Peisakh, Schrire and Berner 7 The onset of delirium is associated with increased mortality, increased ICU length of stay,Reference Barr, Fraser, Puntillo, Ely, Gélinas, Dasta, Davidson, Devlin, Kress, Joffe, Coursin, Herr, Tung, Robinson, Fontaine, Ramsay, Riker, Sessler, Pun, Skrobik and Jaeschke 6 , Reference Girard, Pandharipande and Ely 8 increased ventilator timeReference Ely, Shintani, Truman, Speroff, Gordon, Harrell, Inouye, Bernard and Dittus 9 and cognitive impairments amongst survivors.Reference Suchyta, Jephson and Hopkins 10 - Reference Girard, Jackson, Pandharipande, Pun, Thompson, Shintani, Gordon, Canonico, Dittus, Bernard and Ely 13 However, despite the clinical importance of delirium during severe sepsis/septic shock, its underlying cause has remained elusive.
Hypoperfusion and multi-organ dysfunction are prominent in this patient population.Reference Angus and van der Poll 14 , Reference Jones and Puskarich 15 Most organ systems are monitored with a combination of clinical and biochemical indices. For example, renal perfusion is monitored by assessing urine output as well as plasma creatinine levels. However, there is currently no surrogate marker for cerebral perfusion. Therefore, a real time measurement of cerebral oxygenation could act as this much needed proxy for cerebral perfusion. Near infrared spectroscopy (NIRS) provides a simple, non-invasive, localized assessment of cerebral oxygenation. This measurement of cerebral oxygenation is promising as an indirect measurement of cerebral perfusion. It already correlates with other measures of cerebral perfusion, such as jugular venous bulb oxygen saturation, brain tissue oxygen tension, and computed tomography (CT) perfusion.Reference Kim, Ward, Cartwright, Kolano, Chlebowski and Henson 16 - Reference Taussky, O'Neal, Daugherty, Luke, Thorpe, Pooley, Evans, Hanel and Freeman 18 Furthermore, using NIRS to monitor cerebral oxygenation during coronary artery bypass surgery has yielded promising results. Cerebral desaturations were avoided and lead to significantly fewer incidences of organ dysfunction and a shorter length of ICU stay.Reference Murkin, Adams, Novick, Quantz, Bainbridge, Iglesias, Cleland, Schaefer, Irwin and Fox 19 Near infrared spectroscopy has also been used during carotid endarterectomyReference Murkin and Arango 20 to monitor decreases in brain tissue oxygen levels as a possible warning of cerebral ischemia that may require an intervention such as shunting.Reference Murkin and Arango 20 , Reference Moritz, Kasprzak, Arlt, Taeger and Metz 21 Therefore, NIRS is a feasible, non-invasive strategy to monitor cerebral oxygenation that may correlate with clinically relevant outcomes.
The objective of this pilot study was to demonstrate the feasibility of using NIRS to provide long-term continuous measurements of cerebral oxygenation in critically ill patients with severe sepsis/septic shock. The overall aim of our research program is to test the hypothesis that poor brain tissue oxygenation (as a surrogate marker of cerebral perfusion) when patients are acutely and critically ill, places them at risk of developing delirium throughout their ICU stay. To assess this, our secondary outcomes explored the correlation between cerebral oxygenation and hemodynamic variables, as well as whether or not cerebral oxygenation correlated with the development of delirium in patients with severe sepsis/septic shock.
Materials and Methods
Study design, patient selection, and treatment
This prospective observational study was performed in an academic 33-bed general medical/surgical intensive care unit that is the regional level 1 trauma centre and tertiary referral centre. The local Health Sciences Research Ethics Board approved the study protocol, which included deferred consent for 24 hours due to the non-invasive nature of the monitoring device. Patients were considered eligible if they were admitted to the ICU within 24 hours of meeting the Society of Critical Care Medicine’s criteria for either severe sepsis or septic shock,Reference Dellinger, Levy, Rhodes, Annane, Gerlach, Opal, Sevransky, Sprung, Douglas, Jaeschke, Osborn, Nunnally, Townsend, Reinhart, Kleinpell, Angus, Deutschman, Machado, Rubenfeld, Webb, Beale, Vincent and Moreno 22 and were adult patients over the age of 17. Exclusion criteria included a life expectancy less than 24 hours, an underlying diagnosis of cognitive dysfunction (including dementia), or a reason that they may not be able to participate in follow up (these patients are part of a larger cohort examining the long-term neurological effects of critical illness). The treatment of each patient was at the discretion of the attending intensive care physician. The treating physicians did not have access to the brain tissue oxygen (BtO2) levels.
Data collection
Enrolled patients had their hourly hemodynamic variables [e.g. systolic blood pressure (SBP), diastolic blood pressure (DBP), mean arterial pressure (MAP), heart rate (HR)], vasoactive, and sedative/analgesic medications recorded. Parameters measured from arterial blood gas, were recorded when ordered by the attending physician. Brain tissue oxygen levels were measured with the FORESIGHT monitor (CASMED, Caster Medical, Canada) equipped with the five cm sensor that was placed on the patients’ forehead which can report regional cerebral oxygenation at an approximate depth of two to three cm.Reference Scott and Hoffman 23 The probe on the patient’s forehead emits varying wavelengths of infrared light (700-1000 nm), which pass through skin and bone with only minimal absorption.Reference Scott and Hoffman 23 The light that returns to the sensor represents the amount of spectral absorption occurring in the tissue bed; venous circulation accounts for the majority (75-80%) of the NIRS signal.Reference Marin and Moore 24 The sensor measures changes in oxy- and deoxyhemoglobin in brain tissue at the arteriole, capillary, and venule level,Reference Ikeda, MacLeod, Grocott, Moretti, Ames and Vacchiano 25 These changes are represented as absolute values of BtO2 that range from 0-99%, tend to remain fairly stable/persistent over time,Reference Marin and Moore 24 and can be estimated during normocapnia and varying degrees of hypoxia.Reference Ikeda, MacLeod, Grocott, Moretti, Ames and Vacchiano 25 Scalp and skull signals are also measured from a second sensor, and subtracted from the overall signal using a proprietary algorithm. We began recording immediately after patient enrollment and BtO2 levels were measured by the monitor every two seconds for the first 72 hours of the patients’ ICU stay.
To screen for delirium, patients were assessed daily during their entire ICU stay with the Confusion Assessment Method (CAM)-ICU, a validated tool for detecting delirium in critically ill patients.Reference Ely, Margolin, Francis, May, Truman, Dittus, Speroff, Gautam, Bernard and Inouye 26 One of the trained researchers performed the daily delirium screening at a time that was convenient for the patient, their family, and the medical team directing their care. However, there was not a systematic procedure to coordinate the time of day at which each patient was assessed.
Statistics
The primary outcome of this study was feasibility. We defined feasibility a priori as the ability to perform long-term (72-hour) continuous recordings of BtO2 levels in critically ill patients with severe sepsis and septic shock. Additional assessments of feasibility included 1) daily screening of the nursing staff to determine if the device was interfering with nursing care, procedures, or imaging, 2) enrollment rates, 3) consent rates, and 4) challenges with the consent process. Secondary outcomes assessed were the correlations between non-invasive measurements of BtO2 with hemodynamic and physiological parameters (including SBP, MAP, HR, peripheral oxygen saturation (SaO2) and partial pressure of carbon dioxide (pCO2). This was performed by calculating linear correlation coefficients with GraphPad Prism (v6). To provide graphical representation of the correlation coefficients, a correlation plot was generated using the R software package. 27 T-tests were used to determine if there were differences in physiological variables (including mean BtO2), sedative medications, and narcotics, between patients who were delirious for the majority of their ICU stay compared with patients who were not. Results of these comparisons were considered significant if p<0.05. For these comparisons, the Bonferroni correction was used.
Role of device manufacturer
Caster Medical Systems provided the FORESIGHT NIRS monitor at no cost to the investigators. The disposable sensors were purchased for each patient. Only the study investigators had access to the study data. The device manufacturer had no role in study design, data collection, statistics, or manuscript preparation.
Results
Patients
Between March 1st and September 30th 2014, 62 patients were considered eligible for the study (Figure 1). Fifty-two of these patients met at least one exclusion criteria. There were no instances of refused or withdrawn consent. Baseline demographics and clinical features are shown in Table 1. All patients had a diagnosis of septic shock, were mechanically ventilated and were on vasoactive agents at the time of enrolment. The high severity of illness of this patient cohort is reflected in the mortality rate of 50%. The majority of patients (90%) had an underlying diagnosis of hypertension (a risk factor for the development of deliriumReference Barr, Fraser, Puntillo, Ely, Gélinas, Dasta, Davidson, Devlin, Kress, Joffe, Coursin, Herr, Tung, Robinson, Fontaine, Ramsay, Riker, Sessler, Pun, Skrobik and Jaeschke 6 ).

Figure 1 CONSORT style study flow diagram.
Table 1 Patient demographics and clinical features.
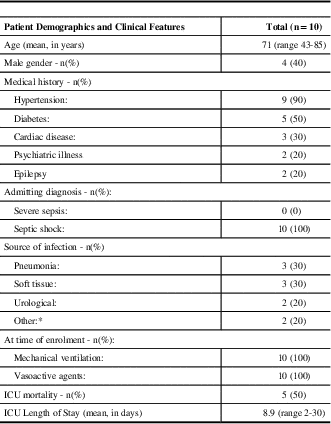
* other includes one spinal epidural abscess, and one patient with 3/4 SIRS (systemic inflammatory response syndrome) criteria, with presumed infection because no other likely etiology. n=number of patients; ICU=intensive care unit.
Recording of BtO2
The NIRS monitor used in this study has an internal sensor for detecting signal strength and it discontinued recording data once signal strength was compromised. All 10 patients had adequate signal strength at the beginning of the 72-hour recording; however, the signal strength universally degraded over the 72-hour period. This required repositioning of the sensors and often using additional adhesive, such as 3M Cavilon No Sting Barrier Film or 3M Tegaderm Film, to ensure good skin contact. In total, the NIRS monitor recorded 81% of the available data. There was variability from subject to subject, ranging from 45-98% of data captured per patient. The patient with the lowest number of recordings had monitoring suspended as they were taken out of the ICU in order to have a procedure performed. Another patient was transported out of the ICU with the monitor attached with backup battery power (four hours battery life) in order to have a CT head performed. The NIRS sensors did not interfere with the CT imaging. According to the device information, patients may rarely develop a rash to the adhesive used. No adverse events were documented in our patient cohort. The bedside nursing staff was contacted daily. Neither the NIRS monitor nor sensors interfered with their abilities to assess, and provide care for, their patients.
Correlation between BtO2 and patient variables
There was considerable intra- and inter-patient variability in the degree of correlation between BtO2 and hemodynamic variables measured, including SBP, DBP, MAP, and HR. Figure 2 shows how BtO2, HR, and MAP change over time in four sample patients. While one patient showed a direct correlation between increased heart rate and increased BtO2 (Figure 2A, B), another patient showed an inverse relationship (Figure 2, C,D). Throughout the recording period, patients would show variable relationships between BtO2 and their hemodynamic parameters. For example, the sample patient shown in Figure 2 (E) exhibits increases in BtO2 with increasing (white arrows), decreasing (black arrow), and constant (gray arrow) MAP. This significant variability throughout the recording period is a possible explanation for the non-significant linear correlation seen in other patients (Figure 2F). Another sample patient demonstrated a weak, but statistically significant inverse correlation between MAP and BtO2 (Figure 2G,H). The highly variable manner in which BtO2 responded to changes in hemodynamics in our cohort of patients with septic shock is summarized in Figure 3. This figure is a correlation plot designed to visually represent a high volume of data, and part of the feasibility of this study is demonstrating efficient ways of representing large data series. Variability was also observed in the way BtO2 changed in response to pCO2, peripheral oxygen saturation (pO2), and pH (Figure 3). The R2 values are shown in Table 2.

Figure 2 BtO2 levels vary inconsistently with HR and MAP. Four sample patients are shown. Panel A shows the changes in BtO2 and HR over time. In this particular patient, there was a significant linear correlation (B) between increases in HR and increases in BtO2. Another patient however (C) had an inverse linear correlation (D) between these variables. In another sample patient, there are obvious concurrent increases in MAP and BtO2 (E, white arrows), but the same patient will demonstrate increasing BtO2 in response to falling MAP (black arrow), or an increase in BtO2 with a constant MAP (gray arrow). Because of this variability, there is a weak and non-significant linear correlation between these two variables (F). In the fourth sample patient, BtO2 increases over time as MAP decreases (G), resulting in a significant negative linear correlation (H).

Figure 3 Correlation plot provides visual representation for the correlation between BtO2 and other hemodynamic/physiological parameters. Each cell represents the R2 value for the correlation between BtO2 and the clinical parameter in the column, for the individual patient in the row. If there is no ellipse, then the correlation coefficient is zero. The strength and direction of correlation are dually represented. The increasing strength is represented by the density of the colour as well as by narrowing radius of the ellipse. The direction of the correlation (positive or negative) is represented by the colour of the ellipse (blue=positive correlation; red=negative correlation), as well as its orientation (ellipses angled up and to the right represent positive correlations). The asterisk indicates significant linear correlations (p<0.05). The grey rectangles for patients 1,2,4, and 8 indicate that insufficient values were available to calculate the correlation coefficient.
Table 2 Correlation between physiological parameters and brain tissue oxygenation for each individual patient.

Grey shaded cells indicate insufficient values were available to calculate linear correlation coefficients.
R2=linear correlation coefficients, BtO2= brain tissue oxygenation levels, SBP=systolic blood pressure; DBP=diastolic blood pressure, MAP=mean arterial pressure, HR=heart rate, SaO2=peripheral oxygen saturation, pO2=partial pressure of oxygen, pCO2=partial pressure of carbon dioxide, *=p<0.052.
Brain tissue oxygen levels are lower in patients who experience more delirium
We performed delirium screening on a daily basis with the CAM-ICU. On the basis of this testing each patient was assigned to one of three groups daily, comatose (RASS −4 or −5; unable to assess with the CAM-ICU), delirious (CAM-ICU positive) and intact (CAM-ICU negative). Three patients were comatose (RASS −4 or −5) during their entire ICU stay. Of the remaining seven that could be assessed with the CAM-ICU, five were delirious for at least part of their ICU stay. Patients who spent more time neurologically intact (CAM-ICU negative) tended to have higher mean BtO2 levels (Figure 4A). When we assessed the total number of recordings across the spectrum of BtO2 levels (30-100%), patients who spent the majority of their ICU stay CAM-ICU negative (n=4) had a higher frequency of BtO2 levels above 70% than patients who spent the majority of their ICU stay CAM-ICU positive (Figure 4B). We compared the mean values of MAP, HR, SaO2, and BtO2 levels between patients who spent the majority (≥50%) of ICU time either delirious or non-delirious. Only BtO2 levels were statistically different between the two groups (p<0.0001), with lower levels in patients who spent the majority of their ICU stay delirious (Figure 4C). Additionally, we recorded the sedative and analgesic infusions provided to patients during the 72-hour period of BtO2 recording. There were no significant differences in the total dose of midazolam (Figure 4D), fentanyl (Figure 4E), or propofol (Figure 4F) between patients that spent the majority of their ICU stay delirious, versus those that spent the majority of their time neurologically intact.

Figure 4 Patients that experience more delirium have lower levels of BtO2. Patients were assessed daily for delirium with the CAM-ICU, and were categorized as either comatose (RASS −4,−5; unable to screen with CAM-ICU; black bars), CAM-ICU positive (delirious; grey bars), or CAM-ICU negative (intact; white bars). (A). The number of days spent in each condition is represented as a percentage of the total number of days in the ICU for each individual patient arranged in order of increasing mean levels of BtO2. (B). Lower BtO2 values were recorded more frequently in patients who screened positive for delirium during the majority of their ICU stay (grey area) compared to patients who were intact for the majority of their ICU stay (white area). (C). BtO2 levels were significantly lower in patients experiencing delirium (grey bars) during the majority of their ICU stay when compared to intact patients (white bars). However, no differences were observed in MAP, HR, or SaO2. Additionally, there were no significant differences in total dose of midazolam (D), fentanyl (E), or propofol (F) between patients who were delirious (grey bars) or intact (white bars) for the majority of their ICU stay.
Relationship between BtO2 and hemoglobin concentration
In addition to heart rate, MAP, and peripheral oxygen saturation, the concentration of hemoglobin is an important determinant of oxygen delivery to tissues. Therefore, we assessed whether there was a relationship between hemoglobin concentration and BtO2. As shown in Figure 5, there was a trend towards having a direct linear correlation between increasing BtO2 levels and hemoglobin concentration; however, this did not reach statistical significance (p=0.07). While this graph again highlights the fact that patients that spent the majority of their time non-delirious (white circles) tended to have a higher BtO2, there was no significant difference in the mean hemoglobin concentration between patients that were comatose, delirious, or intact (p>0.05).

Figure 5 Scatter plot showing the correlation between patient hemoglobin (Hb) levels, and brain tissue oxygenation (BtO2) levels. Shading of points corresponds to neurological status, with white points from non-delirious patients, grey points from delirious patients, and black points for comatose patients. The blue line represents a linear model fit to the points, with grey shaded area corresponding to the standard error of the model. Pearson correlation coefficient for the relationship between BtO2 and Hb is 0.32 (p=0.07).
Discussion
Feasibility and safety
This study screened 62 eligible patients with severe sepsis and septic shock over a six-month period of time. As 52 of these patients met at least one exclusion criteria, only 10 were recruited into the study. Thus the recruitment rate was 1.7 patients/month. This may seem low given our large 33-bed medical surgical ICU, however, it is in keeping with other studies of critically ill patients. Recruitment rates may vary, from less than one patient every two months in large and complex multi-centre trials (e.g. The ARISE Trial 28 ), to two to three patients per month in smaller single centre observational studies.Reference Pfister, Siegemund, Dell-Kuster, Smielewski, Rüegg, Strebel, Marsch, Pargger and Steiner 29 Low rates of recruitment may be attributed to the lack of 24-hour availability of study coordinators, or simply reflect the challenges of recruiting patients in a complex critical care environment. In order to detect a moderate correlation between average BtO2 and proportion of delirium days experienced, 100 evaluable patients would be required to achieve 87% power at a 2-sided alpha=0.05. In our pilot study, 30% of patients were comatose for their entire ICU stay and could not be screened for delirium. Therefore, future studies investigating the relationship between BtO2 and delirium would need recruitment of 150 patients. Furthermore, in light of the fact that the majority of our patients were excluded because they were beyond the 24-hour window, future studies should focus on earlier identification of patients with severe sepsis and septic shock, with particular emphasis on early recognition in the emergency department.
With regards to data collection, ours is the first study to demonstrate the feasibility of using NIRS to perform long-term continuous recording of BtO2 in patients with septic shock. The device captured most of the available data, did not interfere with the care of the critically ill patient, and no adverse events occurred. Throughout the course of the study in the ICU, some factors were discovered which can interfere with NIRS recordings. These factors include: patient transfer for various procedures (e.g. magnetic resonance imaging), loss of battery power on the cerebral oximeter, and ambient light interfering with the cerebral oximeter acquiring a signal. However, these interferences can be quickly remedied by plugging in the oximeter during patient transfer to restore power, reattaching the sensor if it is disconnected for a medical procedure, and closing the blinds in a patient’s room to help block ambient light from degrading the NIRS signal. Furthermore, additional adhesives were often used to keep the sensor in place as the original adhesive degraded after the first 24 hours. This additional sensor upkeep was minor and only took a couple minutes per patient. Additional length of upkeep was minor and not recorded since it did not greatly impact patient care or data collection. Despite these minor challenges, we were able to assess the relationship between BtO2 and hemodynamic parameters, measurements of gas exchange (peripheral oxygenation pO2, and pCO2), as well as the development of delirium as an indicator of acute neurological dysfunction.
Determinants of BtO2 in patients with septic shock
During the first 72 hours of critical illness, we demonstrated significant inter- and intra- individual variability in the way BtO2 varies with hemodynamic parameters, such as systolic blood pressure and heart rate, as well as with peripheral oxygenation and pCO2. In some patients, there was a positive correlation between SBP, MAP, and HR with BtO2. In other patients however, an inverse correlation was documented. The high degree of variability in the way BtO2 responds to changes in hemodynamics and oxygenation may significantly impair our ability to develop standardized algorithms to optimize BtO2, which exist for patients undergoing cardiac surgery.Reference Denault, Deschamps and Murkin 30 The variable manner in which BtO2 changes in response to fluctuations in hemodynamics may be a reflection of altered cerebral autoregulation in patients with severe sepsis and septic shock.Reference Pfister, Siegemund, Dell-Kuster, Smielewski, Rüegg, Strebel, Marsch, Pargger and Steiner 29 Using transcranial doppler (TCD), Pfister and colleaguesReference Pfister, Siegemund, Dell-Kuster, Smielewski, Rüegg, Strebel, Marsch, Pargger and Steiner 29 demonstrated altered cerebral vessel reactivity in patients experiencing delirium in the context of septic shock but not in patients that screened negative for delirium. Similarly, Pierrakos et al.Reference Pierrakos, Attou, Decorte, Kolyviras, Malinverni, Gottignies, Devriendt and De Bels 31 used TCD to demonstrate increased cerebrovascular resistance in septic patients experiencing delirium, compared to septic, non-delirious patients. Other studies using TCD and NIRS to assess cerebral autoregulation in sepsis/septic shock have documented intact autoregulation, with the exception of extremes of blood pressure and pCO2;Reference Steiner, Pfister, Strebel, Radolovich, Smielewski and Czosnyka 32 however, the authors of the study did not comment on whether or not the patients were delirious at the time of assessment. The considerable inter-individual variability in correlation between BtO2 and hemodynamics may also be due to changes in microvascular reactivity and endothelial dysfunction observed in patients with septic shock.Reference De Backer, Orbegozo Cortes, Donadello and Vincent 33 However, this is beyond the resolution of NIRS technology.
Brain tissue oxygen levels and acute neurological dysfunction in patients with septic shock
Although the primary outcome of this study was feasibility, one of our secondary outcomes was to explore possible differences in hemodynamics and BtO2 among patients with septic shock who are experiencing acute neurological dysfunction. Our findings of significantly lower mean BtO2 levels in patients with delirium raises the interesting possibility that poor brain oxygen delivery in the first 72 hours after admission for septic shock may contribute to acute neurological dysfunction in these patients. Others have performed one hour of NIRS monitoring beginning 48 hours after ICU admission to assess BtO2 in patients with septic shock.Reference Pfister, Siegemund, Dell-Kuster, Smielewski, Rüegg, Strebel, Marsch, Pargger and Steiner 29 They did not find differences in values between patients experiencing delirium and patients not experiencing delirium. This differs from the results of our small pilot study that demonstrated a significant difference in BtO2 between delirious and non-delirious patients. The lack of agreement in these findings likely reflects the small sample sizes, as well as significant methodological differences. Nevertheless, together with our data, these data provide a compelling rationale to further explore the relationship between BtO2 and delirium in a large prospective study. Another important limitation of NIRS technology is that it is only designed to record frontal lobe tissue oxygenation. Given the importance of the frontal lobes in attention and executive function, they are likely relevant to the clinical manifestations of delirium. This is supported by the fact that patients who experience a greater duration of delirium in the ICU exhibit a greater degree of frontal lobe atrophy on magnetic resonance imaging three months later.Reference Gunther, Morandi, Krauskopf, Pandharipande, Girard, Jackson, Thompson, Shintani, Geevarghese, Miller, Canonico, Merkle, Cannistraci, Rogers, Gatenby, Heckers, Gore, Hopkins and Ely 34
Conclusions
Continuous, non-invasive recording of BtO2 with NIRS is feasible in patients with septic shock. This study will provide the protocols necessary for a larger prospective observational study to further examine the relationship between BtO2, physiological parameters, and acute neurological dysfunction.
Acknowledgments
The authors thank our study coordinators, Ms. Jenna Podilchak and Ms. Suzy Fleury, for their assistance with getting consent, initiating the NIRS monitoring, and providing support for the bedside nursing staff and thank Dr. Andrew Day for his statistical expertise.
Statement of Authorship
MW participated in data collection, data analysis, and drafting of the manuscript. AS participated in data collection and data analysis. DM participated in data analysis as well as preparing and editing the final draft of the manuscript. CF, DH and JM participated in the conceptualization and design of the study, as well as editing the final draft of the manuscript. JGB was the principal investigator and was responsible for design and implementation of the study, data collection and analysis, as well as writing and editing the final draft of the manuscript.
Disclosures
Daniel Howes has the following disclosures: Queen’s University, SEAMO innovation grant recipient. J. Gordon Boyd receives an honourarium from EMD Serono for drafting and grading a written exam for Canadian Neurology trainees. Cathy Ferri, Michael Wood, David Maslove, Andy Song and John Muscedere have nothing to disclose.
Daniel Howes, Cathy Ferri, Michael Wood, David Maslove, J. Gordon Boyd and Andy Song report no competing interests. John Muscedere is the scientific director of Tech Value Net.


