


Over the course of the day, the amount and pattern of food and fluid intake changes substantially(Reference de Castro1). People eat larger and larger amounts but eat again sooner as the day progresses(Reference de Castro1–Reference de Castro, Bellisle and Feunekes3). This indicates that the satiating properties of ingested nutrients decline precipitously over the course of the day, with foods eaten in the morning producing greater satiety than foods eaten later in the day, and foods eaten in the evening producing much less satiety than foods eaten earlier. This has consequences for the total amounts ingested during the day. Eating a large proportion of intake in the morning has been associated with lower overall intake, while eating a high proportion of intake in the evening has been associated with higher overall intake(Reference de Castro4).
The associations between the time of day of intake and total intake appear to be macronutrient specific(Reference de Castro5). That is, morning carbohydrate intake has been associated with reduced daily carbohydrate intake, morning fat intake associated with reduced daily fat intake and morning protein intake associated with reduced daily protein intake. Hence, the morning intake of each macronutrient is inversely associated with the total intake of that same macronutrient over the entire day. Since different types of foods contain differing proportions of macronutrients, it stands to reason that ingesting different types of foods at different times of day may influence macronutrient intakes and consequently overall intake.
There is considerable individual variation in the types of foods and their macronutrient compositions eaten in the morning(Reference Siega-Riz, Popkin and Carson6). Since the amount and macronutrient composition of foods eaten at different times of day can influence overall intake, it would be reasonable to expect that people who eat different foods at different times of day would have different levels of overall intake and as a result different weights and levels of body fatness. Indeed, it was demonstrated that people who ate high-carbohydrate breakfasts had significantly lower BMI than people who skipped breakfast or ate a high-protein breakfast(Reference Cho, Dietrich and Brown7) and children with greater intakes of ready-to-eat breakfast cereals had significantly lower body weights and BMI(Reference Albertson, Anderson and Crockett8) and significantly lower fat intakes(Reference Gibson and O'Sullivan9). In addition, overweight individuals tend to skip breakfast(Reference Boutelle, Neumark-Sztainer and Story10–Reference Vanelli, Iovane and Bernardini12) and eat a larger proportion of their daily intake in the evening(Reference Forslund, Lindroos and Sjöström13, Reference Thompson, Ballew and Resnicow14), while those who eat breakfast frequently tend to have lower body weights and BMI(Reference Affenito, Thompson and Barton15, Reference Rampersaud, Pereira and Girard16).
Hence it is important to look systematically at the consumption of varying food types at different times of the day and their relations with overall and macronutrient intakes. The present research attempted to investigate this issue by reanalysing the data on the intakes of free-living individuals that we have acquired with 7 d diet diaries(Reference de Castro1, Reference de Castro2, Reference de Castro4, Reference de Castro5, Reference de Castro, Berthoud and Seeley17–Reference Redd and de Castro29). The total intakes of thirty-one different food and beverage types occurring during the morning, afternoon and evening were identified and related to overall food energy and macronutrient intakes during the entire day.
Materials and methods
Participants
The data were collected from 1009 individuals consisting of 388 males and 621 females. They were recruited as participants for a number of prior studies of intake control in human subjects(Reference de Castro1, Reference de Castro2, Reference de Castro4, Reference de Castro5, Reference de Castro, Berthoud and Seeley17–Reference Redd and de Castro29). Obviously, both the participants and the experimenter were unaware that the time of day and intake was being studied. The majority of the participants, 536, were paid $30 to participate and also received a detailed nutritional analysis of their intake although 354 participated solely for the detailed nutritional analysis, while 119 were undergraduate students who satisfied a course requirement. The participants had a mean of 34·2 (sd 6·2) years, 69·0 (sd15·9) kg and 1·67 (sd 0·10) m and had a mean BMI of 24·6 (sd 4·6) kg/m2. In order to participate, the individuals could not be actively dieting, pregnant or lactating, on chronic medication, or alcoholic as ascertained with a demographic questionnaire. The detailed description and analysis of the overall, macronutrient and meal intakes of these participants have been presented in prior publications(Reference de Castro4, Reference de Castro5) and will not be repeated here. The study was approved by the Georgia State University Institutional Review Board.
Procedure
For a detailed review of the method, reliability and validity of the diet–diary procedure see de Castro(Reference de Castro30, Reference de Castro31). The participants were given a small (8 × 18 cm) pocket-sized diary and were instructed to record in as detailed a manner as possible every item that they either ate or drank, the time they ate it, the amount they consumed and how the food was prepared. The participants initially recorded this information for a day and reviewed the records with the experimenter. They then recorded their intake for seven consecutive days. Afterwards, they were contacted to clarify any ambiguities or missing data. For 536 participants, two individuals who ate with the participant were contacted and asked to verify the reported intake. In some cases, difficulty was encountered in remembering exactly what was eaten. However, in no case was the diary report contradicted in either the nature or the amount(Reference de Castro30, Reference de Castro31).
Data analysis
The foods reported in the diaries were assigned codes by an experienced dietitian from a computer file containing the nutrient compositions of common food items created from the U.S. Department of Agriculture Handbooks no. 8 and 456 of the Nutritive Value of American Foods, from package labels, from personal communications with food industry sources and from the present published literature. The coder was unaware of the experimental hypotheses and the participants' characteristics and did not interact directly with the participants. Total daily intakes of food energy, carbohydrate, fat, protein and dietary energy density (kJ/g) were calculated by summing the contributions of the individual items. Intakes in grams were also calculated for twenty-four different food types: fruits; dairy foods including cheese, butter, yogurt; ice cream-milk or sherbet; candy; soup; seafood; beef; poultry; other meats including pork, veal, lamb; pasta and noodles; pizza; rice; potatoes; legumes; nuts and seeds; other vegetables; bread and crackers; chips and snacks; breakfast cereal; other breakfast foods including pancakes, etc.; eggs; pastry including cookies, pies, cakes; sugar including honey and jam; condiments including sauces and salad dressings; seven different drink types including water, alcoholic drinks, sugared sodas, diet sodas, milk, coffee/tea, fruit juices. The specific food and beverage item types that were chosen for study were selected to encompass a range of different foods and beverages and for practical reasons because they could be easily identified and separated in the computer file of food/beverage items and because they were ingested frequently enough by enough different subjects that meaningful analyses could be performed.
To investigate the influence of morning, afternoon and evening intake of different types of foods on overall intake, the total amounts of food energy, carbohydrate, fat and protein and the gram amounts of the twenty-four food and seven beverage types ingested during three periods during the day 04.00–10.29, 10.30–16.59 and 17.00 hours were calculated. The morning period was specifically selected to capture most intakes that would be termed breakfast but not lunch. Similarly, the afternoon period was selected to capture most of the intakes termed lunch and afternoon snack, while the evening period was chosen to capture most of the intake termed dinner and evening snack. In addition, the percentages of the total gram intake occurring during each period of each of the food and beverage types were calculated.
All analyses were performed within subjects. That is each participant's intake under one condition was compared with the same participant's intake under another condition. As discussed by de Castro(Reference de Castro32), this is the most appropriate and valid method for analysing self-report data. To assess the relation between the time of the day of intake and the intake of particular types of foods, multiple linear regression analyses(Reference Lunnebord and Abbott33) were performed to predict the overall daily intakes on the basis of the proportions of intake ingested during each period and the percentage of the total gram intake occurring during each period of each of the food and beverage item types. Since the amount ingested during a period is highly correlated with the total amount eaten over the day, the proportion of the intake during each period was used instead of the absolute amounts. Since each food and beverage type has a characteristic pattern of intake over the day and often was ingested predominantly during specific periods, the percentage of the total gram intake occurring during each period for each item type was used. These proportions were then used in the multiple regressions predicting the absolute amounts ingested over the entire day for each subject individually. Separate regressions were performed predicting total daily food energy intake, and the overall daily intakes of carbohydrate, fat and protein. In addition, the dietary energy density of the foods ingested during each period was paired with the percentage of the total gram intake occurring during each period for each item type in multiple regressions predicting the absolute amounts ingested over the entire day for each subject individually. Mean standardised regression coefficients (β coefficients) were then calculated over all participants and for male and female participants separately and compared with zero with a t test.
To make the multiple regression results more concrete, days were identified when the proportions of the daily intake of the individual food and beverage types ingested were above or below the mean level for each individual for the morning, afternoon or evening periods. The total amounts eaten on those days of food energy, carbohydrate, fat and protein, and the twenty-four food and seven beverage types were then compared. For example, the total amounts ingested on days in which an individual ate a proportion of their morning intake of breakfast cereals that was greater than the mean level for that individual for the morning were compared with the total amounts ingested on days when the proportion of breakfast cereals in the morning was below the mean level. The analysis was completed for days when the proportion of total intake was above and below the mean for the afternoon and a final analysis compared evenings with above and below the mean proportionate intakes. These analyses were repeated for the intakes of each of the twenty-four food and seven beverage item types. Repeated-measures ANOVA were used to compare the intakes for below and above the mean days for the three periods. All results were significant at α < 0·05.
Results
The overall, macronutrient and meal intakes for these data have been described in detail in prior publications(Reference de Castro4, Reference de Castro5).
Time of day of amounts of food and beverage type intake
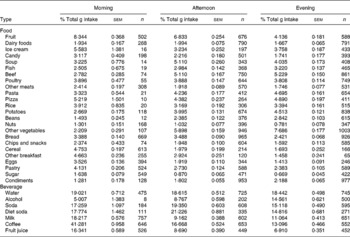
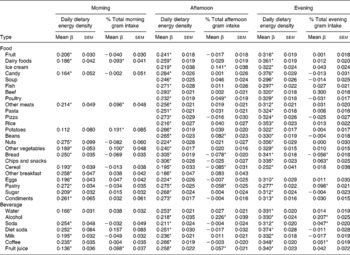
The proportions of the total gram intake ingested during the morning, afternoon and evening varied considerably among the foods and beverages (Table 1). The highest proportion of intake in the morning for the foods was fruit, ingested by 50 % of the participants and for beverages, coffee and tea, ingested by 64 % of the participants. In the afternoon, the highest proportion of intake for the foods was again fruit, ingested by 67 % of the participants, but diet soda was the highest among the beverages, ingested by 33 % of the participants. In the evening, other vegetable types, ingested by 99 % of the participants, and water, ingested by 74 % of the participants, constituted the highest proportions of intake. Eleven item types were ingested in the morning by very few ( < 10 %) of the participants, while only one type (other breakfast foods) was in the evening.
Table 1 Intakes (in g) of the food and beverage types for the morning, afternoon and evening
(Mean values with their standard errors)
Time of day, proportionate energy intake and total daily intake
The total amount eaten over the entire day was associated with the amounts and characteristics of the food eaten during different times of the day. The mean β coefficients from the multiple regressions predict the total food energy intake over the entire day on the basis of the proportion of the individual total daily food energy intake ingested during the morning (Table 2), afternoon (Table 3) and evening (Table 4) periods and the proportion of the total gram intake for the morning, afternoon or evening ingested of the food and beverage types. The β coefficients were presented only if at least 10 % of the participants ingested a food type during the period. The β coefficients for the proportion of the individual total daily intake ingested during the morning indicated predominantly significant inverse relations with overall intake (Table 2), while for the afternoon some of the β coefficients indicated small significant inverse relations with overall intake (Table 3) and for the evening the β coefficients indicated predominantly significant positive relations with overall intake (Table 4). Hence, the multiple regression analysis indicated that higher proportional energy intake in the morning was associated with lower overall intake, while higher proportional energy intake in the evening was associated with higher energy intake for the entire day; more in the morning and less in the evening associated with lower total daily intake.
Table 2 Overall daily energy intake on the basis of the proportions of intake ingested during each period and the percentage of the total gram intake occurring during the morning period of each of the food and beverage item types, together with the total daily energy intake on days when the proportion of intake was below and above the mean for individual subjects for the morning period
(Mean β coefficients or values with their standard errors)
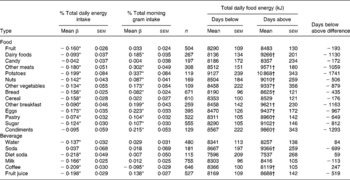
* β Coefficients are significantly different from zero as assessed with a t test (P < 0·05).
† Intakes on above the mean days are significantly different from intakes on below the mean days as assessed with ANOVA (P < 0·05).
Table 3 Overall daily energy intake on the basis of the proportions of intake ingested during each period and the percentage of the total gram intake occurring during the afternoon period of each of the food and beverage item types, together with the total daily energy intake on days when the proportion of intake was below and above the mean for individual subjects for the afternoon period
(Mean β coefficients or values with their standard errors)
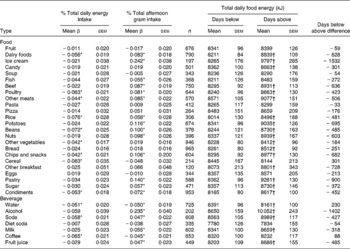
* β Coefficients are significantly different from zero as assessed with a t test (P < 0·05).
† Intakes on above the mean days are significantly different from intakes on below the mean days as assessed with ANOVA (P < 0·05).
Table 4 Overall daily energy intake on the basis of the proportions of intake ingested during each period and the percentage of the total gram intake occurring during the evening period of each of the food and beverage item types, together with the total daily energy intake on days when the proportion of intake was below and above the mean for individual subjects for the evening period
(Mean β coefficients or values with their standard errors)
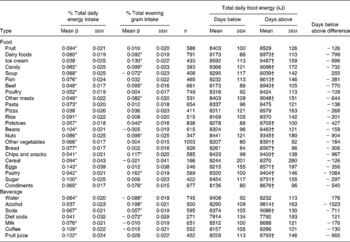
* β Coefficients are significantly different from zero as assessed with a t test (P < 0·05).
† Intakes on above the mean days are significantly different from intakes on below the mean days as assessed with ANOVA (P < 0·05).
Morning food and beverage type intake and total daily intake
Multiple regressions were performed to predict the total daily food energy intake on the basis of the proportion of the individual daily intake ingested during the morning and the proportion of the total gram intake for the morning ingested of the food and beverage types (Table 2). A positive β coefficient implies that ingestion of the item type was associated with greater total intake beyond the influence of the proportionate energy intake during that period, while a negative β coefficient implies that it was associated with lower overall intake. It is clear from the table that most item types have positive β coefficients for those that are significant. For morning intake, in descending order of β coefficient magnitude, ingestion of potatoes, other meats, eggs, condiments, other breakfast foods, dairy foods, other vegetables, fruit juice, sugar, pastry, nuts and bread have significant positive β coefficients and were associated with greater total daily intake. On the other hand, fruit, candy, breakfast cereal, water, soda, diet soda and milk did not have significant β coefficients, while coffee/tea was the only morning type with a significant negative association with overall intake.
To look in a little different way at the relation of morning food and beverage type intake with the total daily energy intake, the individuals' intakes on days when they ate relatively less of the food and beverage type during the morning were compared with the days when the same individuals ate relatively more. The differences between total daily energy intakes on days when the proportions of morning intake of the individual food and beverage types were below or above the mean levels were assessed (Table 2). Approximately 1 MJ more was ingested over the day when morning intake was above the mean for other breakfast foods, dairy foods, other meats, eggs, other vegetables and sugar. Approximately 0·5 MJ more was ingested over the day when morning intake was above the mean for soda, pastry, fruit juice, nuts and bread. On the other hand, there were no significant differences between below and above the mean days for fruit, candy, breakfast cereal, water, diet soda and milk, while above the mean days of coffee/tea intake was significantly associated with lower total intake over the day. These results are extremely similar to the multiple regression results. In fact the correlation between the food and beverage types' β coefficients and the difference between below and above the mean days was 0·92 (P < 0·05).
Afternoon food and beverage type intake and total daily intake
For afternoon intake in descending order of β coefficient magnitude (Table 3), ingestion of ice cream, alcohol, pastry, potatoes, chips and snacks, beans, nuts, beef, other meats, dairy foods, poultry, condiments, rice, sugar, milk, fish, fruit juice and soda have significant positive β coefficients and were associated with greater total daily intake. On the other hand, fruit, candy, soup, pasta, pizza, other vegetables, bread, breakfast cereal, other breakfast foods, eggs and diet soda did not have significant β coefficients, while coffee/tea and water had significant inverse associations with overall intake.
Afternoon food and beverage type intake was also investigated with a below and above the mean intake analysis (Table 3). Individuals' total daily intakes on days when they ate relatively less of the food and beverage type during the afternoon were compared with the days when the same individuals ate relatively more. The differences between the total daily energy intakes on days when the proportionate afternoon intake of the individual food and beverage types were below or above the mean levels were assessed (Table 3). Approximately 1 MJ more was ingested over the day when afternoon intake was above the mean for ice cream, alcohol and pastry. Approximately a half mega joule more was ingested over the day when afternoon intake was above the mean for most other food and beverage types. On the other hand, there were no significant differences between below and above the mean days for fruit, soup, fish, pasta, pizza, breakfast cereal, eggs, diet soda and coffee/tea, while above the mean days of water intake was significantly associated with lower total intake over the day. These results are extremely similar to the multiple regression results. In fact the correlation between the food and beverage types' β coefficients and the difference between below and above the mean days was 0·96 (P < 0·05).
Evening food and beverage type intake and total daily intake
For evening intake in descending order of β coefficient magnitude (Table 4), ingestion of alcohol, pastry, ice cream, potatoes, chips and snacks, candy, nuts, beef, dairy foods, other meats, condiments, soda and potatoes have significant positive β coefficients and were associated with greater total daily intake. On the other hand, fruit, fish, poultry, pasta, pizza, rice, legumes, other vegetables, bread, breakfast cereal, eggs, sugar, milk, coffee/tea and fruit juice did not have significant β coefficients, while soup, diet soda and water have significant negative associations with overall intake.
Evening food and beverage type intake was also investigated with a below and above the mean intake analysis. Individuals' total daily intakes on days when they ate relatively less of the food and beverage type during the evening were compared with the days when the same individuals ate relatively more. The differences between the total daily energy intakes on days when the proportions of evening intake of the individual food and beverage types were below or above the mean levels were assessed (Table 4). Approximately 1 MJ more was ingested on days when evening intake was above the mean for alcohol, pastry, chips and snacks, nuts, ice cream, dairy foods and beef. Approximately 0·5 MJ more was ingested when evening intake was above the mean for most other food and beverage types. On the other hand, there were no significant differences between below and above the mean days for fruit, poultry, pasta, pizza, rice, breakfast cereal, water, diet soda, milk and coffee/tea, while above the mean days of soup intake was significantly associated with lower total daily intake. These results are extremely similar to the multiple regression results with the correlation between the food and beverage types' β coefficients and the difference between below and above the mean days was 0·97 (P < 0·05).
Dietary energy density, food and beverage type and total daily intake
The associations of food and beverage types with overall intake may, to some extent, be associated with their dietary energy density. To investigate this, multiple regressions were performed to predict the total daily food energy intake on the basis of the dietary energy density of intake during each period and the proportion of the total gram intake ingested of the food and beverage types (Table 5). For the morning, afternoon and evening periods, the β coefficients for dietary energy density were in general strong, positive and significant. This indicates that higher levels of dietary energy density are associated with higher levels of energy intake regardless of the time of day. The β coefficients for the food and beverage types were primarily non-significant. The few significant β coefficients were all substantially smaller than the β coefficients for the same types when they were paired with proportionate energy intake (Tables 2–4) with the exception of alcohol. These results indicate that the influences of the food and beverage types on overall daily intake may, in large part, be mediated by their contributions to the overall dietary energy density of the intake during the morning, afternoon or evening.
Table 5 Overall daily energy intake on the basis of the dietary energy density and the percentage of the total gram intake of each of the food and beverage item types occurring during the morning, afternoon and evening periods
(Mean β coefficients with their standard errors)
* β Coefficients are significantly different from zero as assessed with a t test (P < 0·05).
Discussion
There is evidence that the 7 d diet–diary methodology employed in the present analysis is reasonably reliable and valid(Reference Adleson34–Reference St. Jeor, Guthrie and Jones38) (see de Castro(Reference de Castro30, Reference de Castro31) for review). It appears, however, to consistently underestimate actual intake(Reference Bandini, Schoeller and Cyr39–Reference Livingstone, Prentice and Strain42). So, in the present analysis, not only were the absolute values analysed but also the proportions of intake. These proportions are magnitude independent and thus recording errors are unlikely to be responsible for the observed relations. In addition, underestimation may differ systematically between subjects such that certain participants (e.g. overweight) might tend to underestimate more than others. However, the results were significant for within-subject analyses of the proportions, which correct for the overall and individual underestimated level of intake. Thus, underestimation of intake could not account for the present results. Obviously, there are unsystematic errors of measurement. But, the fact that significant relations were found with a technique that includes considerable error suggests that the effects reported may actually be underestimated and that the influence of the time of day of the intakes of various foods and beverages are, in fact, considerably stronger.
In previous studies(Reference de Castro4, Reference de Castro5) it was demonstrated that the larger the proportion of total food energy intake ingested in the morning the smaller the overall intake, while the larger the proportion of total intake ingested in the late evening the larger the total intake. These results suggested that intake during the morning is associated with lower intake during the remainder of the day, while intake late at night is associated with higher levels of overall daily intakes. The present study supports this basic phenomenon and extends these results. It indicates that the types of foods and beverages ingested during these periods can also make a difference in the total intakes over the entire day. The multiple regressions suggest that the foods and beverages have influences beyond their simple contributions to energy intake.
Interestingly, fruit, soup, breakfast cereal, pasta, pizza, water, coffee/tea and diet soda had either negative or non-significant β coefficients for all periods. Previously, it was shown that, fruit, soup, water, coffee/tea and diet soda ingestion does not appear to add to overall daily intake or evening intake as was the case for most other food types(Reference de Castro21, Reference de Castro22). The inverse association or lack of association of these item types with overall intake indicated that they were not associated with greater intake beyond their contribution to overall energy intake. Hence, ingestion of these foods and beverages would be recommended for intake control. Indeed, the consumption of breakfast cereal has been repeatedly shown to be associated with lower fat intake and BMI(Reference Albertson, Anderson and Crockett8, Reference Gibson and O'Sullivan9, Reference Barton, Eldridge and Thompson43, Reference Bazzano, Song and Bubes44). In addition, since morning intake of food energy was associated with lower overall intake and breakfast cereal and fruit contributed to this morning energy intake and do not have an association by themselves with overall intake, it suggests that these foods and the non-nutritive beverages are excellent for morning intake and overall intake control. Indeed, Mattes(Reference Mattes45) found that when cereal with fruit was used as a replacement meal in a dietary program, there was a decrease in overall intake and a greater reduction in body weight. Also substituting cereal for an evening snack significantly aided in weigh loss(Reference Waller, Vander Wal and Klurfeld46).
On the other hand, there were a number of foods and beverages that appeared to be associated with heightened overall daily intake no matter when they were ingested. Dairy foods, ice cream, beef, other meats, potatoes, pastry, nuts, chips and snacks, condiments, alcohol and soda, in addition to their contributions to the overall energy intake during a period, were significantly associated with higher total intake over the day. Similarly, it was previously shown that, cheese, ice cream, beef, potatoes, alcohol and soda ingestion appeared to add to overall daily intake or evening intake and did not displace the intake of other foods(Reference de Castro21, Reference de Castro22). The results suggest that, in any attempt to restrict intake, these food and beverage types should be avoided. It is interesting to note that most of these food types appear to be high-dietary energy density foods.
The idea that the associations of food types with overall intake may to some extent be associated with the dietary energy density of the type is supported by the findings with the non-nutritive beverages. The non-nutritive beverages investigated in the present study of water, diet soda and coffee/tea were found to be either not significantly associated or negatively associated with overall daily intake no matter when they were ingested. These results are similar to previous findings(Reference de Castro21, Reference de Castro22). Since these beverages contribute to the total bulk and weight of intake, but do not contribute food energy, their ingestion lowers the overall dietary energy density of a meal. It has been clearly demonstrated that the higher the dietary energy density of intake, the higher the overall energy intake(Reference de Castro24, Reference Bell and Rolls47–Reference Yao and Roberts55). Hence, many of the results reported here for individual food and beverage types may well be mediated by their contributions to dietary energy density.
When dietary energy density was paired with the food and beverage types in the multiple regressions, the food and beverage type β coefficients that were significant when paired with proportionate energy intake became either non-significant or markedly reduced. When pairing a variable with another results in a marked reduction in its association with a dependent variable, it strongly suggests that the original association of the variable resulted from mediation(Reference Judd and Kenny56). This clearly suggests that the associations of the food and beverage types with overall daily intake results from their contributions to the dietary energy density of overall intake. Foods that tend to increase dietary energy density result in heightened intake beyond their simple contribution to energy intake, while foods and beverages that are low in energy density either do not or inversely contribute to overall energy intake.
The study has a number of shortcomings. It is well documented that actual intakes are systematically under-reported in dietary diaries. Although, the analyses presented here should be relatively immune to contamination by under-reporting, it is still possible that there exists a complex, non-linear, relationship between under-reporting and time of day or item types, which conceivably could in some way bias the results. Regardless, the fact of under-reporting, at the very least, reduces the external validity of the results. Another issue is selective reporting, where participants have a tendency to include items perceived as healthful and neglect items perceived as forbidden. This selective reporting could have resulted in relative over-reporting of some items and under-reporting of others. In addition, the sample employed consists of a composite of multiple convenience samples that may not be representative of the population.
We are presently in the midst of an epidemic of obesity(Reference Flegal57, Reference Mokdad, Serdula and Dietz58). This epidemic has developed in parallel with a modern trend for children and adolescents to eat very little in the morning and shift the preponderance of their intake till much later in the day(Reference Nicklas, Morales and Linares59–Reference Singleton and Rhoads61) and for adults to be less likely to eat breakfast(Reference Haines, Guilkey and Popkin62). Based upon the present results, it can be speculated that the increase in the rates of obesity may be in part the result of the shift in the time of day of intake. Indeed, overweight and obesity were associated with skipping breakfast(Reference Boutelle, Neumark-Sztainer and Story10, Reference Ma, Bertone and Stanek11, Reference Affenito, Thompson and Barton15, Reference Rampersaud, Pereira and Girard16, 63) and eating late in the day(Reference Forslund, Lindroos and Sjöström13). In addition, only 4 % of the people who have been successful in losing a substantial amount of weight and keeping it off for a prolonged period of time are breakfast skippers(Reference Wyatt, Grunwald and Mosca64). This hypothesis suggests that an effective strategy to prevent or treat obesity might be to encourage an intake pattern where relatively large amounts of low-density foods are eaten in the morning and intake of high-density foods during the evening are avoided.
Acknowledgements
Conflicts of interest: There are no conflicts of interest.
Sources of funding: The analysis of the data was supported by a grant from the General Mills Corporation. The data collection was supported in part by grant R01-DK39881 from the National Institute of Diabetes and Digestive and Kidney Diseases.


