


Vitamin D deficiency is a recognised public health problem worldwide. However, the lack of international consensus on the definition of vitamin D deficiency and differences in the method used to measure serum 25-hydroxyvitamin D (25(OH)D) concentrations hamper comparisons across countries. Various population-based studies in the USA, New Zealand and Canada have estimated that 30–48 % of adults are vitamin D deficient (defined as circulating 25(OH)D concentrations <50 nmol/l)( Reference Liu, Baylin and Levy 1 – Reference Sarafin, Durazo-Arvizu and Tian 3 ). In Europe, vitamin D deficiency (defined as 25(OH)D <30 nmol/l) ranges from 9 to 24 % in adults and from 1 to 8 % in older adults aged >61 years( Reference Sarafin, Durazo-Arvizu and Tian 3 , Reference Cashman, Dowling and Škrabáková 4 ). Dietary intakes of vitamin D are generally low worldwide( Reference Black, Walton and Flynn 5 – Reference Bailey, Dodd and Goldman 7 ); indeed, the UK’s Scientific Advisory Committee on Nutrition is now recommending a daily supplement containing 10 µg of vitamin D in autumn and winter in order to maintain a satisfactory vitamin D status throughout the year( 8 ).
In a nationally representative sample of adults aged ≥25 years (n 11 218) participating in the 1999–2000 Australian Diabetes, Obesity and Lifestyle (AusDiab) study, 31 % were vitamin D deficient (25(OH)D <50 nmol/l). However, serum 25(OH)D concentrations were measured using a direct competitive chemiluminescent immunoassay (CLIA; DiaSorin Inc.)( Reference Daly, Gagnon and ZX 9 ). Other studies evaluating the same immunoassay have noted a negative bias compared with a liquid chromatography-tandem MS (LC–MS/MS) method that is certified to the reference measurement procedures (RMP) developed by the National Institute of Standards and Technology, Ghent University and the US Centers for Disease Control and Prevention (referred to hereafter as the RMP)( Reference Sempos, Vesper and Phinney 10 , Reference Mineva, Schleicher and Chaudhary-Webb 11 ). An LC–MS/MS method certified to the RMP is widely considered the gold standard method for measuring serum 25(OH)D concentrations( Reference Lai, Lucas and Banks 12 , Reference Black, Anderson and Clarke 13 ). The negative bias occurs particularly at 25(OH)D concentrations above 50 nmol/l, with values recorded up to 25 nmol/l below the true value( Reference Binkley, Krueger and Morgan 14 , Reference Lucas and Neale 15 ). This bias can result in misclassification of vitamin D deficiency, with more samples classified as deficient than if analysed using a method certified to the RMP. Use of a CLIA for serum 25(OH)D concentrations has been shown to result in up to one third of Australian adults being incorrectly classified as vitamin D deficient in comparison with an LC–MS/MS method certified to the RMP( Reference Lai, Lucas and Banks 12 ).
Previous studies in the Australian population are now more than a decade old and/or have not used an assay certified to the RMP to measure serum 25(OH)D concentrations. The 2011–2013 Australian Health Survey (AHS) is the first large, nationally representative survey in Australia to quantify serum 25(OH)D concentrations using an LC–MS/MS method certified to the RMP( 16 ). Using data from the AHS, we investigated the prevalence of vitamin D deficiency and identified its predictors in Australian adults. We limited the analysis to adults aged ≥25 years in order to compare the predictors of vitamin D deficiency from the AHS with those from the 1999–2000 AusDiab study.
Methods
Study design and population
The 2011–2013 AHS comprises the National Health Survey (NHS), the National Nutrition and Physical Activity Survey (NNPAS) and the National Health Measures Survey (NHMS). Detailed methodology of the AHS can be found elsewhere( 17 ). The AHS is based on a stratified, multistage area sample of private households. All households were assigned analytic weights to account for their sampling probability of being included in the survey. All individuals participating in the AHS provided core information (e.g. general household and demographic data, self-reported health, smoking status and information on selected health conditions); BMI was calculated from measured weight (kg) and height (m) (weight/height2). Participants were then randomly allocated to the NHS (n 20 425) or NNPAS (n 12 153). The NHS collected comprehensive health and medical information, while the NNPAS collected detailed data relating to diet and physical activity. Face-to-face interviews with participants were conducted in urban and rural areas across all states and territories of Australia. Excluded were residents of non-private dwellings, such as hostels or visitors to private dwellings. For those who were aged >11 years and agreed to participate in the NHMS component (n 10 401), qualified phlebotomists collected blood samples for measurement of biomarkers, including serum 25(OH)D concentrations( 18 ).
The present study includes data on adults aged ≥25 years who participated in the NHS, provided a blood sample for measurement of serum 25(OH)D concentrations and had complete data for all potential predictors investigated. A total of 14 248 adults aged ≥25 years participated in the NHS component of the AHS. Of these, 8839 participants did not participate in the NHMS and, hence, did not have data for serum 25(OH)D concentrations. A further 375 participants had missing data for core variables (BMI, education level and exercise), leaving 5034 participants for the present analysis (45 % men, 55 % women).
The study was conducted in accordance with the Declaration of Helsinki. The interview components of the AHS were conducted under the Census and Statistics Act 1905. For the NHMS component, the Australian Government Department of Health and Ageing’s Departmental Ethics Committee provided ethics approval in February 2011 and written informed consent was obtained from participants.
Serum 25-hydroxyvitamin D concentrations
The AHS is one of eight participating national surveys in the Vitamin D Standardization Program (VDSP) which aims to standardise measurements of serum 25(OH)D concentrations in health surveys internationally( Reference Sempos, Vesper and Phinney 10 ). Blood samples (fasting was not required) were stored at –80°C before analysis using an LC–MS/MS method that is certified to the RMP (Douglass Hanly Moir Pathology). Total vitamin D deficiency was defined as serum 25(OH)D concentrations <50 nmol/l, insufficiency as 25(OH)D 50 to <75 nmol/l and sufficiency as 25(OH)D ≥75 nmol/l( Reference Holick, Binkley and Bischoff-Ferrari 19 ).
Potential predictors of vitamin D deficiency
We categorised age as 25–34, 35–44, 45–54, 55–64, 65–74 or ≥75 years. Region of birth was described as ‘Australia’, ‘Main English-speaking countries’ (USA, Canada, UK, Republic of Ireland, New Zealand and South Africa) or ‘other’. State/territory recruitment sites were New South Wales (32°S), Victoria (37°S), Queensland (21°S), South Australia (30°S), Western Australia (26°S), Tasmania (42°S), Northern Territory (19°S) and Australian Capital Territory (35°S). The Australian Bureau of Statistics (ABS) categorised region of residence according to the Accessibility/Remoteness Index of Australia, which is mapped to the census collection districts (CD) from the Census of Population and Housing. Only urban and rural areas were included in the AHS; however, the exclusion of remote and very remote areas had minimal impact on the national estimates. Area remoteness was classified based on the CD of participant’s residence: CD with index values ranging from 0 to 0·20 were considered as ‘major cities of Australia’, while CD with index values from 0·21 to 2·40 and from 2·41 to 5·92 were classified as ‘inner regional Australia’ and ‘other’, respectively.
The 2011 Index of Relative Socioeconomic Disadvantage (IRSD) was used to describe the socio-economic status. The IRSD is a general socio-economic index that summarises information relating to the social and economic resources of people and households within an area, with scores ranging from low to high. A low score indicates relatively greater overall disadvantage. Scores were categorised into quintiles. Educational attainment was described as ‘High/primary/no school’ (high school or less), ‘Certificate/diploma’ (technical and further education) or ‘University’. Smoking status was defined as ‘current smoker’ or ‘ex-/non-smoker’. BMI was categorised as underweight (<18·5 kg/m2), healthy weight (18·5–24·9 kg/m2), overweight (25·0–29·9 kg/m2) or obese (≥30·0 kg/m2)( 20 ). Due to small numbers of underweight participants, we grouped underweight and healthy weight together. Month of blood collection was categorised by season: ‘spring (September–November)’, ‘summer (December–February)’, ‘autumn (March–May)’ or ‘winter (June–August)’.
The ABS classified physical activity as ‘low/sedentary’, ‘moderate’ or ‘high’ based on the level of physical activity performed for fitness, sport or recreation and walking for transport in the past week( 17 ). The data items, namely, total minutes undertaken for moderate physical activity, total minutes undertaken for vigorous physical activity, total minutes walked for fitness, recreation or sport and total minutes spent walking for transport, contributed to each category. Each physical activity category was given an intensity factor score: walking for fitness or transport=3·5, moderate exercise/physical activity=5·0 and vigorous exercise/physical activity=7·5, which was subsequently multiplied by the physical activity duration.
Information on vitamin D and/or Ca supplement use in the last 2 weeks was collected by interview. For the purposes of this study, participants who reported using a single vitamin D or Ca supplement were considered vitamin D and/or Ca supplement users. We included Ca supplements because the majority of Ca supplements in Australia contain vitamin D.
Statistical analyses
Survey-weighted characteristics of participants, stratified by sex, were summarised using numbers and proportions. We reported prevalence of total vitamin D deficiency (25(OH)D <50 nmol/l), insufficiency (25(OH)D 50 to <75 nmol/l) and sufficiency (25(OH)D ≥75 nmol/l), stratified by sex and age group. We also reported mean serum 25(OH)D concentrations by sex and month of blood collection. All were weighted to the Australian population in 2011–2013( 18 ).
Survey-weighted logistic regression models were used to determine the independent predictors of vitamin D deficiency (25(OH)D <50 nmol/l) in men and women. We stratified by sex in order to compare predictors with the AusDiab study findings. All variables were entered into the same regression models to provide adjusted OR. The model accounted for the stratification and clustering of the complex sample design using the Taylor series linearisation method( 17 ). All households were weighted using analytic weights provided by the AHS survey. All analyses were conducted using SAS version 9.4 (SAS Institute).
Results
Most (70 %) participants were born in Australia, with the majority (approximately 70 %) residing in New South Wales, Victoria and Queensland, and living in major cities (67 %) (Table 1). About 70 % of men and 60 % of women were either overweight or obese, with correspondingly low levels of physical activity (56 % of men, 61 % of women). About 13 % of men and women were current smokers. Three times as many women (16 %) as men (5 %) used vitamin D and/or Ca supplements (Table 1).
Table 1 Descriptive characteristics of Australian adults aged ≥25 years (n 5034) included in the present study (Percentages and 95 % confidence intervals)
CD, collection districts.
* Percentages and 95 % CI weighted to the Australian population in 2011–2013.
† Main English-speaking countries: USA, Canada, UK, Republic of Ireland, New Zealand and South Africa.
‡ Categorised according to the Accessibility/Remoteness Index of Australia, which is mapped to the census CD from the Census of Population and Housing (major cities: CD with index values 0–0·20; inner regional: 0·21–2·40; other: 2·41–5·92).
§ Healthy weight (18·5–24·9 kg/m2; this group includes a small number of underweight participants <18·5 kg/m2), overweight (25·0–29·9 kg/m2) and obese (≥30·0 kg/m2).
|| Based on the level of physical activity performed for fitness, sport or recreation and walking for transport in the past week.
¶ Based on 2011 Index of Relative Socioeconomic Disadvantage.
In total, 20 % of participants (19 % men, 21 % women) were classified as vitamin D deficient, with a further 43 % classified as insufficient (45 % men, 42 % women) (Tables 2 and 3). The highest prevalence of vitamin D deficiency (32 % men, 26 % women) was in the youngest age group (25–34 years) (Table 2). The prevalence of deficiency decreased with increasing age in men, and to a lesser extent in women, until the age of 65 years, after which there was a plateau in men and an increase in women (Table 3 and Fig. 1). Similar findings were observed for the prevalence of vitamin D insufficiency. The highest prevalence of severe deficiency (25(OH)D <30 nmol/l) was in those born in a country other than Australia or the main English-speaking countries (13 % for men and 11 % for women) (Table 3). The mean serum 25(OH)D concentrations were lower in winter–spring (August–October) than in summer–autumn (February–March), at 55–60 and 70–75 nmol/l, respectively (Fig. 2).
Table 2 Survey-weighted prevalence of serum 25-hydroxyvitamin D concentrations <30, <50 and <75 nmol/l in Australian adults aged ≥25 years (n 5034) included in the present study (Percentages and 95 % confidence intervals)
CD, collection districts.
* Percentages weighted to the Australian population in 2011–2013.
† Main English-speaking countries: USA, Canada, UK, Republic of Ireland, New Zealand and South Africa.
‡ Categorised according to the Accessibility/Remoteness Index of Australia, which is mapped to the census CD from the Census of Population and Housing (major cities: CD with index values 0–0·20; inner regional: 0·21–2·40; other: 2·41–5·92).
§ Healthy weight (18·5–24·9 kg/m2; this group includes a small number of underweight participants <18·5 kg/m2), overweight (25·0–29·9 kg/m2) and obese (≥30·0 kg/m2).
|| Based on the level of physical activity performed for fitness, sport or recreation and walking for transport in the past week.
¶ Based on 2011 Index of Relative Socioeconomic Disadvantage.
Table 3 Survey-weighted prevalence of serum 25-hydroxyvitamin D concentrations <30, <50 and <75 nmol/l in Australian adults aged ≥25 years included in the present study, stratified by sex (men, n 2267; women, n 2767) (Percentages and 95 % confidence intervals)
CD, collection districts.
* Percentages weighted to the Australian population in 2011–2013.
† Main English-speaking countries: USA, Canada, UK, Republic of Ireland, New Zealand and South Africa.
‡ Categorised according to the Accessibility/Remoteness Index of Australia, which is mapped to the census CD from the Census of Population and Housing (major cities: CD with index values 0–0·20; inner regional: 0·21–2·40; other: 2·41–5·92).
§ Healthy weight (18·5–24·9 kg/m2; this group includes a small number of underweight participants <18·5 kg/m2), overweight (25·0–29·9 kg/m2) and obese (≥30·0 kg/m2).
|| Based on the level of physical activity performed for fitness, sport or recreation and walking for transport in the past week.
¶ Based on 2011 Index of Relative Socioeconomic Disadvantage.
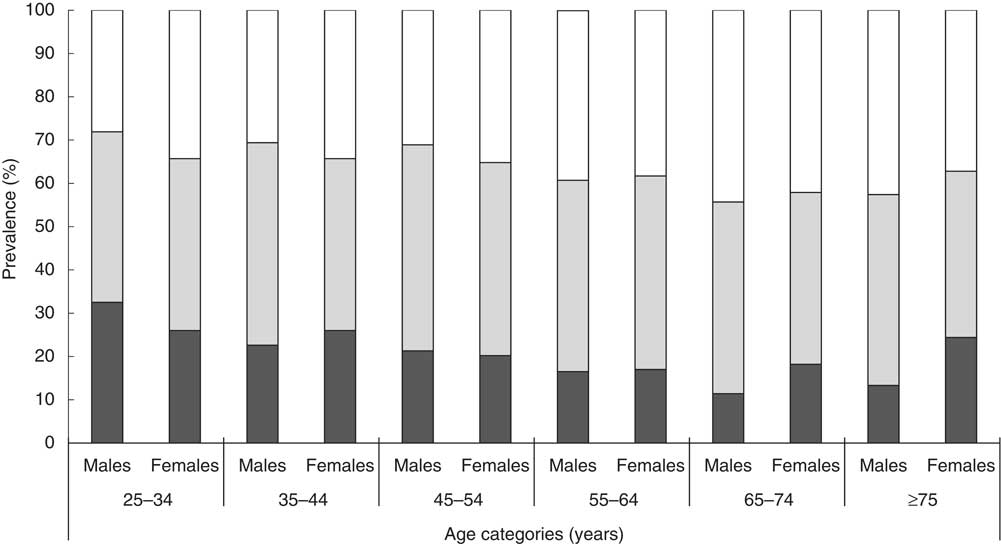
Fig. 1 Prevalence of vitamin D deficiency (serum 25-hydroxyvitamin D concentrations <50 nmol/l (
![]() )), insufficiency (50 to <75 nmol/l,
)), insufficiency (50 to <75 nmol/l,
![]() ) and sufficiency (≥75 nmol/l,
) and sufficiency (≥75 nmol/l,
![]() ) by age group in (a) men (n 2267) and (b) women (n 2767) who participated in the 2011–2013 National Health Survey and National Health Measures Survey (weighted to the Australian population in 2011–2013).
) by age group in (a) men (n 2267) and (b) women (n 2767) who participated in the 2011–2013 National Health Survey and National Health Measures Survey (weighted to the Australian population in 2011–2013).
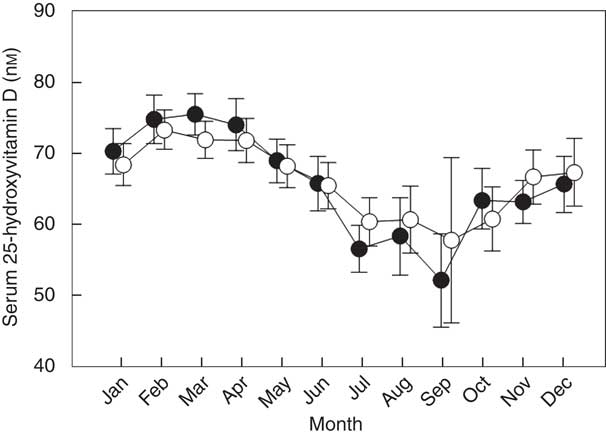
Fig. 2 Mean adjusted serum 25-hydroxyvitamin D concentrations (with 95 % CI) in men and women aged ≥25 years who participated in the 2011–2013 National Health Survey and National Health Measures Survey (n 2267 men, 2767 women), by month of the year (spring (September–November), summer (December–February), autumn (March–May), winter (June–August)). Mean adjusted for age group, region of birth, state/territory, remoteness area, BMI, smoking, education, physical activity, socio-economic status, vitamin D and/or calcium supplement use.
Adjusted logistic regression models identified several factors significantly associated with increased odds of vitamin D deficiency (Table 4). In men only, older age was significantly associated with lower risk of vitamin D deficiency: those aged 55 years and over had approximately half the odds of vitamin D deficiency compared with 25- to 34-year-olds. Participants born in a country other than Australia and the main English-speaking countries were more than three times more likely to be vitamin D deficient than those born in Australia. As expected, those residing in southern (higher latitude) states, such as Tasmania and to a lesser extent Victoria, were more likely to be vitamin D deficient than those residing in New South Wales. Those residing in Queensland and Western Australia were less likely to be vitamin D deficient than those residing in New South Wales. Seasonal differences in vitamin D deficiency were also observed, with participants sampled in winter or spring having approximately three times the odds of vitamin D deficiency compared with those sampled in summer. Other factors associated with increased odds of vitamin D deficiency included being obese compared with having a healthy BMI; being a current smoker compared with being an ex-/non-smoker (women only); having a university education compared with high/primary/no school; having low or sedentary physical activity compared with high physical activity. Living in inner regional or ‘other’ areas (compared with living in major cities) was associated with a lower risk of vitamin D deficiency, as was use of vitamin D or Ca supplements. Socio-economic status (as measured by the area-level IRSD) was not associated with vitamin D deficiency.
Table 4 Unadjusted and adjusted survey-weighted logistic regression models investigating predictors of vitamin D deficiency (serum 25-hydroxyvitamin D concentrations <50 nmol/l) in Australian adults aged ≥25 years included in the present study, stratified by sex (men, n 2267; women, n 2767) (Odds ratios and 95 % confidence intervals)
Ref., reference; CD, collection districts.
* Adjusted for all other variables.
† Main English-speaking countries: USA, Canada, UK, Republic of Ireland, New Zealand and South Africa.
‡ Categorised according to the Accessibility/Remoteness Index of Australia, which is mapped to the census CD from the Census of Population and Housing (major cities: CD with index values 0–0·20; inner regional: 0·21–2·40; other: 2·41–5·92).
§ Healthy weight (18·5–24·9 kg/m2; this group includes a small number of underweight participants <18·5 kg/m2), overweight (25·0–29·9 kg/m2) and obese (≥30·0 kg/m2).
|| Based on the level of physical activity performed for fitness, sport or recreation and walking for transport in the past week.
¶ Based on 2011 Index of Relative Socioeconomic Disadvantage.
Discussion
We found that 20 % of adults aged ≥25 years who participated in the 2011–2013 AHS were vitamin D deficient (25(OH)D <50 nmol/l) (5 % of adults had concentrations <30 nmol/l), with a further 43 % vitamin D insufficient (25(OH)D 50 to <75 nmol/l). By comparing our AHS-based prevalence data with census population data( 21 ), we estimated that, in 2011, approximately 9·83, 3·29 and 0·81 million Australian adults aged ≥25 years had serum 25(OH)D concentrations <75, <50 and <30 nmol/l, respectively.
Approximately 30 % of adults aged ≥25 years who participated in the nationally representative 1999–2000 AusDiab study were vitamin D deficient; however, it is not possible to assess a trend in vitamin D deficiency over time, since the AHS used an LC–MS/MS method certified to the RMP to quantify 25(OH)D concentrations, while the AusDiab study used a DiaSorin CLIA. Another difference between the AusDiab study and the AHS was the sampling time frame, that is, the AusDiab study sampled specific regions in specific months, while the AHS sampled throughout the year.
This difficulty in comparing the prevalence of vitamin D deficiency over time due to a change in analytical methodology also arose in the USA, where the earlier National Health and Nutrition Examination Survey (NHANES) surveys (up to and including the 2000–2006 survey) used an immunoassay, but subsequent NHANES surveys used an LC–MS/MS method that was certified to the RMP( 22 ). An initial comparison indicated a decrease in mean serum 25(OH)D concentrations between the 1988–1994 NHANES and 2000–2006 NHANES( Reference Looker, Pfeiffer and Lacher 23 ). However, the results from the two surveys were later harmonised using the VDSP protocol, a mathematical model to calibrate non-standardised assay results to allow comparison with results of standardised assays( Reference Sempos, Vesper and Phinney 10 ). The harmonised results indicated there was no change in the prevalence of vitamin D deficiency in the USA between 1988–1994 and 2000–2006( Reference Schleicher, Sternberg and Lacher 24 ). Serum 25(OH)D data from NHANES 2001–2010 (measured by a LC–MS/MS method certified to the RMP) showed that 30 % of adults were vitamin D deficient (25(OH)D <50 nmol/l) and 41 % were insufficient (50 to <75 nmol/l)( Reference Liu, Baylin and Levy 1 ). Similar harmonisation procedures have been applied to data from several European studies with varying effects on the estimates of the prevalence of vitamin D deficiency.( Reference Cashman, Dowling and Škrabáková 4 ) In the Irish National Adult Nutrition Survey, the estimated prevalence of serum 25(OH)D <30 nmol/l was 6·5 %. After harmonisation, the ‘true’ prevalence of deficiency was estimated as 11·4 %( Reference Cashman, Kiely and Kinsella 25 ). In contrast, in the German Health Interview and Examination Survey for Adults, harmonisation decreased the prevalence estimate from 28·0 to 12·9 %( Reference Cashman, Dowling and Škrabáková 4 ).
Most predictors of vitamin D deficiency were similar between the AusDiab study and the AHS, including low physical activity, obesity, residing in the southern part of Australia (at higher latitudes), and blood collection during winter or spring. We were not able to compare country of origin/race between the AusDiab study and the AHS due to differences in categorisation between the two studies. The AusDiab study reported higher vitamin D deficiency in people of non-European origin, while we found a higher prevalence of vitamin D deficiency in those born in a country other than Australia or the main English-speaking countries.
Likely reasons for the higher prevalence of vitamin D deficiency for those born outside Australia and other main English-speaking countries include clothing habits, which reduce sunlight exposure of the skin, and/or darker skin colour, which indicates a higher melanin concentration. Since melanin is a natural sun protector, non-Caucasians require a longer duration of sunlight exposure than their fair-skinned counterparts to synthesise the same amount of vitamin D( Reference Holick 26 ). Low physical activity may be associated with a decreased amount of time spent outdoors, resulting in decreased cutaneous synthesis of vitamin D. Physical inactivity is also a risk factor for overweight/obesity, and there is an inverse association between body fat and serum 25(OH)D concentrations that may be related to the volumetric dilution of vitamin D in fat mass( Reference Drincic, Armas and Van Diest 27 ).
Season and latitude affect cutaneous synthesis of vitamin D: in winter the Earth is further from the sun resulting in lower UV intensity; at higher latitudes, the sun is lower in the sky and UV radiation traverses a longer path through the atmosphere, resulting in greater absorption of UV-B radiation by stratospheric ozone( Reference Holick 28 ). In addition, cloud cover impacts surface UV-B levels: vitamin D synthesis is reduced in cloudy conditions compared with clear sky( Reference Kimlin 29 ), which may partially explain differences in the prevalence of vitamin D deficiency between states/territories. In our study, Victoria (the southern-most state of the Australian mainland) had the highest prevalence of vitamin D deficiency. Victoria was also reported as having the highest incidence (13/100 000 per year) of rickets in children aged ≤15 years by the Australian Paediatric Surveillance Unit Study( Reference Munns, Simm and Rodda 30 ). Conversely, the second highest incidence of rickets was seen in Western Australia( Reference Munns, Simm and Rodda 30 ), which ranks sixth of the eight states and territories in terms of prevalence of vitamin D deficiency. Although the prevalence of vitamin D deficiency was high across the more southerly states (Victoria, Tasmania, South Australia), the prevalence of vitamin D deficiency was also high in the Northern Territory, which had the highest prevalence of severe vitamin D deficiency. There is a higher proportion of Aboriginal and Torres Strait Islander people in the Northern Territory compared to other states( 31 ) and, withstanding Darwin city, which the Accessibility and Remoteness Index Australia 2006 classified as outer regional, the remainder of the territory is classified as remote or very remote( 32 ). The Australian Aboriginal and Torres Strait Islander Health Survey 2012–2013 found that the prevalence of vitamin D deficiency in people living in remote areas was nearly 40 %, compared with 23 % in non-remote areas( 33 ).
There were differences between the AusDiab study and the AHS with respect to age and sex as predictors of vitamin D deficiency. Results from the AusDiab study showed that vitamin D deficiency was most prevalent in older age groups and women, while our study showed that vitamin D deficiency was highest in the youngest age group (25–34 year olds), with no sex differences. These changes may partly be due to an increasing use of vitamin D supplements, particularly in older women. Although the prevalence of single vitamin D supplement use in Australia is generally low, it is higher in older adults than in younger adults and higher in women than men( Reference Black, Jacoby and Nowson 34 ). Increasing use of vitamin D supplements over the last 20 years has been shown in the USA from serial NHANES data( Reference Kantor, Rehm and Du 35 ). In addition, a Western Australian Study of 2076 adults aged 18–45 years found that while men were more likely to wear a hat and protective clothing when outdoors, women were more likely to use sunscreen and spend more time in indoor or shaded areas( Reference Koch, Pettigrew and Minto 36 ), behaviours which may lead to men and women receiving similar amounts of vitamin D from sunlight.
Strengths of our study include the use of a nationally representative sample of the Australian adult population (aged ≥25 years), and the use of an LC–MS/MS method certified to the RMP for measuring serum 25(OH)D concentrations. Due to the comprehensive data available from the AHS, we were also able to investigate a number of potential predictors of vitamin D deficiency. However, we were not able to consider the effects of diet or sun exposure, a limitation common to many population-based studies of vitamin D deficiency( Reference Daly, Gagnon and ZX 9 ). Due to the differences in assay methodology, we were unable to compare the absolute prevalence of vitamin D deficiency with previous estimates from the AusDiab study. However, while the absolute prevalence may not be comparable due to expected analytical method bias, that bias is not expected to interact with the various predictors; exposure–outcome relationships have been shown to be conserved, despite bias in the prevalence of the outcome( Reference Mealing, Banks and Jorm 37 ). Hence, we compared predictors of vitamin D deficiency from the AHS with those from the AusDiab study. A limitation of this comparison is that not all variables were categorised the same way in the two studies. For example, physical activity was derived differently, and some categories were not comparable (e.g. race/ethnicity in the AusDiab study v. region of birth in the AHS; location of residence (urban/rural) in the AusDiab study v. remoteness area in the AHS). Furthermore, some variables were not collected in both studies (e.g. television viewing time was collected in the AusDiab study but not in the AHS; supplement use was collected in the AHS but not in the AusDiab study).
Conclusion
The 2011–2013 AHS provides the first estimate of the prevalence of vitamin D deficiency in a nationally representative sample of adults using a gold standard method for measuring serum 25(OH)D concentrations. Among Australian adults aged ≥25 years, the prevalence of deficiency (<50 nmol/l) and insufficiency (50 to <75 nmol/l) was 20 and 43 %, respectively, while the remaining 37 % of the population were vitamin D sufficient (≥75 nmol/l). The predictors of vitamin D deficiency remained largely the same between the 1999–2000 AusDiab study and the 2011–2013 AHS. However, while age continues to be a major risk factor for vitamin D deficiency, the risk has shifted to a younger age group compared with the AusDiab study, with 25- to 34-year-olds now carrying the highest risk of deficiency. Given our increasingly indoor lifestyles, there is a need to develop and promote strategies to maintain adequate vitamin D status through safe sun exposure and dietary approaches.
Acknowledgements
The Australian Health Survey was conducted by the Australian Bureau of Statistics (ABS) with funding provided through the ABS health survey programme, the Department of Health and the National Heart Foundation of Australia. We thank the Australian Health Survey participants for their time and contribution to the survey. We gratefully acknowledge Paul Atyeo and Barry Tynan (ABS) for their advice and assistance in using data from the Australian Health Survey.
R. M. L. is supported by an Australian National Health and Medical Research Council Senior Research Fellowship. L. J. B. is supported by a Multiple Sclerosis Western Australia Research Fellowship and a Curtin University Research Fellowship.
R. M. L. and L. J. B. designed the study; E. M. and P. C. analysed and interpreted the data; E. M., P. C. and E. D. wrote the paper; L. J. B., J. L. S., R. M. L., R. M. D. and C. A. N. provided critical revision of the manuscript for important intellectual content; L. J. B. had primary responsibility for the final content. All the authors read and approved the final version of the manuscript.
The authors declare no conflicts of interest.


