


Acne vulgaris (acne) is an inflammatory and chronic skin disease that primarily affects adolescents and young adults (ICD-10; WHO, 2015). Epidemiological data indicates that the distribution of acne is almost universal, and the incidence in young adults is on the rise (Lynn et al., Reference Lynn, Umari, Dunnick and Dellavalle2016; Tan & Bhate, Reference Tan and Bhate2015). The disease is caused by an obstruction of the hair follicle, involving hyperactivity of the sebaceous glands, alterations of the composition of the skin bacteria, inflammation, and keratosis. It can develop in any area of the body, but lesions are generally present on the face, neck, chest, and upper back (Williams et al., Reference Williams, Dellavalle and Garner2012). The severity of the inflammation ranges from mildly inflamed lesions (comodones) to severely inflamed lesions (pustules, nodules, and papules). In extreme cases the lesions develop into nodulocystic acne. The scarring generated in extreme cases is associated with psychological distress and social inability (Barnes et al., Reference Barnes, Levender, Fleischer and Feldman2012; Dunn et al., Reference Dunn, O'Neill and Feldman2011; Halvorsen et al., Reference Halvorsen, Stern, Dalgard, Thoresen, Bjertness and Lien2011).
Despite the pervasiveness of the disease, little is known about the causes or origin of acne. Factors, such as diet, seasonal changes, hormonal changes, and ethnicity have been suggested as risk factors for the occurrence and severity of acne. However, there are no conclusive findings that show any of these factors as causative of acne (Bataille et al., Reference Bataille, Snieder, Macgregor, Sasieni and Spector2002; Cho et al., Reference Cho, Ha, Park, Kim and Kim2014; Magin et al., Reference Magin, Pond, Smith and Watson2005). Multiple twin studies (Bataille et al., Reference Bataille, Lens and Spector2012; Cho et al., Reference Cho, Ha, Park, Kim and Kim2014; Friedman, 1984; Walton et al., Reference Walton, Wyatt and Cunliffe1988) have reported that genetic factors influence the development of acne, including an earlier analysis of our cohort (Evans et al., Reference Evans, Kirk, Nyholt, Novac and Martin2005). There are also indications that the severity of the disease and time of onset are predisposed by genetic factors (Evans et al., Reference Evans, Kirk, Nyholt, Novac and Martin2005; Goulden et al., Reference Goulden, McGeown and Cunliffe1999). Several genes within the pathways of the cytochromes P450 (CYPs) family have been suggested as candidates in the pathogenesis of acne (Paraskevaidis et al., Reference Paraskevaidis, Drakoulis, Roots, Orfanos and Zouboulis1998). Insulin, insulin receptors (Arora et al., Reference Arora, Yadav and Saini2011; Melnik, Reference Melnik2010), insulin like growth-factor-I (Melnik & Schmitz, Reference Melnik and Schmitz2009; Tasli et al., Reference Tasli, Turgut, Kacar, Ayada, Coban, Akcilar and Ergin2013), and androgen receptors (Sawaya & Shalita, Reference Sawaya and Shalita1998; Yang et al., Reference Yang, Yu, Cheng, Tang, Dong, Xiao and He2009) have also been reported as having an effect on the development of acne. Recently, Lichtenberger et al. (Reference Lichtenberger, Simpson, Smith, Barker and Navarini2017) reviewed 21 studies of candidate genes. A common observation around the reviewed studies was that further analyses are required to corroborate or refute the findings from candidate genes studies, which were often inconclusive due to the small number of individuals in the studies, lack of statistical power, and/or failure to replicate.
While GWAS has proved to be a powerful tool to detect genomic variants influencing complex traits, few GWAS of acne have been conducted. A GWAS study and meta-analysis in a Han Chinese cohort (He et al., Reference He, Wu, Yang, Cheng, Zuo, Lai and Sun2014) reported suggestive association at two loci (1q24.2 and 11p11) located within the regions of DDB2 and SELL, genes that are implicated in the process of androgen metabolism, inflammation, and scarification. A follow-up of this study (Wang et al., Reference Wang, Guo, Shen, He, Zhang, Zuo and Yang2015) confirmed the potential involvement of these loci in the pathogenesis of acne. Another GWAS study in European Americans (Zhang et al., Reference Zhang, Qureshi, Hunter and Han2014) did not detect SNPs with genome-wide association. A SNP at the proximity of the gene MYC (locus 8q24) had the highest association (1.7E-06), but the study lacked statistical power as it had only 81 cases and 847 controls and failed to replicate. A GWAS in a UK cohort (Navarini et al., Reference Navarini, Simpson, Weale, Knight, Carlavan, Reiniche and Barker2014) reported genome-wide association at 1q41, 5q11.2, and 11q13. These loci are within the regions of genes that have functions related to skin homeostasis and are also associated with the TGFβ pathway, a growth factor with a putative role in the pathogenesis of acne. The UK study did not detect association at 8q24 or any of the loci reported for the Han Chinese cohort. Overall, the findings of these studies suggest that acne predisposition may have a complex genetic architecture of small genetic effects.
Here we report a study of heritability of acne for an Australian cohort of adolescent twins, extending a previous analysis by Evans et al. (Reference Evans, Kirk, Nyholt, Novac and Martin2005) on the heritability of acne severity. The phenotype in our study differs from the Evans study as here we consider the highest score of acne among three longitudinal measures; we also include data from siblings, which gives more statistical power to the analysis. We apply twin modeling to re-estimate the heritability of acne using a sample three times larger (1,906 twin pairs plus 671 siblings) than that used by Evans et al. (Reference Evans, Kirk, Nyholt, Novac and Martin2005), and then we conducted a GWAS of these data.
Materials and Methods
Participants
Participants were part of the Brisbane Longitudinal Twin study (BLTS) conducted at the QIMR Berghofer Medical Research Institute. Since 1992, the BLTS study has collected data from twins, their non-twin (singleton) siblings, and their parents. Families were first recruited into this study when the twins were 12-year-old, with additional follow-up data collections at ages 14, 16, 19, and 25. Within the BLTS study, data is collected on a wide range of biological, psychological, and social traits, as well as environmental exposures. Further details of the recruitment process, data collection, and determination of zygosity can be found in Wright and Martin (Reference Wright and Martin2004). All participants in the BLTS gave informed written consent; ethical approval was obtained from the Human Research Ethics Committee.
The present study used longitudinal data on the severity of acne for 3,817 twins and 674 siblings; the twin data includes 752 monozygotic (MZ) complete pairs, 1,154 dizygotic (DZ) complete pairs, and five unpaired individuals; 2,342 (52% of the total sample) were females and 2,149 (48% of the total sample) were males. Totals of pairs by zygosity and acne scores are presented in Table 1.
TABLE 1 Description of the Sample: Distribution of Acne Scores for Each Zygosity Group and Twin Polychoric Correlations of the Liability to Acne Severity

Note: The score for acne severity among twins and siblings corresponds to the highest rating for acne severity by site and location as explained in the methods. The table presents the number of individuals and complete pairs per zygosity group (MZM = Monozygotic males; MZF = monozygotic females; DZM = dizygotic males; DZF = dizygotic females; DZOS = dizygotic opposite-sex). r = polychoric correlations of the liability to acne severity for co-twin in each zygosity group and for twins-sibling. Polychoric correlations were estimated by SEM with full information maximum likelihood estimation and are standardized for sex, age, age2, age × sex, and age2 × sex. CI = 95% confidence interval of the polychoric correlation.
Measures
The severity of acne was rated by a nurse using a 4-point scale (1 = absent; 2 = mild; 3 = moderate; 4 = severe) on back, face, and chest. The measures were taken in a longitudinal manner at ages 12 and 14 years and from the face only at age 16 years. Details of the rating and validation of the scale are given in Evans et al. (Reference Evans, Kirk, Nyholt, Novac and Martin2005). For this analysis we chose the score that corresponds to the most severe across all sites at all ages, to minimize missing data and to allow for individual differences in the time onset of acne, since boys and girls typically develop acne at different ages. Figure 1 presents the age distribution of the most severe acne score among females and males; the mean age of the twins was 14.6 (range 12–23, SD 1.4) and the mean age of the siblings was 14.7 (range 10–23, SD 2.4).

FIGURE 1 Summary of the number of females and males who were scored for acne severity.
Model-Fitting Analysis
We conducted structural equation modeling (SEM) with full information maximum likelihood estimation of parameters, which makes use of all available information. As acne was scored as ordered categories, we fitted a liability-threshold model (Rijsdijk & Sham, Reference Rijsdijk and Sham2002), which assumes that there is an underlying liability toward acne that is normally distributed (with mean zero and variance one). The categories can be considered as a series of thresholds that divide the liability distribution into discrete classes.
We began with a fully saturated model in which thresholds and correlations were allowed to differ by sex, zygosity, and whether it was a twin or a twin or sibling. Age and sex are associated with the onset of acne; so these fixed effects were removed from the thresholds by regressing sex, age, age2, age by sex, and age2 by sex on the thresholds. Thus, this is under the expectation that the beta effects are comparable between zygosity groups and siblings.
The saturated model consisted of 36 parameters. Within same sex pairs we equated thresholds for first- and second-born twins so there were three thresholds for each twin group (MZF, MZM, DZF, DZM, OS-female, OS-male) and three thresholds for each sibling group (male siblings and female siblings), for a total of 24 thresholds, four betas (age, age2, age by sex, and age2 by sex) and eight correlations (MZ-females, MZ-males, DZ-females, DZ-males, DZ-OS pairs, female twins-sibling, male twins-sibling, and OS-twins-sibling). A parameters reduction was conducted by testing the significance of the parameters thorough several nested models; we tested for differences in thresholds within twin pairs, zygosity groups, and twins and siblings.
Model fit was assessed using maximum likelihood-ratio test, which is asymptotically distributed as a chi-squared (χ 2) with degrees of freedom equal to the difference in the number of parameters between models. A non-significant p value (p > .05) indicates that the model with fewer parameters can be retained without a significant loss of fit. We also evaluated Akaike's information criterion (AIC), calculated as Δχ 2–2Δdf (Akaike, Reference Akaike1987), which combines parsimony and explanatory power by penalizing improving fit for the addition of parameters.
Genetic Analysis
As explained elsewhere (Neale & Cardon, Reference Neale and Cardon2013), the classical twin method makes use of the differences in genetic relatedness between MZ and DZ twins to estimate the proportion of variance due to additive genetic (A), unique environmental (E), and common environmental (C) or non-additive genetic (D) effects. If twice the DZ correlation is greater than the MZ correlation (2r DZ > r MZ), this is indicative of shared environmental effects so an ACE model is used. On the other hand when the MZ correlation is larger than twice the DZ correlation (r MZ > 2r DZ) this indicates non-additive genetic effects and an ADE model is used.
For the liability of acne severity r MZ > 2r DZ (Table 1) an ADE model was used, and the sub-models AE and E were fitted to test whether a model with fewer parameters could satisfactorily explain the variance in liability to acne severity.
Data handling and descriptive statistics were performed using SPSS (IBM Corp. Version 22.0. Armonk, NY: IBM Corp). Polychoric correlations and SEM analyses were estimated using the R package OpenMx version 2.6.7 (Boker et al., Reference Boker, Neale, Maes, Wilde, Spiegel, Brick and Fox2011; Boker et al., Reference Boker, Neale, Maes, Wilde, Spiegel, Brick and Kirkpatrick2016).
Genome-Wide and Gene-Based Association Analysis
The individuals in this study were genotyped as part of a larger GWAS study. Briefly, genotyping was performed on HumanCoreExome-12v1-0_C or IlluminaHuman610W-Quad bead chip. Details of the genotyping procedures and quality control are given elsewhere (Medland et al., Reference Medland, Nyholt, Painter, McEvoy, McRae, Zhu and Martin2009). Genotypes were imputed to phase 3 version 5 of the 1000 Genomes Build37 (hg19) (1000 Genomes Project Consortium et al., Reference Auton, Brooks, Durbin, Garrison, Kang, Korbel and Abecasis2015). We performed GWAS using RAREMETALWORKER (Feng et al., Reference Feng, Liu, Zhan, Wing and Abecasis2014) to explicitly correct for relatedness.
We used the summary data from the GWAS to conduct a gene-based association analysis using VEGAS2 (Mishra et al., Reference Mishra, Macgregor, Amos, Wang, Lee, Gershenwald and Wang2015). This analysis aims to determine whether genes harbored an excess of variants with small p values. The test uses the summary statistics from a GWAS analysis to determine the evidence of association at the level of the gene, taking into account the SNP density, gene size and LD between SNPs. These analyses can be more powerful than individual SNP association (Liu et al., Reference Liu, McRae, Nyholt, Medland, Wray and Brown2010). In these analyses, we used a MAF >0.01 and SNP coordinates based on Build37 (hg19). Our test included 20,944 genes and we used a p value of 2.3E-06 to declare significance.
Genotyping was available for 4,762 individuals (including 271 second siblings that were not included in the twin modeling). Following imputation quality control, data for ~7.5 million SNPs was available for the GWAS.
Results
Twin Modeling and Variance Components for Acne
The majority (63%) of the individuals assessed in this analysis had mild or moderate acne, with only 7% of the cohort showing severe acne. Thresholds could be equated within twin pairs, across zygosity groups, and for twins and siblings, without any loss of fit (p > .05).
Polychoric co-twin correlations (r MZ =0.86, 95% CI [0.81, 0.90]; r DZ = 0.42, 95% CI [0.35, 0.47]), and twin-sibling correlations (r sibling = 0.34, 95% CI [0.26, 0.52]), indicates high heritability and additive and/or dominant effect (Table 1).
There was no significant change of fit (p = .122) when D was removed from the ADE model. However, the fit changed significantly (p < .001) when both A and D where removed (E model vs. AE model), which indicates that there are highly significant genetic contributions to the liability to acne. Estimates from the reduced AE model indicate that 85% (95% CI [0.82, 0.87]) of the variance was explained by additive genetic components and 15% (95% CI [0.11, 0.16]) of the variation was explained by unique environmental components (Table 2).
TABLE 2 Decomposition of the Genetic Variance of Acne Severity
Note: Results from variance components analysis for liability to acne severity; the genetic variance was decomposed into additive (A), non-additive (D) and unique environmental (E) factors. The AE model (in bold) was the most parsimonious model to explain the liability to acne severity. Confidence intervals for the parameter estimates are in brackets. −2LL = Minus twice the log-likelihood of the model. df = degrees of freedom.
GWAS and Genetic Association
Figure 2 shows the Manhattan plot of the associated p values and the quantile–quantile plot of the observed and expected –log10 (p value). There was no evidence of confounding effects or inflation of the data (λ = 1.02). In Table 3 we provide a list of the top 10 SNPs from the GWAS analysis. No genome-wide significant (5E-08) variants were identified. But, suggestive associations were found for three SNPs: rs10515088 locus 5q13.1 (p = 3.9E-07), rs12738078 locus 1p35.5 (p = 6.7E-07), and rs117943429 locus 18q21.2 (p = 9.1E-07).
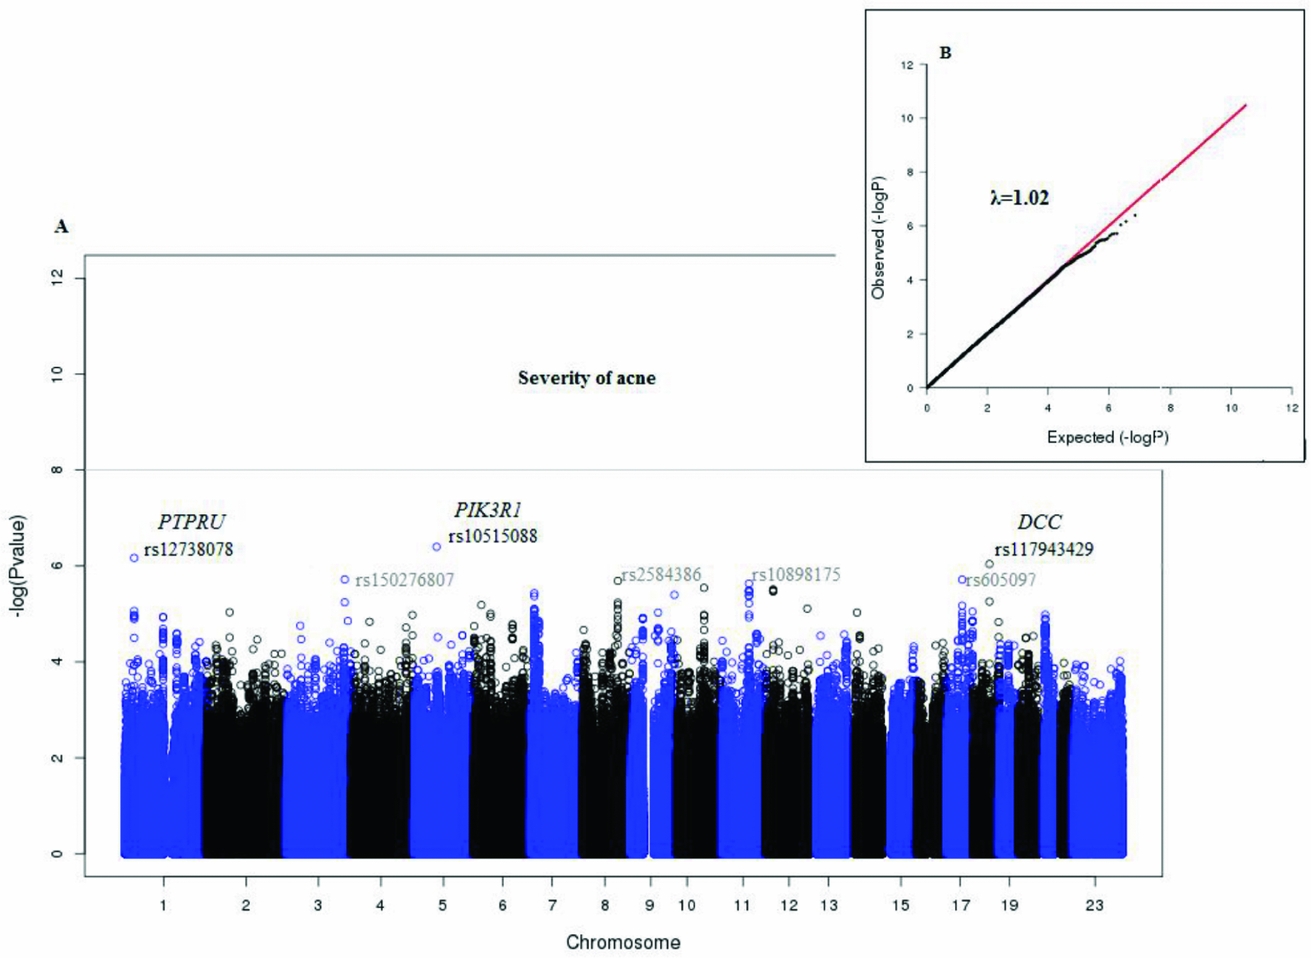
FIGURE 2 Plots for the GWAS analysis of acne severity.
TABLE 3 Top 10 SNPs With the Highest Association with Acne
Note: Top 10 SNPs (with the lowest p value) from GWAS analysis of acne severity. Reference SNP identification, p value for the significance of the association, chromosome (in bold), followed by the position of the SNP in the human genome reference (hg19) and the nearest gene or genes to the SNP.
In order to search for potentially causative SNPs or other variants in high LD with these three SNPs, we made regional association plots using LocusZoom (Pruim et al., Reference Pruim, Welch, Sanna, Teslovich, Chines, Gliedt and Willer2010); see Figure 3. The pairwise search found a group of eight SNPs that were in moderate LD (R 2 > 0.6 < 0.8) with the locus rs12738078 (Figure 3A), but there were no other SNPs in high LD levels within ~1.5Mb of rs10515088 (Figure 3B), and rs117943429 (Figure 3C). All of these variants were intergenic.

FIGURE 3 Regional association plots for the top three SNPs associated with acne severity.
Figure 4 shows the Manhattan plot for the gene-association analysis; no gene reached genome-wide significance. Three genes were located in chromosome 17 (DHRS11, KAT7, PIGW) and one gene in chromosome 9 (ASS1). Genes DHRS11 and PIGW were located at the same locus and it is not possible to distinguish which of the two is tagged by the SNPs signals. The strongest evidence for association was found for the gene OR10J5 (p = 4.4E-05) an olfactory receptor located in chromosome five. Gene positions and p values are presented in Table 4. Regional association plots for the top five genes identified by the gene-base analysis are presented in Figure 5.

FIGURE 4 Manhattan plot for gene-association analysis from VEGAS2.
TABLE 4 Gene Association Analysis for Acne Severity Using VEGAS2

Note: Presenting the top five genes from the VEGAS2 analysis, chromosome (in bold), number of SNPs associated with each gene, p-value of the gene association analysis, the SNP with the highest association with each gene and p value of the SNP in the GWAS analysis for acne. * DHRS11and PIGW are located in the same locus and cannot be distinguished.
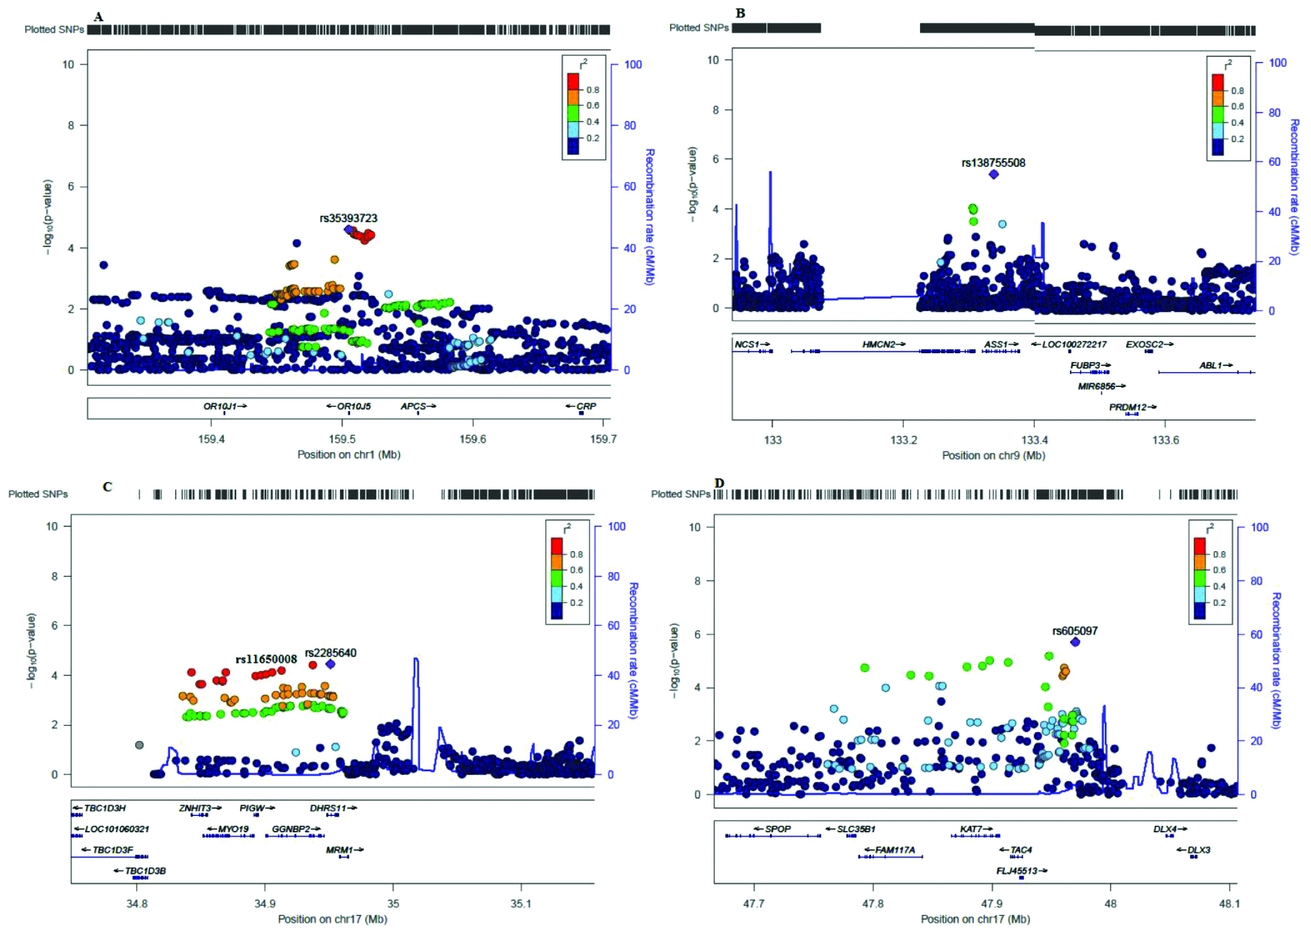
FIGURE 5 Regional plots for the top five genes identified by the gene-association analysis with VEGAS2.
Discussion
In this study, we estimated the heritability of acne severity in an unselected sample of Australian teenage twins and their siblings and searched for molecular variants that contribute to this genetic variance. Although our data did not include clinical cases and the majority of individuals had mild to moderate levels of acne, our analysis showed a high heritability for acne severity (h 2 = 0.85, 95% CI [0.82, 0.87]) that was best explained by additive genetic effects and non-shared environments. These results are in concordance with previous studies of heritability of acne by us (Evans et al., Reference Evans, Kirk, Nyholt, Novac and Martin2005) and others (Bataille et al., Reference Bataille, Snieder, Macgregor, Sasieni and Spector2002; Liddell, Reference Liddell1976; Szabó et al., Reference Szabó, Tax, Teodorescu-Brinzeu, Koreck and Kemény2011; Walton et al., Reference Walton, Wyatt and Cunliffe1988). Particularly, our results agree with the study by Evans et al. (Reference Evans, Kirk, Nyholt, Novac and Martin2005), which used an earlier subset of the QIMR cohort analyzed here and found the heritability for acne to up to 97% (95% CI [0.91, 1.0]) at the site on the back.
Our study found suggestive association (p < 1E-07) for three SNPs: rs10515088, rs117943429, rs12738078, none of which have previously been reported as associated with acne. Interestingly, the SNP rs10515088 is in close proximity to the gene PIK3R1 (Figure 3B), which encodes for a phosphatidylinositol 3-kinase protein member of the PI3-Ks lipid kinases family. PI3K is part of the metabolic pathway of insulin, and a recent study by Ju et al. (Reference Ju, Tao, Hu, Karadag, Al-Khuzaei and Chen2017) has identified that it plays a role in the interplay between androgens, insulin, insulin-like growth factor, and acne. In acne patients, the stimulation of PI3K was associated with a significantly reduced proliferation but increased differentiation of sebocytes. We suggest that the 5q13.1 locus may be a genomic region of interest for acne given the proximity with the PIK3R1.
While our analysis did not find genome-wide associated SNPs, the sample size of our study is relatively low, limiting the power of our study.
Our results support the hypothesis that acne is a trait influenced by the action of multiple loci with small effect. At least three metabolic pathways have shown to be involved in acne susceptibility: TGFb pathways, PI3K, and DDB, and it is likely that there are others that will be identified in the future. Detecting genomic regions associated with acne requires a larger sample size. As such, a meta-analysis that summarizes the data from different cohorts could be a powerful analysis to find more variants with more robust associations with acne.
Acknowledgments
We are grateful to the twins and their families for their participation and to the nurses that helped to gather the data.
Financial Support
LCC was supported by a QIMR Berghofer fellowship.
Conflict of Interest
None.


