
Abstract
Little is known about how genetic variation contributes to neuroanatomical variability, and whether particular genomic regions comprising genes or evolutionarily conserved elements are enriched for effects that influence brain morphology. Here, we examine brain imaging and single-nucleotide polymorphisms (SNPs) data from ∼2,700 individuals. We show that a substantial proportion of variation in cortical surface area is explained by additive effects of SNPs dispersed throughout the genome, with a larger heritable effect for visual and auditory sensory and insular cortices (h2∼0.45). Genome-wide SNPs collectively account for, on average, about half of twin heritability across cortical regions (N=466 twins). We find enriched genetic effects in or near genes. We also observe that SNPs in evolutionarily more conserved regions contributed significantly to the heritability of cortical surface area, particularly, for medial and temporal cortical regions. SNPs in less conserved regions contributed more to occipital and dorsolateral prefrontal cortices.
Introduction
To understand the complexity of human higher cognition, it is essential to study the properties of the cerebral cortex1,2. Genetics play a critical role, as identifying the genetic underpinning of phenotypic variability provides a causal foothold. A striking feature of the human cerebral cortex is that it follows an ancient mammalian prototype but also displays an enormous expansion in cortical surface area3,4,5,6. This expansion did not occur homogeneously across the cortex1,3. The alteration of cortical organization may have significant functional consequences in human cognition. Genetic variation is thought to be a major factor in this alteration and to underlie phenotypic variability among individuals1. However, quantifying the source of genetic contribution to phenotypic differences in humans and mapping the genetic and evolutionary architecture of cortical surface area across different cortical regions are ongoing challenges.
One fundamental question is the extent to which neuroanatomical variability among individuals is caused by genetic differences. Twin and pedigree designs have been used to estimate the ‘heritability’ of a phenotype by examining the resemblance of the phenotype between relatives7. Heritability is the proportion of the phenotypic variance ascribable to genetic differences in a given population: the proportion of variation due to additive genetic effects (narrow-sense heritability) or the proportion of variation due to all genetic effects (broad-sense heritability)7. Twin/family studies have shown that brain phenotypes are heritable (for example, heritability up to ∼0.8)8.
Technological advances now allow assay of individuals for millions of single-nucleotide polymorphisms (SNPs) spanning the whole genome9. Genetic similarity or relationship among a group of individuals can then be estimated through the use of dense genetic variants. By contrasting genetic similarity with phenotypic similarity, one can estimate the heritability of a phenotype in the absence of family members9,10. A recent popular method for carrying out relevant analyses involves a mixed linear model to fit a genetic relationship matrix (GRM) to measured phenotypes, such as the methodology built into the genome-wide complex trait analysis (GCTA) tool9,11. The resulting estimate is referred to as ‘SNP’ or ‘chip heritability’ (h2)12,13. Using the GCTA approach, researchers have estimated that about half of the heritability of human height can be attributed to ∼0.3 million common SNPs11. In comparison, only ∼16% of variability in height can be attributed to all individual SNPs discovered by genome-wide association studies14. This finding suggests that height has a polygenic architecture in which a large number of common genetic variants with small effects contribute predominantly additively to phenotypic variation.
To investigate the polygenic contribution of common SNPs to cortical structures, we apply the GCTA method to a combined sample from five cohorts. Raw imaging and genotype data from all study cohorts are processed with a standardized protocol to minimize data heterogeneity. The analysis for estimating SNP heritability is potentially sensitive to population structure (that is, population stratification and cryptic relatedness). It is therefore typical to restrict the analysis to unrelated individuals of a single genetic ancestry12. We exclude non-Europeans based on principal component analysis of the GRM. We estimate pairwise GRM using all 2,480,482 directly genotyped and imputed autosomal SNPs. We also exclude related individuals using two thresholds at an estimated GRM ≥0.025 (more related than third or fourth cousins), or a less stringent threshold at an estimated GRM ≥0.1. This sampling results in subsets of 2,364 or 2,698 generally unrelated individuals with European ancestry, respectively.
Phenotype definition is critical for all genetic association studies, especially in brain imaging genetic studies, due to the high dimensionality of cortical measures (∼0.3 million points per subject)15. Using a data-driven, fuzzy clustering technique with magnetic resonance imaging (MRI) scans of twins, we previously parcelled cortical surface area into 12 genetic subdivisions, creating an atlas based solely on genetically informative data6,16 (Fig. 1b). Boundaries of the genetic divisions correspond largely to meaningful structural and functional regions; however, the divisions represent novel phenotypes. We use these regions, conforming to the genetic patterning of cortical surface area, to increase power for detecting effects and to minimize multiple comparisons after reducing image dimensionality to these parcels. The aim of our large-scale whole-genome and whole-cortex analyses is to examine and dissect the polygenic genetic architecture of cortical surface area across different cortical regions.

(a) Estimates of variance explained by all autosomal SNPs for each cortical region (SNP heritability) from genetic relationships <0.025 (GRM<0.025). Error bars represent the s.e. of the estimates. Estimates were tested for significantly different from zero by likelihood ratio test comparing the full and reduced models. *P<0.05, **P<0.004 (Bonferroni correction threshold). (b) Genetic clustering map shows the anatomical location of the cortical phenotypes16. (c) SNP heritability estimates (blue bars) are overlaid on twin heritability estimates (grey bars). Shared environmental variances are small and not significant for all phenotypes. A: additive genetic variance; C: shared environmental variance; E: unique environmental variance.
Results
SNP heritability
In our five-cohort sample, we found that a substantial proportion of variation in surface area in almost all of the 12 regions is captured by all autosomal SNPs after accounting for global cortical size. A few cortical regions, such as the insula, visual and auditory sensory regions, including superior temporal and occipital cortices, have a high SNP heritability of up to ∼0.45 (s.e. 0.12) (Fig. 1a; Supplementary Table 1). We reported two sets of results based on the inclusion of individuals with pairwise GRM entry scores <0.025 or <0.1 to determine the consistency of our findings. The GRM<0.1-sample offers the advantage of a larger sample size, whereas the GRM<0.025-sample is less susceptible to potential confounding from cryptic relatedness. The results from the two sets of samples are consistent (Supplementary Fig. 1a; Supplementary Table 1), supporting the reliability of our findings. To ensure the validity of the method applied to our sample, we performed a simulation study and power calculation. We also verified that our main findings were not sensitive to patient samples, nor sensitive to linkage disequilibrium (LD), that is, the correlation among SNPs, in the genome (see Supplementary Methods and Supplementary Table 2).
Twin heritability
We next sought to compare the SNP heritability with twin heritability estimated from 466 twins. Heritabilities of the same cortical imaging phenotypes were estimated in a classical twin model implemented in the OpenMx software suite. The results of twin heritability estimates (additive genetic variances) across different cortical regions are shown in Fig. 1c (Supplementary Table 3)8. The average monozygotic and dizygotic correlations across all cortical regions were 0.62 and 0.32, respectively, suggesting almost a perfect additive genetic proportion in these phenotypes.
Partitioning of genomic variation by genic annotation
We partitioned the variance explained by all the SNPs into genic and intergenic regions across all autosomal chromosomes. We defined genic boundaries as 20 kb upstream and downstream from the 3′ and 5′ untranslated regions (UTRs) of each gene17 (Fig. 2a; Supplementary Tables 4 and 7). Furthermore, we used an LD-weighted genic annotation scheme that takes into account the LD structure to categorize SNPs that have high LD with SNPs within genic elements (Fig. 2b; Supplementary Tables 5 and 8)18. The results from the two methods were consistent, with evidence of enriched genetic effects in the genic regions for many cortical regions.

(a) Estimates of variance explained by genic and intergenic regions (GRM<0.025). The genic region is defined as ±20 kb from the 3′ and 5′ UTRs. (b) Estimates of variance explained by genic and intergenic regions. The genic region is defined by the LD-weighted genic annotation scheme. *P<0.05, **P<0.004. Error bars represent the s.e. of the estimates. Estimates were tested for significantly different from zero by likelihood ratio test.
Partitioning of genomic variation by conservation annotation
Conservation scores were derived from multiple alignments of placental mammal genomes to the human genomes19. We observed that more conserved SNPs collectively have genetic influences on several cortical regions especially around the insula, superior, anterior and medial temporal lobes, including parahippocampus gyrus and entorhinal cortex (Fig. 3a; Supplementary Table 6). Less conserved SNPs collectively exhibit greater polygenic effects on occipital and dorsolateral prefrontal cortices.

(a) Estimates of variance explained by less conserved and more conserved regions (GRM<0.025). *P<0.05, **P<0.004. Error bars represent the s.e. of the estimates. Estimates were tested for significantly different from zero by likelihood ratio test. (b) A significant correlation between estimates of variance explained by genic and more conserved SNPs across phenotypes.
Correlation explained by genic and conserved SNPs
We also found a highly significant correlation between the variance explained by genic SNPs and variance explained by more conserved SNPs (Fig. 3b), and between intergenic SNPs and less conserved SNPs (Supplementary Fig. 3). To rule out the possibility that genic and conservation annotation are surrogates for one another, we computed the correlation between the LD-weighted genic and conservation scores. The correlation of r=0.58 indicates that substantial variation can be attributed uniquely to each (shared variance, R2=0.34).
Discussion
Although identifying genetic determinants of the human brain is an active area of research20,21, studies on the polygenic architecture of brain imaging phenotypes are limited, partially because of a lack of availability of appropriate data sets22,23. We show that a substantial proportion of the heritable component of the cortex resides among common variants that can be interrogated via current genome-wide genotyping arrays. This suggests that with larger sample sizes, SNPs associated with cortical surface area could be discovered24. A few cortical regions, such as the insula, visual and auditory sensory regions, including superior temporal and occipital cortices, have a high SNP heritability of up to ∼0.45 (s.e. 0.12). Recent evidence suggests that non-heritable genetic variation might be widespread in the brain and has potential contribution to complex functional diversification25,26. Our results show that heritable genetic variation has substantial impact on cortical area variation. Thus, these findings imply that genetic underpinnings of brain phenotypes likely involve the combined effects of many common variants of small effects, as well as non-heritable genetic variation.
SNP heritability estimates quantify the overall contribution of the additive effects of all SNPs, which provides a lower bound of the narrow-sense heritability of the trait estimated in pedigree studies, since pedigree information captures the effects of all genetic variants on phenotypic similarity13. We observe broad agreement between SNP and twin heritability across cortical regions. Similar to the height study11, we captured about half of twin heritability on average with the SNP heritability across cortical regions. However, some regions, such as the motor–premotor cortex and precuneus, have high twin heritability but low SNP heritability. This finding suggests that non-additive genetic effects could play a role in these phenotypes, because the additive genetic effects estimated from the twin model potentially include non-additive effects such as epistatic interactions and inherited epigenetic variation27,28. Alternatively, ungenotyped causal variants affecting these regions might have lower allele frequencies than do common SNPs, and/or are not tagged by the genotyped SNPs. Furthermore, the difference could also be due purely to sampling variation—including differences in age, gender and ancestry—or random errors (for example, both twin and SNP heritability estimates have average s.e. of ∼0.11). Taken together, the observed information provides clues, and lower and upper bounds of genetic effects, in the search for trait-associated variants.
Obtaining evidence for the polygenic architecture of complex traits provides a rationale for further dissecting the contribution of particular genomic regions to phenotypic expression10,17,29. Specifically, we focus on the genetic effects of genic and regulatory element regions of the genome. SNPs in these functional genomic regions have been shown to be enriched for associations across diverse phenotypes18. We therefore partitioned the variance explained by all the SNPs into genic and intergenic regions across all autosomal chromosomes. We defined genic boundaries as 20 kb upstream and downstream from the 3′ and 5′ UTRs of each gene17 (Fig. 2a; Supplementary Table 4). Furthermore, we used an LD-weighted genic annotation scheme that takes into account the LD structure to categorize SNPs that have high LD with SNPs within genic elements (Fig. 2b; Supplementary Table 5)18. The results from the two methods were consistent, with evidence of enriched genetic effects in the genic regions for many cortical regions. However, some cortical regions also had substantial variation explained by SNPs partitioned into an intergenic category, such as the occipital, orbitofrontal and inferior parietal cortices. Note that the intergenic category in this definition may still include some regulatory elements farther away from genes (for example, enhancers); these have been implicated in brain development30.
The 1000-fold difference in cortical surface area between humans and mice may contribute to our complex behaviours1,3. The cerebral cortex subserves an array of higher-order brain functions that are uniquely specialized in humans, and changes in these functions and their networks may make us prone to neurobiological disorders such as schizophrenia, autism or Alzheimer’s disease1,2,4,31. Therefore, it is of particular interest to explore the contribution of genetic variants that are presumably more human specific in their evolutionary lineage than other variants31. Conservation scores were derived from multiple alignments of placental mammal genomes to the human genomes19. We observed that more conserved SNPs collectively have genetic influences on several cortical regions especially around the insula, superior, anterior and medial temporal lobes, including parahippocampus gyrus and entorhinal cortex (Fig. 3a; Supplementary Table 6). Several of these regions belong to the allocortex, which has fewer cortical laminae than the neocortex and is regarded as evolutionarily more primitive32. On the other hand, less conserved SNPs collectively exhibit greater polygenic effects on occipital and dorsolateral prefrontal cortices, the regions that subserve visual perception and executive function respectively. Visual specialization is one hallmark of primate brain evolution. Primates have relatively enlarged visual areas and are visually orientated mammals33. The dorsolateral prefrontal cortex is located in the expanded prefrontal cortex of primates, and is a vital region of distributed brain networks linked to many complex cognitive functions in humans5.
We also found a highly significant correlation between the variance explained by genic SNPs and variance explained by more conserved SNPs (Fig. 3b), and between intergenic SNPs and less conserved SNPs (Supplementary Fig. 3). These findings suggest the existence of a possible pattern in which phenotypic variation in more conserved cortical regions is influenced to a greater degree by more conserved and genic SNPs, and more human-specific cortical regions are influenced to a greater degree by less conserved and intergenic SNPs. Our result is preliminary, but this trend may be biologically plausible and is noteworthy for further investigation.
We show that a substantial proportion of the heritable component of the cortex resides among common variants that can be interrogated via current genome-wide genotyping arrays. By leveraging genic and conservation annotations we were able to reveal that particular genomic regions are enriched for variants that influence variation in cortical surface area. Each cortical region appears to have elements of region-specific genetic architecture, which might relate to functional specialization of the cortical regions. Elucidating the sources of these genetic effects will allow investigators to prioritize resources for future investigations. Cortical surface area is similar to other complex traits in terms of polygenicity distributed among common variants and genetic effects enriched in genic regions. Yet, the human brain is a uniquely complex phenotype, in that its genomic properties appear as complex as its functional capacity. In this light, it should be acknowledged that beyond polymorphisms and structural variants in the genome, epigenomics34, alternative splicing35 and somatic mosaicism25 may contribute to phenotypic diversity in normal brain development. A variety of data types together will help to advance our understanding of the human cortex as an adaptive and plastic entity that is shaped both by genetics and by its interaction with the environment.
Methods
Participants
A total of 3,696 subjects with available and sufficient quality MRI scans from 5 cohorts were analysed. We removed non-European descents and related individuals. The combined sample of five cohorts is made of 605 subjects from the Thematically Organized Psychosis study (mean age: 35 years, range=17–70 years)36, 842 Health Study of Nord-Trøndelag (HUNT) subjects (mean age: 58 years, range=50–66 years)37, 325 Norwegian Cognitive NeuroGenetics subjects (mean age: 52 years, range=19–79 years)38, 726 Alzheimer’s Disease Neuroimaging Initiative subjects (mean age: 75 years, range=55–92 years) and 1,198 Pediatric Imaging Neurocognition and Genetics subjects (mean age: 12 years, range=3–21 years)39,40 (see Supplementary Methods for more details).
The samples for the twin analysis was part of the Vietnam Era Twin Study of Aging (VETSA) study41. There were 466 participants at age 51–60 years, of which 99 pairs were dizygotic twins and 134 pairs monozygotic twins. The sample is representative of US middle-aged men in their lifestyle and health characteristics.
Each study was approved by the local Institutional Review Board: South East Norway (Thematically Organized Psychosis and Norwegian Cognitive NeuroGenetics) and Mid Norway (HUNT) Regional Ethical Committee (HUNT), and UC San Diego (Paediatric Imaging Neurocognition and Genetics and VETSA).
Genotype quality control and imputation
All studies were genotyped using different commercial arrays. Standard genome-wide association quality control measures were applied to each study individually using the Plink toolset42,43. Samples missing >5% of SNPs, with a minor allele frequency of <1%, or failing a test of Hardy–Weinberg equilibrium (P<1 × 10⁻⁶), were excluded. Individual samples showing an over- or underabundance of heterozygosity (>5 s.d. from the mean) were labelled as poor quality and also excluded from subsequent analyses44. Furthermore, to ensure that all individuals were unrelated, functions available in the software package GCTA45 were used to estimate kinship values from SNP genotypes for all pairs of individuals in the combined cohort. Population stratification and ancestry were assessed against a reference sample consisting of individuals from the HapMap III46 and 1000 Genomes47 via principal component analysis implemented in the software package EIGENSOFT48. One half of each pair of individuals with an estimated relatedness >0.025 or 0.1 was excluded11. Using the more stringent threshold of 0.025, 575 individuals were removed, leaving a total of 2,364 individuals for the subsequent analyses. In this combined cohort of European ancestry with minimal relatedness between subjects (GRM<0.025), 52% of the individuals were female; the subjects were aged 47±24 years (range=3–90 years); and 273, 128, 131, 147 and 66 subjects were diagnosed with mild cognitive impairment, Alzheimer’s disease, schizophrenia, bipolar disorder and other psychotic, respectively. For the less stringent threshold of the estimated relatedness of 0.1, 241 individuals were removed, leaving a total of 2,698 individuals for the subsequent analyses (GRM<0.1). To maximize information present in the data and allow for comparison across multiple samples genotyped on different platforms, genotype imputation was performed using the software packages MaCH49 and Minimac50. A quality control metric (r2) was provided by Minimac and a threshold of r2>0.5 was used to declare successful imputation.
MRI processing
MRI scans were analysed with software developed at the University of California, San Diego, Multi-Modal Imaging Laboratory based on the freely available FreeSurfer software package (http://freesurfer-software.org/). The cortical surface was reconstructed to measure surface areas at each surface location (a total of over 160,000 locations for each hemisphere) using a semi-automated approach15,51. Variation in image intensity due to magnetic field inhomogeneities was corrected, a normalized intensity image was created and the skull (non-brain) was removed from this image. The resulting surface was covered with a polygonal tessellation and smoothed to reduce metric distortions. A refinement procedure was then applied to obtain a representation of the grey/white boundary, and the resulting surface was subsequently deformed outwards to obtain an explicit representation of the pial surface. Once generated, the cortical surface model was individually reviewed, and ∼90 subjects were removed for failed surface reconstruction, often related to excessive head motion artefact. Quality control includes assessing the accuracy of surface reconstruction and subcortical segmentation, and detecting large-scale brain atrophy. In addition, manual editing was performed for technical accuracy in Alzheimer’s Disease Neuroimaging Initiative and VETSA. The edits typically involve the addition or removal of voxels from white matter or brain masks to correct white matter over- or underestimation or to remove non-brain tissues labelled as grey matter. For example, white matter abnormalities commonly seen in aging populations could cause white matter incorrectly labelled as cortical surface. However, we generally find that analysis outcomes are quite similar with or without manually editing, especially in a large set of data. Maps were spatially smoothed and placed into a common coordinate system using a non-rigid high-dimensional spherical averaging method to align cortical folding patterns51. Due to the standardized procedure for image acquisition and analysis, the MRI data consistency was maximized for pooling the data across studies.
Genetically based cortical phenotypes
We previously used a data-driven fuzzy clustering technique to identify parcels of the human cortex that are maximally genetically correlated (that is, under the control of similar genetic factors) based on the MRI scans of over 400 twins6,16. We used this twin-based cluster map to assign a parcellation label to each location on a cortical surface based on partial membership information estimated from the clustering analysis, and calculated the weighted average surface area within each region for each subject. We used these regions, defined a priori on the basis of genetic information, to increase power for detecting effects and minimize multiple comparisons after reducing image dimensionality to these parcels.
To account for global effects, we divided the area measure of each location by the total surface area, so that the observed effects were specific to region of interest rather than having global associations with total surface area6,16. In the present study, in all analyses we further adjusted each phenotype for the covariates of age, gender, age × gender, scanner, diagnosis and study cohort. The sample age ranges from 3 to 90 years. We used polynomial basis functions and a generalized additive modelling framework to model age effects as nonparametric smooth functions to control for considerable age disparities52, so the effects that we characterized can be generalized across the lifespan.
SNP heritability
We used a mixed linear model to fit a covariance structure of GRM to a vector of measured phenotypes via the GCTA tool9,11 to estimate the proportion of phenotypic variance captured by all autosomal SNPs. The analyses included common SNPs (for example, minor allele frequency >0.01). We included the top 10 eigenvectors of the principal component analysis of an allele-sharing distance matrix or GRM as covariates to capture any remaining population structure in our European data set.
As described further in the Supplementary Methods, the mixed linear model analysis in quantitative genetics partitions the phenotypic variance–covariance matrix between two (or more) specified matrices. One typical form is:

where G is a matrix of kinship or genetic correlation coefficients and I is the n × n identity matrix, which assumes independence of environmental effects (that is, no shared environment) and measurement error across individuals. Estimates  and
and  are typically obtained via restricted maximum likelihood. Narrow-sense heritability,
  , the proportion of phenotypic variance explained by additive genetic effects, is estimated by
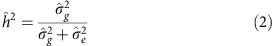
The resulting estimate is referred to as ‘SNP’ or ‘chip heritability’ (h2), since it is based on the SNPs used to construct the GRM12,13.
Partitioning of genomic variation by genic annotation
We partitioned the variance explained by all of the SNPs into genic and intergenic regions of the whole genome. We obtained 24,526 gene boundaries from the UCSC Genome Browser hg19 assembly. We defined genic boundaries as ±20 kb upstream and downstream from the 3′ and 5′ UTRs of each gene, where genic and intergenic coverages are roughly equal (∼50%). This definition was used previously17. We estimated the proportion of variance explained by genic and intergenic regions. The results are shown in Fig. 2a and Supplementary Table 4 for the GRM<0.025-sample and Supplementary Fig. 2a and Supplementary Table 7 for the GRM<0.1-sample. We further used an LD-weighted genic annotation scheme that takes into account the LD structure to select SNPs that are related to exon, intron, 3′ UTR, 5′ UTR and 1 kb upstream and downstream of genes (six genic categories) (see Supplementary Methods).
Partitioning of genomic variation by conservation annotation
We partitioned the variance explained by all of the SNPs into low- and high-conserved regions of the whole genome based on conservation annotation. We obtained a conservation annotation database from the UCSC Genome Browser hg19 assembly. The conservation scores were derived from alignments of placental mammals to human genome. PhastCons is a hidden Markov model-based method that estimates the probability that each nucleotide belongs to a conserved element, based on the multiple alignments19.
We assigned weights to conservation scores based on the LD information. We applied the pairwise LD matrix to the vector of phastCons scores. We expect that SNPs with the LD-weighted conservation annotation show more consistent and less noisy association signals. After the LD weighting, 48,523 of the ∼2.4 million SNPs had no scores and were eliminated from the subsequent analysis. We selected the median as a threshold to partition the genome evenly into low- and high-conserved SNPs (∼50%). We estimated the proportion of variance explained by low- and high-conserved genomic regions. The results are shown in Fig. 3a and Supplementary Table 6 for the GRM<0.025-sample, and Supplementary Fig. 3 and Supplementary Table 9 for the GRM<0.1-sample.
Additional information
How to cite this article: Chen, C.-H. et al. Large-scale genomics unveil polygenic architecture of human cortical surface area. Nat. Commun. 6:7549 doi: 10.1038/ncomms8549 (2015).
References
Geschwind, D. H. & Rakic, P. Cortical evolution: judge the brain by its cover. Neuron 80, 633–647 (2013).
Konopka, G. & Geschwind, D. H. Human brain evolution: harnessing the genomics (r)evolution to link genes, cognition, and behavior. Neuron 68, 231–244 (2010).
Rakic, P. Evolution of the neocortex: a perspective from developmental biology. Nat. Rev. Neurosci. 10, 724–735 (2009).
Krubitzer, L. The magnificent compromise: cortical field evolution in mammals. Neuron 56, 201–208 (2007).
Buckner, R. L. & Krienen, F. M. The evolution of distributed association networks in the human brain. Trends Cogn. Sci. 17, 648–665 (2013).
Chen, C. H. et al. Genetic influences on cortical regionalization in the human brain. Neuron 72, 537–544 (2011).
van Dongen, J., Slagboom, P. E., Draisma, H. H., Martin, N. G. & Boomsma, D. I. The continuing value of twin studies in the omics era. Nat. Rev. Genet. 13, 640–653 (2012).
Kremen, W. S. et al. Genetic and environmental influences on the size of specific brain regions in midlife: the VETSA MRI study. Neuroimage 49, 1213–1223 (2010).
Vinkhuyzen, A. A., Wray, N. R., Yang, J., Goddard, M. E. & Visscher, P. M. Estimation and partition of heritability in human populations using whole-genome analysis methods. Annu. Rev. Genet. 47, 75–95 (2013).
Schork, N. J. Genome partitioning and whole-genome analysis. Adv. Genet. 42, 299–322 (2001).
Yang, J. et al. Common SNPs explain a large proportion of the heritability for human height. Nat. Genet. 42, 565–569 (2010).
Speed, D., Hemani, G., Johnson, M. R. & Balding, D. J. Improved heritability estimation from genome-wide SNPs. Am. J. Hum. Genet. 91, 1011–1021 (2012).
Visscher, P. M. et al. Statistical power to detect genetic (co)variance of complex traits using SNP data in unrelated samples. PLoS Genet. 10, e1004269 (2014).
Wood, A. R. et al. Defining the role of common variation in the genomic and biological architecture of adult human height. Nat. Genet. 46, 1173–1186 (2014).
Dale, A. M., Fischl, B. & Sereno, M. I. Cortical surface-based analysis. I: segmentation and surface reconstruction. Neuroimage 9, 179–194 (1999).
Chen, C. H. et al. Hierarchical genetic organization of human cortical surface area. Science 335, 1634–1636 (2012).
Yang, J. et al. Genome partitioning of genetic variation for complex traits using common SNPs. Nat. Genet. 43, 519–525 (2011).
Schork, A. J. et al. All SNPs are not created equal: genome-wide association studies reveal a consistent pattern of enrichment among functionally annotated SNPs. PLoS Genet. 9, e1003449 (2013).
Siepel, A. et al. Evolutionarily conserved elements in vertebrate, insect, worm, and yeast genomes. Genome Res. 15, 1034–1050 (2005).
Hawrylycz, M. J. et al. An anatomically comprehensive atlas of the adult human brain transcriptome. Nature 489, 391–399 (2012).
Thompson, P. M. et al. The ENIGMA Consortium: large-scale collaborative analyses of neuroimaging and genetic data. Brain Imaging Behav. 8, 153–182 (2014).
Bryant, C. et al. Mapping the genetic variation of regional brain volumes as explained by all common SNPs from the ADNI study. PLoS ONE 8, e71723 (2013).
Toro, R. et al. Genomic architecture of human neuroanatomical diversity. Mol. Psychiatry (2014) e-pub ahead of print 16 September 2014 doi:10.1038/mp.2014.99.
Stein, J. L. et al. Identification of common variants associated with human hippocampal and intracranial volumes. Nat. Genet. 44, 552–561 (2012).
McConnell, M. J. et al. Mosaic copy number variation in human neurons. Science 342, 632–637 (2013).
Poduri, A., Evrony, G. D., Cai, X. Y. & Walsh, C. A. Somatic mutation, genomic variation, and neurological disease. Science 341, 1237758 (2013).
Falconer, D. S. & Mackay, T. F. Introduction to Quantitative Genetics Longman Group Ltd (1996).
Johannes, F., Colot, V. & Jansen, R. C. Epigenome dynamics: a quantitative genetics perspective. Nat. Rev. Genet. 9, 883–890 (2008).
Lee, S. H. et al. Estimating the proportion of variation in susceptibility to schizophrenia captured by common SNPs. Nat. Genet. 44, 247–250 (2012).
Visel, A. et al. A high-resolution enhancer atlas of the developing telencephalon. Cell 152, 895–908 (2013).
Gilbert, S. L., Dobyns, W. B. & Lahn, B. T. Genetic links between brain development and brain evolution. Nat. Rev. Genet. 6, 581–590 (2005).
Purves, D. et al. Neuroscience Sinauer Associates, Inc. (2004).
Barton, R. A. Visual specialization and brain evolution in primates. Proc. Biol. Sci. 265, 1933–1937 (1998).
Lister, R. et al. Global epigenomic reconfiguration during mammalian brain development. Science 341, 1237905 (2013).
Kang, H. J. et al. Spatio-temporal transcriptome of the human brain. Nature 478, 483–489 (2011).
Rimol, L. M. et al. Cortical volume, surface area, and thickness in schizophrenia and bipolar disorder. Biol. Psychiatry 71, 552–560 (2012).
Honningsvag, L. M., Linde, M., Haberg, A., Stovner, L. J. & Hagen, K. Does health differ between participants and non-participants in the MRI-HUNT study, a population based neuroimaging study? The Nord-Trondelag health studies 1984-2009. BMC Med. Imaging 12, 23 (2012).
Espeseth, T. et al. Imaging and cognitive genetics: the Norwegian Cognitive NeuroGenetics sample. Twin Res. Hum. Genet. 15, 442–452 (2012).
Brown, T. T. et al. Neuroanatomical assessment of biological maturity. Curr. Biol. 22, 1693–1698 (2012).
Bartsch, H., Thompson, W. K., Jernigan, T. L. & Dale, A. M. A web-portal for interactive data exploration, visualization, and hypothesis testing. Front. Neuroinform. 8, 25 (2014).
Kremen, W. S. et al. Genes, environment, and time: the Vietnam Era Twin Study of Aging (VETSA). Twin Res. Hum. Genet. 9, 1009–1022 (2006).
Purcell, S. et al. PLINK: a tool set for whole-genome association and population-based linkage analyses. Am. J. Hum. Genet. 81, 559–575 (2007).
Pluzhnikov, A. et al. Spoiling the whole bunch: quality control aimed at preserving the integrity of high-throughput genotyping. Am. J. Hum. Genet. 87, 123–128 (2010).
Athanasiu, L. et al. Gene variants associated with schizophrenia in a Norwegian genome-wide study are replicated in a large European cohort. J. Psychiatr. Res. 44, 748–753 (2010).
Yang, J., Lee, S. H., Goddard, M. E. & Visscher, P. M. GCTA: a tool for genome-wide complex trait analysis. Am. J. Hum. Genet. 88, 76–82 (2011).
Altshuler, D. M. et al. Integrating common and rare genetic variation in diverse human populations. Nature 467, 52–58 (2010).
1000 Genomes Project Consortium. A map of human genome variation from population-scale sequencing. Nature 467, 1061–1073 (2010).
Price, A. L. et al. Principal components analysis corrects for stratification in genome-wide association studies. Nat. Genet. 38, 904–909 (2006).
Li, Y., Willer, C. J., Ding, J., Scheet, P. & Abecasis, G. R. MaCH: using sequence and genotype data to estimate haplotypes and unobserved genotypes. Genet. Epidemiol. 34, 816–834 (2010).
Howie, B., Fuchsberger, C., Stephens, M., Marchini, J. & Abecasis, G. R. Fast and accurate genotype imputation in genome-wide association studies through pre-phasing. Nat. Genet. 44, 955–959 (2012).
Fischl, B., Sereno, M. I. & Dale, A. M. Cortical surface-based analysis. II: inflation, flattening, and a surface-based coordinate system. Neuroimage 9, 195–207 (1999).
Wood, S. N. Generalized Additive Models : an Introduction with R xvii: 392Chapman & Hall/CRC (2006).
Acknowledgements
Funded by the National Institute of Mental Health R01MH100351; National Institute on Aging R01AG22381, AG18386 and AG18384; NARSAD Young Investigator award (C.-H.C). Liaison Committee between the Central Norway Regional Health Authority and the Norwegian University of Science and Technology, HUNT administration grants, and National Norwegian Advisory Unit, for functional MRI methods. South East Norway Health Authority (#2013-123), Research Council of Norway (#229129, #213837 and #223273), EU (#602450) and KG Jebsen Foundation. Part of data collection and sharing for this project was funded by the Pediatric Imaging, Neurocognition and Genetics Study (PING), National Institutes of Health Grant RC2DA029475. PING is funded by the National Institute on Drug Abuse and the Eunice Kennedy Shriver National Institute of Child Health & Human Development. PING data are disseminated by the PING Coordinating Center at the Center for Human Development, University of California, San Diego. Part of data collection and sharing for this project was funded by the Alzheimer’s Disease Neuroimaging initiative (ADNI) (National Institutes of Health Grant U01 AG024904) and DOD ADNI (Department of Defense award number W81XWH-12-2-0012). ADNI is funded by the National Institute on Aging, the National Institute of Biomedical Imaging and Bioengineering and through generous contributions from the following: Alzheimer’s Association; Alzheimer’s Drug Discovery Foundation; Araclon Biotech; BioClinica, Inc.; Biogen Idec Inc.; Bristol-Myers Squibb Company; Eisai Inc.; Elan Pharmaceuticals, Inc.; Eli Lilly and Company; EuroImmun; F. Hoffmann-La Roche Ltd and its affiliated company Genentech, Inc.; Fujirebio; GE Healthcare; IXICO Ltd; Janssen Alzheimer Immunotherapy Research & Development, LLC; Johnson & Johnson Pharmaceutical Research & Development LLC; Medpace, Inc.; Merck & Co., Inc.; Meso Scale Diagnostics, LLC; NeuroRx Research; Neurotrack Technologies; Novartis Pharmaceuticals Corporation; Pfizer Inc.; Piramal Imaging; Servier; Synarc Inc.; and Takeda Pharmaceutical Company. The Canadian Institutes of Health Research is providing funds to support ADNI clinical sites in Canada. Private sector contributions are facilitated by the Foundation for the National Institutes of Health (www.fnih.org). The grantee organization is the Northern California Institute for Research and Education, and the study is coordinated by the Alzheimer’s Disease Cooperative Study at the University of California, San Diego. ADNI data are disseminated by the Laboratory for Neuro Imaging at the University of Southern California.
Author information
Authors and Affiliations
Consortia
Contributions
C.-H.C., N.S. and A.M.D. conceived the project and designed its components. C.-H.C., Q.P., A.J.S., M.-T.L., C.-C.F., Y.W., F.B. and D.H. carried out data analyses. C.-H.C., Q.P., A.J.S., Y.W., R.S.D., O.A.A., N.S. and A.M.D. discussed the interpretation of data. L.T.W., W.S.K., T.L.J., S.L.H., V.M.S., T.E., M.H., A.K.H., I.A., S.D. and O.A.A. contributed genotype and phenotype data. C.-H.C., Q.P. and A.J.S. prepared the manuscript, and all authors critically reviewed and approved the manuscript.
Corresponding authors
Ethics declarations
Competing interests
The authors declare no competing financial interests.
Supplementary information
Supplementary Information
Supplementary Figures 1-3, Supplementary Tables 1-9, Supplementary Methods and Supplementary References (PDF 475 kb)
Rights and permissions
This work is licensed under a Creative Commons Attribution 4.0 International License. The images or other third party material in this article are included in the article’s Creative Commons license, unless indicated otherwise in the credit line; if the material is not included under the Creative Commons license, users will need to obtain permission from the license holder to reproduce the material. To view a copy of this license, visit http://creativecommons.org/licenses/by/4.0/
About this article

Cite this article
Chen, CH., Peng, Q., Schork, A. et al. Large-scale genomics unveil polygenic architecture of human cortical surface area. Nat Commun 6, 7549 (2015). https://doi.org/10.1038/ncomms8549
Received:
Accepted:
Published:
DOI: https://doi.org/10.1038/ncomms8549
This article is cited by
-
Williams Syndrome neuroanatomical score associates with GTF2IRD1 in large-scale magnetic resonance imaging cohorts: a proof of concept for multivariate endophenotypes
Translational Psychiatry (2018)
-
Brain cortical characteristics of lifetime cognitive ageing
Brain Structure and Function (2018)
-
Partitioning heritability analysis reveals a shared genetic basis of brain anatomy and schizophrenia
Molecular Psychiatry (2016)
Comments
By submitting a comment you agree to abide by our Terms and Community Guidelines. If you find something abusive or that does not comply with our terms or guidelines please flag it as inappropriate.
