Abstract
Background:
MicroRNAs are small non-coding RNA molecules, which regulate central mechanisms of tumorigenesis. In colorectal tumours, the combination of gain of 8q and 13q is one of the major factors associated with colorectal adenoma to adenocarcinoma progression. Functional studies on the miR-17-92 cluster localised on 13q31 have shown that its transcription is activated by c-myc, located on 8q, and that it has oncogenic activities. We investigated the contribution of the miR-17-92 cluster during colorectal adenoma to adenocarcinoma progression.
Methods:
Expression levels of the miR-17-92 cluster were determined in 55 colorectal tumours and in 10 controls by real-time RT–PCR. Messenger RNA c-myc expression was also determined by real-time RT–PCR in 48 tumours with array comparative genomic hybridisation (aCGH) data available.
Results:
From the six members of the miR-17-92 cluster, all except miR-18a, showed significant increased expression in colorectal tumours with miR-17-92 locus gain compared with tumours without miR-17-92 locus gain. Unsupervised cluster analysis clustered the tumours based on the presence of miR-17-92 locus gain. Significant correlation between the expression of c-myc and the six miRNAs was also found.
Conclusion:
Increased expression of miR-17-92 cluster during colorectal adenoma to adenocarcinoma progression is associated to DNA copy number gain of miR17-92 locus on 13q31 and c-myc expression.
Main
MicroRNAs (miRNAs), which are small non-coding RNA molecules of 18–25 nucleotides long, have been shown to have an important role in cancer. They function by downregulating the expression of multiple target genes by degrading the mRNA or blocking their translation into proteins (Bartel, 2004; Esquela-Kerscher and Slack, 2006). These molecules regulate genes involved in central pathways to cellular homoestasis, development and tumorigenesis, including proliferation, apoptosis, differentiation, maintenance of stem cell potency and angiogenesis (Lee et al, 1993; Wightman et al, 1993; Reinhart et al, 2000; Brennecke et al, 2003; Chen et al, 2004; Zhao et al, 2007). Specific miRNA expression signatures have been described in different cancer (sub)types, and within these cancer types, different miRNA expression signatures predict clinical outcome (Calin and Croce, 2006). In several instances, expression of miRNAs was shown to have a function in tumour biology. One of the first studies published described the tumour suppressor activity of let-7 in lung cancers by downregulating the Ras oncogene (Johnson et al, 2005). Yet, the cause of disturbed miRNA expression in cancer has only partially been elucidated. MiRNAs appear to be frequently located on regions of genomic instability (Calin et al, 2004) and miRNA expression changes have been found to be associated with chromosomal rearrangements in ovarian cancer, breast cancer, lung cancer, melanomas and hematopoietic malignancies (Calin et al, 2002; Hayashita et al, 2005; Lu et al, 2005; Zhang et al, 2006; Tagawa et al, 2007). Alternatively, epigenetic regulation of miRNA expression has been described in colorectal, breast, lung cancers and different cancer cell lines (Saito et al, 2006; Lujambio et al, 2007).
The miR-17-92 cluster (oncomir-1), located within the third intron of the open reading frame 13 (C13orf25), encompasses six miRNAs (miR-17, miR-18a, miR-19a, miR-20a, miR-19b-1 and miR-92a-1) over ∼800 nucleotides on 13q31.3. Amplification of this locus and overexpression of the miR-17-92 cluster have been documented in B-cell lymphomas and lung cancer (Hayashita et al, 2005; Rinaldi et al, 2007). The transcription factors c-myc (8q24) and E2F3 induce the expression of the miR-17-92 cluster. These observations are consistent with a complex regulatory network where apoptotic and proliferative signals of c-myc and E2F1 are tightly balanced by the expression of the miR-17-92 cluster (O'Donnell et al, 2005; Sylvestre et al, 2007; Woods et al, 2007).
Colorectal cancer (CRC) is a heterogeneous disease, which develops through the accumulation of multiple (epi)genetic alterations. Accepted models of CRC progression describe mutations in the Wnt pathway as an initiation event that leads to adenoma formation (Fearon and Vogelstein, 1990). A key step in subsequent progression to cancer is genomic instability, that occurs in about 5% of adenomas, either through failing DNA mismatch repair (ca. 0.5%, corresponding to 15% of all sporadic CRCs) giving rise to the mutator phenotype marked by microsatellite instability (MSI), or (ca. 4.5%, corresponding to 85% of all sporadic CRCs) (increased levels of) chromosomal instability (CIN). The latter gives rise to aneuploid tumours showing a non-random pattern of chromosomal alterations frequently, including 8q, 13q and 20q gains and 8p, 15q, 17p and 18q losses (Hermsen et al, 2002). Several studies have shown gene dosage effects on mRNA expression of genes in these gained or lost chromosomal areas (Platzer et al, 2002). Given the gains of 13q, which includes the miR-17-92 cluster, and gain of 8q, including frequent c-myc amplification, led us to test the hypothesis that gene dosage effects of the miR-17-92 cluster are associated with colorectal adenoma to adenocarcinoma progression. Our results indicated that miR-17-92 increased expression during colorectal adenoma to adenocarcinoma progression is associated to miR-17-92 locus gain and c-myc transcriptional activity.
Materials and methods
Patients and tumour tissues
Fresh tissue samples from 55 patients with colorectal tumours (30 adenomas and 25 adenocarcinomas) were collected prospectively at the department of pathology of the VU – University medical center Amsterdam (VUmc) – Amsterdam, the Netherlands. In addition, normal colorectal epithelium was obtained by brushing the normal mucosa of colon resection margins of 10 individuals (mean age 68 years) who underwent a colon resection. All 10 colon resection margins were located at least 10 cm from the tumour and histologically classified as cancer-free. Clinicopathological characteristics are listed in Table 1. Array comparative genomic hybridisation (aCGH) data collected using BAC arrays printed in house, containing ∼5000 DNA clones with an average resolution along the whole genome of 1.0 Mb, including contig coverage of 13q, (http://www.vumc.nl/microarrays/index.html) were available from the same sample of 48 patients with colorectal tumours (GEO accession number GSE8067). Of these same samples, total RNA was isolated using TRIzol (Invitrogen, Carlsbad, CA, USA) following the manufacturer's guidelines with some modifications (http://www.vumc.nl/microarrays/index.html). Total RNA quantity was determined with a Nanodrop ND-1000 spectrophotometer (Isogen, Hackensack, NJ, USA) and quality was assessed in a 1% agarose gel, stained with ethidium bromide. The study was carried out in accordance with the ethical guidelines of the VU Medical Center of Amsterdam, concerning the use of leftover patient material.
Quantitative RT–PCR and real-time TaqMan PCR
Quantification of c-myc mRNA expression levels was carried out by real-time RT–PCR using SYBR Green (Applied Biosystems, Foster City, CA, USA). First, 2 μg of total RNA were incubated at 37°C with 2 μl of DNase I (1000 U) (Invitrogen), 1 μl of 10 × buffer and 0.5 μl of Rnasin (2.500 U; Promega, Madison, WI, USA) in a final volume of 10 μl. After 30′, the reaction was stopped by adding 1 μl of DNAse stop solution and incubating at 65°C for 10′. Second, RT reactions were conducted using 1 μg of DNAse-treated total RNA as starting material, which was incubated for 10′ at 70°C with 1 μl of oligo(dT)20 Primer (Invitrogen) in a final volume of 6 μl. Next, cDNA synthesis was completed by adding 0.25 μl of Superscript II reverse transcriptase (300 U; Invitrogen), 2 μl of 10 × RT-buffer, 10 μl of dNTPs (2 mM), 2 μl DTT (10 mM) and 0.25 μl of RNasin (2500 U) in a final volume of 21 μl, during 60′ at 42°C and at 95°C for 5′. Complementary DNA was diluted with DEPC-treated water in a final volume of 100 μl and stored at −20°C until used. Last, RT–PCR was carried out using primers directed to c-myc (Fwd: 5′ CAG CTG CTT AGA CGC TGG ATT 3′, Rev: 5′ GTA GAA ATA CGG CTG CAC CGA 3′ with an annealing temperature (Ta) of 60°C) and the housekeeping gene β2M (Fwd: 5′ TGA CTT TGT CAC AGC CCA AGA TA 3′ and Rev: 5′ AAT GCG GCA TCT TCA AAC CT 3′ with a Ta of 57°C). For each reaction, 25 ng of cDNA was used as starting material and a master mix containing 12.5 μl of SYBR Green PCR master mix (Applied Biosystems) and 1.25 μl of each of the primers sets until a final volume of 25 μl. Reactions were conducted in duplo in a 7300 Real-time PCR System (Applied Biosystems). Amplification conditions comprised a denaturation step 10′ at 95°C and 50 cycles at 95°C for 15 ″ and gene-specific annealing temperature for 1′.
To determine the expression levels of the MiR-17-92 cluster genes, six Taqman microRNA assays (Applied Biosystems) directed to hsa-miR-17 (ABI 4373119), hsa-miR-18a (ABI 4373118), hsa-miR-19a (ABI 4373099), hsa-miR-20a (ABI 4373286), hsa-miR-19b-1 (ABI 4373098), hsa-miR-92a-1 (ABI 4373013) and an endogenous reference, the RNU48 gene (ABI 4373383), were used following the manufacture's protocol using 10 ng of total RNA as input material. All reactions were carried out in duplo in a 7300 Real-time PCR System (Applied Biosystems).
Statistical analysis
The expression levels of c-myc and the miR-17-92 cluster were calculated from the obtained Ct values using the Δ Ct method as described previously (Livak and Schmittgen, 2001). Box and scatter plots were used to appreciate the descriptive statistics of the data. Correlation coefficients between the expression levels of the miR-17-92 cluster genes were obtained by Spearman correlation (SPSS 14.0 for Windows, SPSS Inc., Chicago, IL, USA). Significance of differences in expression levels between tumours with and without miR-17-92 locus gain was computed by the Mann–Whitney U non-parametric test for independent samples (SPSS 14.0 for Windows). A multivariate analysis of the association of the expression of the miR-17-92 cluster with miR-17-92 locus gain, accounting for correlation between the six miRs in the cluster, was carried out using a linear mixed effect model in combination with an ANOVA F-test (‘nlme’ library R, http://cran.r-project.org/). Unsupervised cluster analysis was carried out using the parameters complete linkage and Euclidean distance (R software version 2.6.1). The Pearson χ2-test was used for analysing associations between cluster membership and presence or absences of miR-17-92 locus DNA copy number aberrations (SPSS 14.0 for Windows).
Results
The MiR-17-92 cluster is overexpressed during colorectal adenoma to adenocarcinoma progression
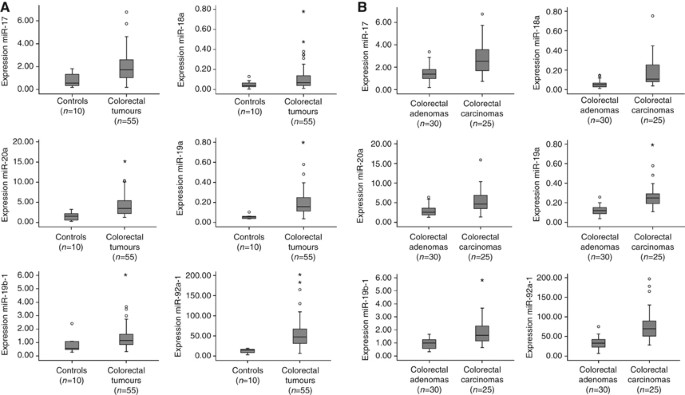
To reveal the role of the miR-17-92 cluster in CRC pathogenesis, the expression levels of the six members of this cluster (miR-17, miR-18a, miR-19a, miR-20a, miR-19b-1 and miR-92a-1) were determined by real-time RT–PCR in 55 colorectal tumours (30 adenomas and 25 adenocarcinomas) and 10 controls (normal colorectal epithelium). The expression levels of miR-17 showed 2.6-fold increase in CRC tumours compared with controls (P=0.001), as well as for miR-18a, which displayed 2.4-fold increase (P=0.04), miR-19a with 3.4-fold increase (P<0.001), miR-20a with 2.6 elevated expression (P=0.001), miR-19b-1 with 1.6-fold changes (P=0.021) and miR-92a-1 with 4.5 increased expression (P<0.001; Figure 1A).
Expression levels of miR-17-92 cluster in 55 colorectal tumours (30 colorectal adenomas and 25 adenocarcinomas) and 10 controls. (A) Box plots with median, 25th and 75th percentiles and range of expression levels of each of the six components of the miR-17-92 cluster in 10 normal colon epithelium samples and 55 colorectal tumours showed significantly increased expression in colorectal tumours compared with the controls. (B) Box plots with median, 25th and 75th percentiles and range of expression levels of each of the six components of the miR-17-92 cluster in 30 colorectal adenomas and 25 adenocarcinomas showed significantly increased expression in colorectal adenocarcinomas compared with the adenomas.
Next, to study whether these miRNAs play a role during colorectal adenoma to adenocarcinoma progression, we also analysed differences in expression between adenomas and adenocarcinomas. Indeed, all six miRNAs showed higher expression in adenocarcinomas than in adenomas, with miR-17 expression being 1.9-fold (P<0.001) increased, miR-18a 3.4-fold (P<0.001), miR-19a, 2.3-fold (P<0.001), miR-20a, 2.0-fold (P<0.001), miR-19b-1, 2.0-fold (P<0.001) and miR-92a-1, 2.4-fold increased (P<0.001) (Figure 1B). These observations indicate a role of miRNAs during colorectal adenoma to adenocarcinoma progression.
Overexpression of MiRNA cluster 17-92 members is significantly associated with DNA copy number gain of the miR-17-92 locus on 13q31
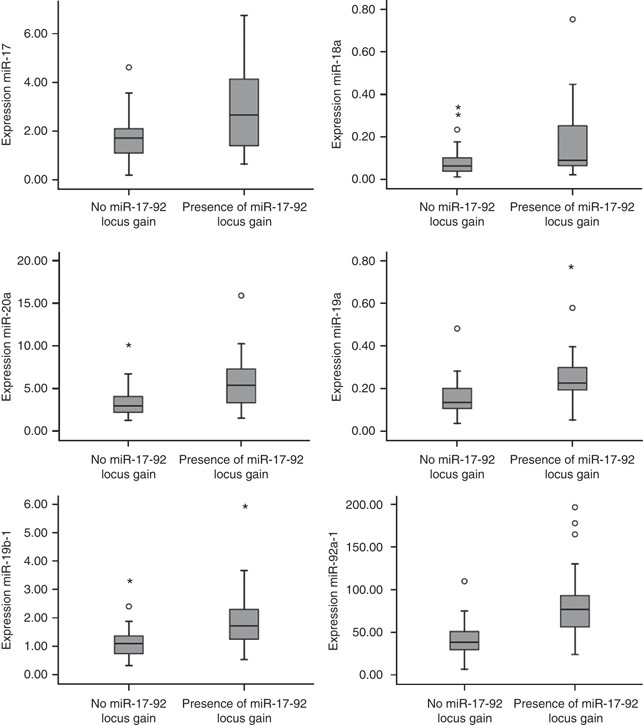
To study whether DNA copy number gain of miR-17-92 locus in colorectal tumours influences the expression of the miR-17-92 cluster, 48 of the set of 55 colorectal tumours, with aCGH data available were selected. Seventeen tumours (4 adenomas and 13 adenocarcinomas) showed 13q DNA copy number gain and 31 tumours (21 adenomas and 10 adenocarcinomas) did not show gain of the miR-17-92 locus. Comparison of the expression levels of each of the miR-17-92 cluster miRNAs between these two groups showed that expression of miR-17 was increased 1.6-fold (P=0.05) in tumours with miR17-92 locus gain compared with tumours with no miR-17-92 locus gain. In addition, miR-19a showed 1.8 times elevated expression (P<0.01), miR-20a 1.7-fold (P<0.01), miR-19b-1 1.8-fold (P<0.003) and miR-92a-1 2.0 times increased expression (P<0.003). MiR-18a showed a 2.0-fold over expression that did not reach statistical significance (P=0.29) (Figure 2). The multivariate analysis for associating expression values of the entire miR cluster with miR17-92 locus gain revealed a highly significant association (P<0.001).
Expression levels of the six miRNA-17-92 cluster members by DNA copy number status of the miR-17-92 locus in 48 colorectal tumours. Box plots with median, 25th and 75th percentiles and range of expression levels of each of the six miRNAs of the miR-17-92 cluster in 48 colorectal tumours showed significantly increased expression in colorectal tumours with miR-17-92 locus gain compared with colorectal tumours without gain of the miR-17-92 locus except miR-18a.
Unsupervised hierarchical cluster analysis of the 48 tumours with aCGH data available, revealed three clusters on the basis of the expression levels of these six miRNAs (Figure 3). Significant association between cluster membership and DNA copy number status of the six miRNAs was found (P=0.001). Cluster 1 grouped three of samples with gain of miR17-92 locus. Cluster 2 comprised only four of the samples with gain of miR17-92 locus and 24 of the samples with no miR17-92 locus gain, whereas cluster 3 contained 10 of the samples with miR17-92 locus gain and seven of the tumours with no miR17-92 locus gain (Table 2).
Hierarchical cluster analysis of 48 colorectal tumours based on miR-17-92 cluster expression levels. Unsupervised cluster analysis of the expression levels of the six members of the miR-17-92 cluster across the 48 colorectal tumour groups separate the colorectal tumours with gain of the miR-17-92 locus (clusters 1 and 3) from the tumours with no gain at this locus (cluster 2). Each column represents a colorectal tumour and each row represents the expression of each of the components of the miR-17-92 cluster. Zero (0) represent colorectal tumours with no miR-17-92 locus gain and 1 represent colorectal tumours with miR-17-92 locus gain.
In conclusion, these data indicate a gene dosage effect of miR17-92 locus amplification on expression levels of miRNA at this locus during colorectal adenoma to adenocarcinoma progression.
Expression of the miR-17-92 cluster correlates with c-myc expression in colorectal tumours
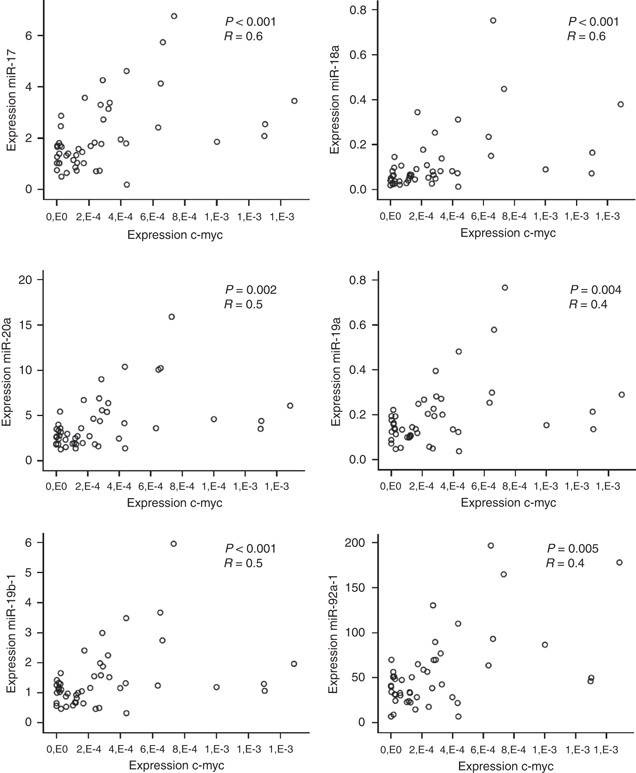
MiR-17-92 expression has also been shown to be regulated by the transcription factor c-myc, located on 8q24. Consequently, to fully investigate the mechanisms of regulation of the expression of the miR-17-92 cluster during colorectal adenoma to adenocarcinoma progression, we determined the correlation between the c-myc mRNA expression on 48 tumours with miR-17-92 expression data available. c-myc expression levels were significantly correlated to the expression of miR17-5p (r=0.6, P<0.001), miR-18a (r=0.6, P<0.001), miR-20a (r=0.5, P<0.001), miR-19a (r=0.5, P=0.002), miR-19b-1 (r=0.4, P=0.004) and miR-92a-1 (r=0.4, P<0.005) as shown in Figure 4.
The correlation between c-myc and miR-17-92 expression illustrates the transcriptional regulation of c-myc on the miR-17-92 cluster in CRC tumours.
Discussion
Onset or substantial increase in level of CIN, depending on the definition, is a major pathogenetic mechanism in colorectal adenoma to adenocarcinoma progression. Presence of 13q gain is one of the major factors associated with colorectal adenoma to adenocarcinoma progression in CIN tumours (Hermsen et al, 2002). MicroRNAs contribute to tumorigenesis as tumour suppressor genes or oncogenes due to their altered expression. An effect of DNA copy number variations implicated in human cancers on miRNAs expression has been documented previously (Calin and Croce, 2006). The region of chromosomal gain on 13q harbours the miR-17-92 cluster at locus 13q31.3. The six components of this cluster are located in the third intron of the C13orf25 gene and span nearly 800 bases. The C13orf25 gene encodes for a protein of 70 amino acids with no putative domains and unknown function, and is mainly considered to be a carrier of the miR-17-92 cluster (Mendell, 2008). Studies in lung cancer have shown that its transcripts are mainly localised in the nucleus, suggesting that translation of the mRNA into protein is limited. Functional experiments have shown that whereas transfection of the miRNAs of the miR-17-92 cluster into lung cells lead to increased proliferation, transfection of expression constructs containing C13orf25 cDNA did not lead to any phenotypic change in the same cells (Hayashita et al, 2005). Interestingly, the conservation of the exons of the C13orf25 among species is low, compared with the miR-17-92 cluster, which is conserved in all vertebrates (Mendell, 2008).
In this study, we described that DNA copy number gain of the miR-17-92 locus was associated with increased expression of all components of the miR-17-92 cluster except miR-18a. Lack of correlation in increased expression between miR-18a and the other members of the miR-17-92 cluster has been found when K562 leukaemia cells were transfected with a miR-17-19b construct (Venturini et al, 2007). In this study, the influence of DNA copy number gain of the miR-17-92 locus during CRC progression was further supported by an unsupervised cluster analysis. This analysis showed that the expression levels of the six miRNAs segregated with miR-17-92 locus gain in the colorectal tumours studied. Furthermore, the miR-17-92 cluster, located on 13q31, has previously been described as being regulated by the transcription factor c-myc, located on 8q24 (Chang et al, 2008). Indeed, a positive correlation was found between c-myc expression and expression of each of the members of the miRNA cluster in this study, indicating the influence of c-myc transcriptional activity on the miR-17-92 during CRC progression.
Expression profiling studies comparing controls with colorectal adenocarcinomas had already shown increased expression of some members of this cluster (Bandres et al, 2006; Cummins et al, 2006; Volinia et al, 2006). However, these studies used whole normal mucosa biopsies as source of RNA, including the mixture of non-epithelial cells that populate the lamina propria. In this study, we have isolated samples containing as pure a population of normal epithelial cells as possible by brushing the surface epithelium of the colorectal mucosa in resection specimens. This approach has previously been validated by making cytological specimens of these samples, and showed a high concentration of epithelial cells (Meijer et al, 1998). Therefore, our results indicate more accurately that differences in expression of the miRNA miR-17-92 cluster observed between controls and colorectal carcinomas actually reflect differences in the biology of normal and neoplastic epithelial cells. Yet, the cause of this altered expression had not been studied, nor was their role in colorectal adenoma to adenocarcinoma progression. Functional studies on B-cell lymphomas and mouse colonocytes have shown that overexpression of miR-17-92 on an elevated c-myc background, promotes tumour growth by targeting E2F1 and increased angiogenesis by targeting thrombospondin-1 (TSP1) and connective tissue growth factor (CTGF; He et al, 2005; O'Donnell et al, 2005; Dews et al, 2006). Other experimentally validated target genes of some of the components of the miR-17-92 cluster include the cyclin-dependednt kinase inhibitor (CDKN1A) and the BCL2-like 11 gene (BCL2L11) (Ivanovska et al, 2008; Koralov et al, 2008; Petrocca et al, 2008; Ventura et al, 2008; Xiao et al, 2008). These genes control cell cycle progression and cell death, respectively; however their participation in CRC tumorigenesis as targets of the miR-17-92 has not been studied. Although the exact mechanisms, that is, the down stream targets, through which the miR-17-92 miRNAs contribute to colorectal adenoma progression have not been identified yet, it is tempting to speculate on the possibility of using antagomiRs to interfere with colorectal adenoma to carcinoma progression (Krutzfeldt et al, 2005).
The present data strongly suggest that the increase in CIN that makes colorectal adenomas progress to adenocarcinomas not only leads to upregulation of oncogenes but also causes the overexpresssion of critical miRNAs.
Accession codes
Change history
16 November 2011
This paper was modified 12 months after initial publication to switch to Creative Commons licence terms, as noted at publication
References
Bandres E, Cubedo E, Agirre X, Malumbres R, Zarate R, Ramirez N, Abajo A, Navarro A, Moreno I, Monzo M, Garcia-Foncillas J (2006) Identification by Real-time PCR of 13 mature microRNAs differentially expressed in colorectal cancer and non-tumoral tissues. Mol Cancer 5: 29
Bartel DP (2004) MicroRNAs: genomics, biogenesis, mechanism, and function. Cell 116: 281–297
Brennecke J, Hipfner DR, Stark A, Russell RB, Cohen SM (2003) bantam encodes a developmentally regulated microRNA that controls cell proliferation and regulates the proapoptotic gene hid in Drosophila. Cell 113: 25–36
Calin GA, Croce CM (2006) MicroRNA signatures in human cancers. Nat Rev Cancer 6: 857–866
Calin GA, Dumitru CD, Shimizu M, Bichi R, Zupo S, Noch E, Aldler H, Rattan S, Keating M, Rai K, Rassenti L, Kipps T, Negrini M, Bullrich F, Croce CM (2002) Frequent deletions and down-regulation of micro- RNA genes miR15 and miR16 at 13q14 in chronic lymphocytic leukemia. Proc Natl Acad Sci USA 99: 15524–15529
Calin GA, Sevignani C, Dumitru CD, Hyslop T, Noch E, Yendamuri S, Shimizu M, Rattan S, Bullrich F, Negrini M, Croce CM (2004) Human microRNA genes are frequently located at fragile sites and genomic regions involved in cancers. Proc Natl Acad Sci USA 101: 2999–3004
Chang TC, Yu D, Lee YS, Wentzel EA, Arking DE, West KM, Dang CV, Thomas-Tikhonenko A, Mendell JT (2008) Widespread microRNA repression by Myc contributes to tumorigenesis. Nat Genet 40: 43–50
Chen CZ, Li L, Lodish HF, Bartel DP (2004) MicroRNAs modulate hematopoietic lineage differentiation. Science 303: 83–86
Cummins JM, He Y, Leary RJ, Pagliarini R, Diaz Jr LA, Sjoblom T, Barad O, Bentwich Z, Szafranska AE, Labourier E, Raymond CK, Roberts BS, Juhl H, Kinzler KW, Vogelstein B, Velculescu VE (2006) The colorectal microRNAome. Proc Natl Acad Sci USA 103: 3687–3692
Dews M, Homayouni A, Yu D, Murphy D, Sevignani C, Wentzel E, Furth EE, Lee WM, Enders GH, Mendell JT, Thomas-Tikhonenko A (2006) Augmentation of tumor angiogenesis by a Myc-activated microRNA cluster. Nat Genet 38: 1060–1065
Esquela-Kerscher A, Slack FJ (2006) Oncomirs – microRNAs with a role in cancer. Nat Rev Cancer 6: 259–269
Fearon ER, Vogelstein B (1990) A genetic model for colorectal tumorigenesis. Cell 61: 759–767
Hayashita Y, Osada H, Tatematsu Y, Yamada H, Yanagisawa K, Tomida S, Yatabe Y, Kawahara K, Sekido Y, Takahashi T (2005) A polycistronic microRNA cluster, miR-17-92, is overexpressed in human lung cancers and enhances cell proliferation. Cancer Res 65: 9628–9632
He L, Thomson JM, Hemann MT, Hernando-Monge E, Mu D, Goodson S, Powers S, Cordon-Cardo C, Lowe SW, Hannon GJ, Hammond SM (2005) A microRNA polycistron as a potential human oncogene. Nature 435: 828–833
Hermsen M, Postma C, Baak J, Weiss M, Rapallo A, Sciutto A, Roemen G, Arends JW, Williams R, Giaretti W, De Goeij A, Meijer G (2002) Colorectal adenoma to carcinoma progression follows multiple pathways of chromosomal instability. Gastroenterology 123: 1109–1119
Ivanovska I, Ball AS, Diaz RL, Magnus JF, Kibukawa M, Schelter JM, Kobayashi SV, Lim L, Burchard J, Jackson AL, Linsley PS, Cleary MA (2008) MicroRNAs in the miR-106b family regulate p21/CDKN1A and promote cell cycle progression. Mol Cell Biol 28: 2167–2174
Johnson SM, Grosshans H, Shingara J, Byrom M, Jarvis R, Cheng A, Labourier E, Reinert KL, Brown D, Slack FJ (2005) RAS is regulated by the let-7 microRNA family. Cell 120: 635–647
Koralov SB, Muljo SA, Galler GR, Krek A, Chakraborty T, Kanellopoulou C, Jensen K, Cobb BS, Merkenschlager M, Rajewsky N, Rajewsky K (2008) Dicer ablation affects antibody diversity and cell survival in the B lymphocyte lineage. Cell 132: 860–874
Krutzfeldt J, Rajewsky N, Braich R, Rajeev KG, Tuschl T, Manoharan M, Stoffel M (2005) Silencing of microRNAs in vivo with ‘antagomirs’. Nature 438: 685–689
Lee RC, Feinbaum RL, Ambros V (1993) The C. elegans heterochronic gene lin-4 encodes small RNAs with antisense complementarity to lin-14. Cell 75: 843–854
Livak KJ, Schmittgen TD (2001) Analysis of relative gene expression data using real-time quantitative PCR and the 2(-Delta Delta C(T)) Method. Methods 25: 402–408
Lu J, Getz G, Miska EA, Alvarez-Saavedra E, Lamb J, Peck D, Sweet-Cordero A, Ebert BL, Mak RH, Ferrando AA, Downing JR, Jacks T, Horvitz HR, Golub TR (2005) MicroRNA expression profiles classify human cancers. Nature 435: 834–838
Lujambio A, Ropero S, Ballestar E, Fraga MF, Cerrato C, Setien F, Casado S, Suarez-Gauthier A, Sanchez-Cespedes M, Git A, Spiteri I, Das PP, Caldas C, Miska E, Esteller M (2007) Genetic unmasking of an epigenetically silenced microRNA in human cancer cells. Cancer Res 67: 1424–1429
Meijer GA, Hermsen MA, Baak JP, van Diest PJ, Meuwissen SG, Belien JA, Hoovers JM, Joenje H, Snijders PJ, Walboomers JM (1998) Progression from colorectal adenoma to carcinoma is associated with non-random chromosomal gains as detected by comparative genomic hybridisation. J Clin Pathol 51: 901–909
Mendell JT (2008) miRiad roles for the miR-17-92 cluster in development and disease. Cell 133: 217–222
O'Donnell KA, Wentzel EA, Zeller KI, Dang CV, Mendell JT (2005) c-Myc-regulated microRNAs modulate E2F1 expression. Nature 435: 839–843
Petrocca F, Visone R, Onelli MR, Shah MH, Nicoloso MS, de Martino I, Iliopoulos D, Pilozzi E, Liu CG, Negrini M, Cavazzini L, Volinia S, Alder H, Ruco LP, Baldassarre G, Croce CM, Vecchione A (2008) E2F1-regulated microRNAs impair TGFbeta-dependent cell-cycle arrest and apoptosis in gastric cancer. Cancer Cell 13: 272–286
Platzer P, Upender MB, Wilson K, Willis J, Lutterbaugh J, Nosrati A, Willson JK, Mack D, Ried T, Markowitz S (2002) Silence of chromosomal amplifications in colon cancer. Cancer Res 62: 1134–1138
Reinhart BJ, Slack FJ, Basson M, Pasquinelli AE, Bettinger JC, Rougvie AE, Horvitz HR, Ruvkun G (2000) The 21-nucleotide let-7 RNA regulates developmental timing in Caenorhabditis elegans. Nature 403: 901–906
Rinaldi A, Poretti G, Kwee I, Zucca E, Catapano CV, Tibiletti MG, Bertoni F (2007) Concomitant MYC and microRNA cluster miR-17-92 (C13orf25) amplification in human mantle cell lymphoma. Leuk Lymphoma 48: 410–412
Saito Y, Liang G, Egger G, Friedman JM, Chuang JC, Coetzee GA, Jones PA (2006) Specific activation of microRNA-127 with downregulation of the proto-oncogene BCL6 by chromatin-modifying drugs in human cancer cells. Cancer Cell 9: 435–443
Sylvestre Y, De Guire V, Querido E, Mukhopadhyay UK, Bourdeau V, Major F, Ferbeyre G, Chartrand P (2007) An E2F/miR-20a autoregulatory feedback loop. J Biol Chem 282: 2135–2143
Tagawa H, Karube K, Tsuzuki S, Ohshima K, Seto M (2007) Synergistic action of the microRNA-17 polycistron and Myc in aggressive cancer development. Cancer Sci 98: 1482–1490
Ventura A, Young AG, Winslow MM, Lintault L, Meissner A, Erkeland SJ, Newman J, Bronson RT, Crowley D, Stone JR, Jaenisch R, Sharp PA, Jacks T (2008) Targeted deletion reveals essential and overlapping functions of the miR-17 through 92 family of miRNA clusters. Cell 132: 875–886
Venturini L, Battmer K, Castoldi M, Schultheis B, Hochhaus A, Muckenthaler MU, Ganser A, Eder M, Scherr M (2007) Expression of the miR-17-92 polycistron in chronic myeloid leukemia (CML) CD34+ cells. Blood 109: 4399–4405
Volinia S, Calin GA, Liu CG, Ambs S, Cimmino A, Petrocca F, Visone R, Iorio M, Roldo C, Ferracin M, Prueitt RL, Yanaihara N, Lanza G, Scarpa A, Vecchione A, Negrini M, Harris CC, Croce CM (2006) A microRNA expression signature of human solid tumors defines cancer gene targets. Proc Natl Acad Sci USA 103: 2257–2261
Wightman B, Ha I, Ruvkun G (1993) Posttranscriptional regulation of the heterochronic gene lin-14 by lin-4 mediates temporal pattern formation in C. elegans. Cell 75: 855–862
Woods K, Thomson JM, Hammond SM (2007) Direct regulation of an oncogenic micro-RNA cluster by E2F transcription factors. J Biol Chem 282: 2130–2134
Xiao C, Srinivasan L, Calado DP, Patterson HC, Zhang B, Wang J, Henderson JM, Kutok JL, Rajewsky K (2008) Lymphoproliferative disease and autoimmunity in mice with increased miR-17-92 expression in lymphocytes. Nat Immunol 9: 405–414
Zhang L, Huang J, Yang N, Greshock J, Megraw MS, Giannakakis A, Liang S, Naylor TL, Barchetti A, Ward MR, Yao G, Medina A, O'Brien-Jenkins A, Katsaros D, Hatzigeorgiou A, Gimotty PA, Weber BL, Coukos G (2006) microRNAs exhibit high frequency genomic alterations in human cancer. Proc Natl Acad Sci USA 103: 9136–9141
Zhao Y, Ransom JF, Li A, Vedantham V, von Drehle M, Muth AN, Tsuchihashi T, McManus MT, Schwartz RJ, Srivastava D (2007) Dysregulation of cardiogenesis, cardiac conduction, and cell cycle in mice lacking miRNA-1-2. Cell 129: 303–317
Acknowledgements
We thank the members of the department of pathology of the VU University Medical Center Amsterdam who participated in fruitful discussions. This study was supported by a grant from the Netherlands Organization for Medical and Health Research (ZonMW, Grant number 6120.0022).
Author information
Authors and Affiliations
Corresponding author
Rights and permissions
From twelve months after its original publication, this work is licensed under the Creative Commons Attribution-NonCommercial-Share Alike 3.0 Unported License. To view a copy of this license, visit http://creativecommons.org/licenses/by-nc-sa/3.0/
About this article
Cite this article
Diosdado, B., van de Wiel, M., Terhaar Sive Droste, J. et al. MiR-17-92 cluster is associated with 13q gain and c-myc expression during colorectal adenoma to adenocarcinoma progression. Br J Cancer 101, 707–714 (2009). https://doi.org/10.1038/sj.bjc.6605037
Received:
Revised:
Accepted:
Published:
Issue Date:
DOI: https://doi.org/10.1038/sj.bjc.6605037
Keywords
This article is cited by
-
Investigation of the role of the miR17-92 cluster in BMP9-induced osteoblast lineage commitment
Journal of Orthopaedic Surgery and Research (2021)
-
Small molecules with huge impacts: the role of miRNA-regulated PI3K pathway in human malignancies
Molecular Biology Reports (2021)
-
Focused screening reveals functional effects of microRNAs differentially expressed in colorectal cancer
BMC Cancer (2019)
-
Impact of the gut microbiome on the genome and epigenome of colon epithelial cells: contributions to colorectal cancer development
Genome Medicine (2019)
-
miR-19a promotes colorectal cancer proliferation and migration by targeting TIA1
Molecular Cancer (2017)

