
Abstract
Acupuncture has been indispensable in Chinese medicine. However, its function still remains elusive. This paper studies the effect of acupuncture in ischemia stroke treatment using the Sprague Dawley rat animal model. We induced focal cerebral ischemia in rats using the middle cerebral artery occlusion (MCAO) procedure. For each rat in the real acupuncture group (n = 63), the sham acupoint treatment group (n = 62) and the blank control group (n = 30), we acquired 3-D fluorodeoxyglucose-microPET images at baseline, after MCAO and after treatment, respectively. Then, we measured the changes of the injury-volume in the right hemisphere of these rats. The measurements showed that real acupuncture slightly reduced the injury-volume, sham acupoint treatment increased the injury-volume and blank control had no obvious effect in reducing the injury-volume. Statistical tests also confirmed that acupuncture was more effective than random stimulus in improving the metabolic recovery after stroke.
Introduction
Acupuncture was developed based on the trial-and-error results of ancient Chinese medicine practitioners. It has survived the competition from a variety of alternative techniques throughout history and is one of the major components of traditional Chinese medicine. However, its mechanism largely remains elusive. The existence of the meridian channel (acupuncture is based on the meridian channel concept) is still under debate.
With advances in modern imaging techniques, more and more studies have been carried out to understand the effect of acupuncture in a quantitative manner. These imaging modalities include computed tomography24, magnetic resonance imaging (MRI)15, functional MRI (fMRI)3 and positron emission tomography (PET)11. The subjects in these studies include rats13,19, dogs21 and human patients9,12. Different experimental set-ups have been used, including combinations of acupoints, time duration, types of acupuncture (e.g., manual acupuncture and electroacupuncture) and repeat patterns of acupuncture. Many interesting findings have been reported. Witt et al.25 reported a positive effect of acupuncture in patients with knee osteoarthritis based on the Western Ontario and McMaster Universities Osteoarthritis (WOMAC) index from around 300 questionnaires completed by patients. However, there are also controversial results6,17,22. Cho et al.3 reported a correlation between acupoints and brain cortices using an fMRI-based approach in 1998. But they retracted their paper in 2006, because they were unable to confirm the original findings in their follow-up studies.
According to our observation, indirect observations and involvements with irrelevant pathological conditions make the analysis and interpretation of experimental results very difficult. To quantitatively understand the role of acupuncture, we need to have a statistically significant, biologically interpretable and quantitatively repeatable measurement under the randomized trial setting. Here we decided to use the Sprague Dawley rat animal model to study the acupuncture effect in ischemia stroke treatment. We chose the fluorodeoxyglucose (FDG) based microPET imaging technique18 to measure the glucose level in the brain14, which is an important index of brain function4,20. We made these choices based on the following considerations:
-
Rats have much a smaller diversity than human subjects. Consequently, using rats makes it easier to avoid complications in pathology than using human subjects.
-
Both fMRI and PET (including microPET) are popular modalities for functional imaging. However, it is difficult to follow the block design in fMRI for animal tests. In addition, microPET directly provides a quantitative measurement related to metabolism. Thus, we decided to use microPET in our experiments. To overcome the limited resolution of microPET, we also used the MRI and triphenyl tetrazolium cchloride (TTC)-staining to help identify the brain area injured after ischemia stroke.
We also simplified the comparison as much as possible. Many studies have considered the accumulative effect of acupuncture using experiments lasted for several weeks or even up to one year. This makes perfect sense clinically since acupuncture is supposed to be a long-term treatment, but factors such as pathological complications and changes in experimental conditions definitely make the analysis of experimental results challenging. One obvious problem is that sample sizes are not large enough to draw statistically significant conclusions for complicated experiments. Thus, we decided to study only the immediate effect of acupuncture.
Results
We used adult female Sprague-Dawley rats in our experiment. All rats were randomly divided into three groups:
-
1
Real acupuncture (RA) group. We used the combination of Baihui (GV 20) and Shuigou (GV 26) as target acupoints in this group10,16. These two acupoints were shown as red dots in Figure 1.
Figure 1 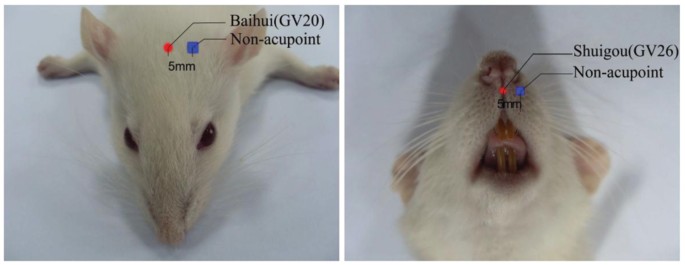
Locations of Baihui (GV20) acupoint (left image, the red dot on the head) and Shuigou (GV26) acupoint (right image, the red dot below the nose).
Two non-acupoints with a distance of 5 mm to acupoints were chosen for sham acupoint treatment (marked as blue squares).
-
2
Sham acupoint (SA) treatment group. We used two non-acupoint locations (5 mm next to Baihui and Shuigou, shown as blue squares in Figure 1) as the target points for needling treatment. These two points are very close to two other acupoints. We discuss more about this in the Discussion section.
-
3
Blank control (BC) group. We imaged the rats in this group without any acupuncture or sham acupoint treatment.

Figure 2 illustrates the experiment flow chart with the following details:
-
1
Baseline FDG-microPET Scanning. For each rat in the study, we acquired 3-D FDG-microPET images with an microPET R4 system (CTI Concorde Microsystems, LLC.) at the Medical PET Center of Zhejiang University. After that, we waited for at least six hours to let the FDG attenuate for more than three half lives.
-
2
Animal Modeling. We induced the focal cerebral ischemia by carrying out the commonly-used MCAO procedure1 with craniotomy and electrocoagulation23.
-
3
Resting and MicroPET Scanning. Right after the MCAO step, we injected FDG again. Then, we followed the same procedure of resting for 30 minutes and scanning for 15 minutes as described in step 1. To assure synchronization, we moved to step 4 at the one hour time-point after the second FDG injection.
-
4
Real Acupuncture, Sham Acupoint Treatment and Blank Control.
-
For each rat in the RA group, we carried out real acupuncture for 30 minutes, following the common guideline of clinical practice. Then we removed the needles and carried out the third microPET scanning.
-
For each rat in the SA group, we carried out sham acupoint treatment for 30 minutes. Then we removed the needles and carried out the third microPET scanning. The needle manipulation followed the same pattern as that in the RA group.
-
For each rat in the BC group, we kept it in its home cage under the resting state for 30 minutes and then carried out the third microPET scanning.
-

The flow chart of the experiment.
The image data were acquired three times for each rat: baseline scanning I1; scanning right after MCAO I2; and scanning after real acupuncture/sham acupoint treatment/resting (for RA/SA/BC group) I3.
In the above procedure, we ignored the timing effect (or natural recovery effect) by scanning the rats in the acute stroke stage. Also, we chose the simplest combination of Baihui and Shuigou to avoid over-complication in acupoint combination. The pros and cons of this design will be discussed in more detail in the Discussion section.
Furthermore, one may suspect that the electric current effect in electroacupuncture is more dominant than the acupuncture effect. Our design bypassed this issue by only using manual acupuncture and following the common pattern used in clinical practice. To avoid human bias and individual variation, a single well-trained acupuncturist did all the acupuncture throughout the entire study.
After microPET scanning, 3-D microPET images were reconstructed using a maximum a posteriori (MAP) algorithm14. Figure 3 shows one example of the rat brain after MCAO modeling. The injury-caused glucose decrease is visible in the frontal lobe (upper-right area) of the brain.

FDG-microPET image examples of representative coronal sections.
The right hemisphere of the rat brain (shown as right-hand side in each figure) is the area where the ischemia injury occurs. Top to bottom: RA group example (ID 0001) , SA group example (ID 0011) and BC group example (ID 0009). Left to right: Baseline scan, post-MCAO scan and final scan. Full volume images of these examples and other images are available at http://bioinformatics.ust.hk/acupuncture.htm. Here, the activity images are reconstructed by using the MAP algorithm14. Note that different images have different ranges of intensity values. This is unavoidable since we have different FDG-concentrations in different rats during micro-PET imaging due to the fact that FDG-reagent must be produced on a daily basis and be used at different time points. This variation vividly explains the reason (in addition to individual difference among different rats) that we used a relative index instead of absolute intensity values in our comparison.
In order to verify the location of injured area in the brain induced by MCAO, we carried out two other morphological measurements: MRI and TTC-staining2. We acquired MRI images and diffusion weighted MRI images for 17 model rats about 12 hours after MCAO and did TTC-staining for 14 model rats about 24 hours after MCAO. One MRI example and one TTC example are shown in Figure 4 and Figure 5, respectively. Please note that they are not from the same rat. Images of all rats are available at http://bioinformatics.ust.hk/acupuncture.htm.

One selected slice with the coronal view of the MRI image (left) and that of the corresponding diffusion weighted MRI image (right) from the rat with ID PA9.
The red rectangle in the image indicates the injured cerebral area.

The TTC stained brain from the rat with ID SDC10226.
Top to Bottom: The coronal sections from rostral to caudal. The injury part is visible in the third and fourth section.
These morphological measurements confirmed that the injured area was indeed in the right hemisphere of the cerebral cortex and the basal ganglia, as previously reported in the study by Engelhorn et al7. Moreover, the TTC-staining indicated that the injured area had a thickness of about 4 mm. The above confirmation and observation largely simplified our analysis of images as we could ignore irrelevant regions in the brain.
For quantitative evaluation of acupuncture effect, we compared the changes of the injury-volume in the real acupuncture treatment group, the sham acupoint treatment group and the blank control group. We defined the injury-volume Vi as:

IiR denotes the voxel intensity in the right hemisphere,  denotes the average image intensity in the left hemisphere and i denotes the PET scanning index (i = 2 or 3). We considered a voxel in the right hemisphere as part of the injury-volume if its
  with T denoting a percentage-based threshold.
The threshold parameter T is critical in determining the injury-volume. To avoid ad hoc parameter setting, we changed T from 70% to 120% and test all results accordingly. In this paper, we used the following index to measure the injury-volume change for each rat:

with V2 and V3 denoting the injury-volume in the second and the third microPET image, respectively.
Figure 6 plots the average RI values at different T settings:
-
When T > 100%, the average RI of three groups converged to zero, indicating that no significant difference will be observed if we relax the injury criterion.
-
When 80% ≤ T ≤ 100%, real acupuncture has a more positive effect than sham acupuncture and blank control in reducing the injury-volume. Most RI values in the RA group are consistently higher than those in the BC group. But the differences are statistically insignificant, as shown in Figure 7. This is probably due to the fact that acupuncture is a long-term therapy, while we only had one acupuncture treatment in the experiments. Importantly, the contrast between the RA group and the SA group clearly illustrates that acupuncture is significantly better than random stimulus. It was also worth mentioning that sham acupuncture increases the injury-volume, which is even worse than blank control. This observation suggests that random stimulus may have a strong negative effect in treating ischemic stroke. We must carry out acupuncture treatment carefully lest acupuncture becomes random stimulus.
Figure 7 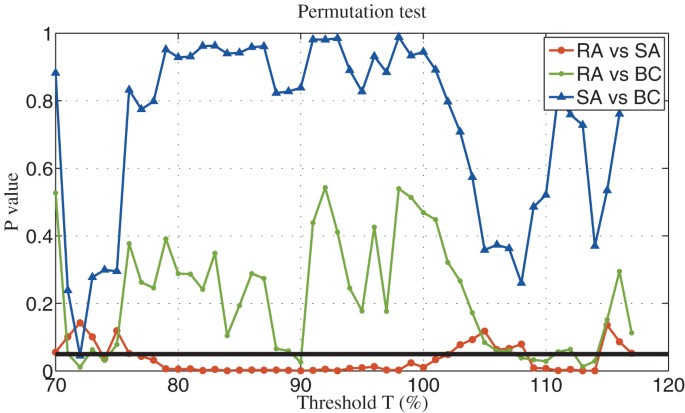
The one-sided P-values of permutation tests.
The black horizontal line corresponds to P = 0.05. Please note that these permutation tests are independent of each other. Thus, no P-value correction for multiple comparison is needed.
-
When T ≤ 75%, the curves changed dramatically. This artifact is caused by the limited number of remaining voxels when we tighten the injury criterion. Figure 8 plots the average percentage of remaining voxels at different thresholds. It shows that only less than 5% of voxels remain when T ≤ 75%. Thus, we discarded this part in our analysis. The original data file “InjuryVolume.xls” is available at http://bioinformatics.ust.hk/acupuncture.htm.
Figure 8 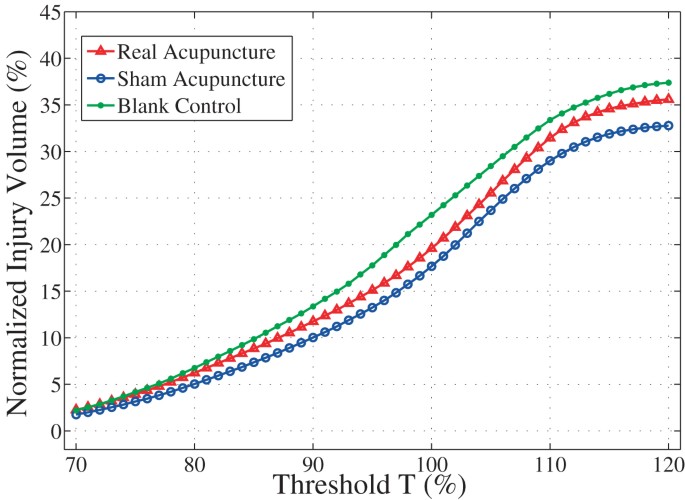
The average percentage of remaining voxels at different threshold values for each group.
When T ≤ 75%, less than 5% of voxels remain, causing artifacts in the RI value calculation and the statistic tests.


The average RI changes at different threshold T values for each group.
For T > 100%, the average RI values of three groups converge to zero, showing that no significant difference will be observed if we relax the injury criterion. For 80% ≤ T ≤ 100%, the RA group has positive RI values, the SA group has negative RI values and the BC group has RI values close to zero. For T ≤ 75%, the curves change dramatically since only a very limited number of voxels remain when we tighten the injury criterion. We discard this part in our analysis.
To verify if the differences in mean values are statistically significant, we also carried out the permutation test. The one-sided P-values of permutation tests are shown in Figure 7. The plot clearly shows that real acupuncture has a statistically significant positive effect in reducing the injury-volume in comparison to sham acupuncture for 80% ≤ T ≤ 100%. The comparison between real acupuncture and blank control suggests a small positive effect, but not at a level that enables us to reject the null hypothesis that there is no difference between real acupuncture and blank control. Besides, the effect is more sensitive to the T value. Clearly, determining the optimal working condition of real acupuncture is a challenging topic that needs to be studied in the future.
Discussion
As the glucose level is a quantitative measure of brain function, these experiments demonstrate the positive correlation between our measurements and TCM predictions. In this sense, our experiments have achieved the goal of positive verification. It remains unclear, however, how the acupuncture stimulates the increase of glucose. One guess is that the neural system reacts to acupuncture more actively and regulates the glucose metabolism. More carefully designed studies are needed to further study this issue. For example, we also need to study the effect of acupuncture on brain glucose consumption in resting rats (i.e. without MCAO modeling). This could enable us to understand the effect of acupuncture further.
In this study, we carried out the second and third microPET scan after the same FDG injection. One may wonder if there is still sufficient FDG at the one hour time point after the FDG injection. Since the radioactive label 18F has a half-life of 110 minutes, the FDG concentration in brain tissues is still sufficient for imaging cerebral metabolism. A similar observation was reported in Dandekar et al.'s study5, in which a statistically significant increase of FDG (P = 0.04) in tumor was reported even after five hours of the FDG injection.
To verify this, we applied linear regression to images in the BC group to determine similarity of glucose values in the affected hemispheres calculated from the second and third microPET scans. Figure 9 shows that the glucose levels in the right hemispheres derived from the third microPET scan were very similar to those obtained from the second microPET scan (r = 0.958, F = 310, P< 0.001). This result excludes the possibility that our results are due to noise.

Scatter plot of glucose levels in the right hemispheres calculated from the second microPET scan to those derived from the third microPET scan, illustrating relation as determined by linear regression (r2 = 0.917, F = 310, P < 0.001).
If acupuncture stimulates the brain tissue to absorb more FDG, a related question is where the extra FDG comes from. If the source is the blood vessel, is there still sufficient FDG circulating in the blood vessel for uptake at the one hour time point after the FDG injection, given that the metabolism of rat is much faster than that of human? In our study, the major blood vessel (the middle cerebral artery) to the brain has been blocked by the occlusion procedure. In fact, even the second PET scan was performed after the MCAO procedure. Thus, the major source of the extra FDG should not be the major blood vessel. One hypothesis is that the local alternative circulation system (e.g., the capillary network) is transporting FDG to the brain tissues.
In our experiments, we have chosen certain specific settings to simplify the experiments and the corresponding interpretation. Here we like to discuss about the pros and cons of our choices:
-
Acupoint combination is a complicated issue. Among different acupoints, Baihui (GV20) is the most important one in treating ischemic stroke and it is easy to locate. Considering that Shuigou is also easy to locate and the combination of Baihui and Shuigou is commonly used in clinics for patient treatment, we chose this combination in our experiments. While this choice may not be the most effective one for treating stroke, our goal here was to verify the effectiveness of acupuncture, not to find the most effective acupoint combination.
-
In the experiments, we chose the sham acupoints to be 5 mm lateral to Baihui and 5 mm lateral to Shuigou. The first sham acupoint is close to the acupoint of Sishencong (EX-HN1), which also has some effect on treating stroke according to the TCM theory. The second sham acupoint is close to the acupoint of Kouheiao (LI19). One concern is that we may use true acupoints as sham acupoints due to variations in positioning the needles, thus jeopardizing the real contrast between true acupoints and sham acupoints.
According to the rat acupoint atlas10,16, many acupoints are located in the head, making it difficult to choose sham acupoints that are far enough from some other acupoints. In our experimental design, our intention was to keep enough distance between sham acupoints and Baihui/Shuigou. We are aware of the closeness between sham acupoints and other acupoints. But it should be noted that Sishencong and Kouheiao should have weaker effect in ischemic stroke treatment according to the TCM theory. Even when we used these alternative acupoints as the sham acupoints due to experimental variation, the more positive effect of Baihui and Shuigou combination has also been verified. In this sense, our finding is still consistent with the TCM theory.
-
In our experiments, we ignored the timing effect (or natural recovery effect) of stroke. We made such a choice to carry out a well-controlled study. Consequently, we did not need to worry about other pathological complications in the chronic recovery stage after the stroke26. On the one hand, this choice significantly simplified the experimental procedure and the interpretation of experimental results. On the other hand, this choice excluded our chance of observing dynamic responses of test animals during the acute and sub-acute stages of ischemia stroke and long-term effect of acupuncture. In our future work, we plan to extend the observation window by having multiple PET scanning of the same test animal after MCAO. This extension will help us to better understand the dynamic changes of metabolic activities.
In this paper, we used the glucose level as a quantitative index to measure the brain activity. By comparing real acupuncture with sham acupoint treatment and blank control under a simplified animal experiment setting, we were able to verify that acupuncture indeed increased the glucose level in the acute stage of ischemia stroke. While this finding is still far from thoroughly verifying the effectiveness of acupuncture in stroke treatment, it shows that we can probe the consequences of acupuncture quantitatively with a target-specific imaging technique. As acupuncture and traditional Chinese medicine in general has the reputation of being mysterious, our approach provides an example of how concepts in traditional Chinese medicine can be explained with modern scientific language.
Methods
Subjects
The subjects were adult female Sprague-Dawley rats, weighing 180 ~ 280 g. All rats were housed in the animal care facility with free access to food and water before and after the experiments. The rats fasted overnight before the tracer injection. The study was approved by the Animal Research Committee of Zhejiang University, School of Medicine. The experimental procedures were carried out in accordance with the guidelines for the care and use of Laboratory Animals published by National Institutes of Health (NIH) of the United States.
Anesthetization
During the experiment, the weight of each rat was measured and each rat was anesthetized with 400 mg/kg chloral hydrate twice: once before the first microPET scanning and the other time before MCAO. The chloral hydrate was supplemented as necessary during the experiment.
FDG-microPET scanning
The microPET scanner consists of 32 detector rings with an animal aperture of 120 mm and an axial field-of-view of 78 mm. The spatial resolution at the scanner center is 1.88 mm FWHM in the axial plane, 1.9 mm FWHM in the transversal plane. Each rat was positioned in the microPET R4 scanner in transaxial position with its head in the field of view. We injected 0.5 ~ 1 mCi FDG intravenously into the tail vein of the rat and put the rat back to its home cage in a quiet room for 30 minutes for glucose uptake. Then, we performed 3-D microPET scanning for 15 minutes.
Middle cerebral artery occlusion
The zygomatic and squamosal bones in the right head were exposed by a 1.5 cm incision in the skin and the muscle over the bones was excarnated. A small hole of 2 mm in diameter was drilled in the junction part of the zygomatic and squamosal bones with a high speed hand-held drill. The right MCA was exposed by retracting the meninges with ophthalmic scissors and hemostatic forceps and then permanently occluded using bipolar electrical coagulation. Disinfected absorbent cotton was employed to fill the surgical field and the skin was closed with suture.
Acupuncture procedure
Stainless filiform needles (0.3 mm in diameter and 13.0 mm in length) were inserted into the acupuncture points for 5.0 ~ 10.0 mm deep for Baihui and for 2.0 ~ 3.0 mm deep for Shuigou, respectively. The needles were manually twisted for one minute at a frequency of about 2 Hz and then left still for four minutes. This pattern is repeated for six times (30 minutes) during the manipulation session.
Calculation of Injury-volume
In order to minimize the location variation and size variation of different rats, we aligned different rat brains together by using the software Statistical Parametric Mapping (SPM)8 with the default 12-parameter affine transformation. Since SPM was developed for human brain mapping and the rat brain size is much smaller than the human brain size, we scaled up the voxel size by a factor of eight to use the default parameter settings in SPM. Then, three continuous coronal slices in the infarcted area were selected (roughly corresponding to 4 mm in thickness) and the brain tissue was extracted using a mask generated by intensity filtering of the baseline scanning image I1.
For each rat, we used the average image intensity across three slices (reflecting the glucose level) in the left hemisphere as the reference and denoted it as  with i denoting the PET scanning index (i = 2 or 3). For a voxel in the right hemisphere, we denoted its intensity as IiR. We considered this voxel as in the injured area if
  with T denoting a percentage-based threshold. We defined the injury-volume Vi as:

Statistical analysis
In our experiments, we have done MCAO on 253 rats. After MCAO, we only considered those rats whose average glucose level (i.e., the average intensity value) in the right hemisphere was lower than that in the left hemisphere to remove imperfect cases of MCAO. After applying this criterion, only 155 rats (63 rats from the RA group, 62 rats from the SA group and 30 rats from the BC group) remained. We discarded a large number of rats because MCAO was a highly technical procedure and the consistency of MCAO was critical for us to build a relatively homogeneous animal disease model. Fortunately, this pre-screening step still kept enough number of rats for us to draw statistical conclusions.
In each group, outliers of RI were removed by using the following standard method: For all RI values in the group, we denote the lower quartile as Q1, the upper quartile as Q3 and their difference as ΔQ = Q3 − Q1. An RI value outside the interval of [Q1 − 1.5ΔQ,Q3 + 1.5ΔQ] is considered as an outlier.
References
Bederson, J. B. et al. Rat middle cerebral artery occlusion: evaluation of the model and development of a neurologic examination. Stroke 17, 472–476 (1986).
Chiamulera, C., Terron, A., Reggiani, A. & Cristofori, P. Qualitative and quantitative analysis of the progressive cerebral damage after middle cerebral artery occlusion in mice. Brain Res 606, 251–258 (1993).
Cho, Z. H. et al. New findings of the correlation between acupoints and corresponding brain cortices using functional MRI. Proc Natl Acad Sci USA 95, 2670–2673 (1998).
Chugani, H. T., Phelps, M. E. & Mazziotta, J. C. Positron emission tomography study of human brain functional development. Ann Neurol 22, 487–497 (1987).
Dandekar, M., Tseng, J. R. & Gambhir, S. S. Reproducibility of 18f-fdg micropet studies in mouse tumor xenografts. J Nucl Med 48, 602–607 (2007).
Dhond, R. P., Ketter, N. & Mapadow, V. Neuroimaging acupuncture effects in the human brain. J Altern Complement Med 13, 603–616 (2007).
Engelhorn, T. et al. Decompressive craniectomy, reperfusion, or a combination for early treatment of acute “Malignant” cerebral hemispheric stroke in rats? potential mechanisms studied by MRI. Stroke 30, 1456–1463 (1999).
Friston, K. J. et al. Statistical parametric maps in functional imaging: a general linear approach. Human Brain Mapping 2, 189–210 (1995).
Hopwood, V., Lewith, G., Prescott, P. & Campbell, M. J. Evaluating the efficacy of acupuncture in defined aspects of stroke recovery: a randomised, placebo controlled single blind study. J Neurol 255, 858–866 (2008).
Hua, X., Li, C., Zhou, H., Song, D. & Hu, Y. The determination of rat acupoint atlas. Laboratory Animal and Animal Experiment 1, 1–5 (1991).
Huang, Y., Chen, J., Htut, W. M., Lai, X. & Wik, G. Acupuncture increases cerebral glucose metabolism in human vascular dementia. Int J Neurosci 117, 1029–1037 (2007).
Johansson, B. B. et al. Acupuncture and transcutaneous nerve stimulation in stroke rehabilitation: a randomized, controlled trial. Stroke 32, 707–713 (2001).
Kim, W. S. et al. Effect of electroacupuncture on motor recovery in a rat stroke model during the early recovery stage. Brain Res 1248, 176–183 (2009).
Kornblum, H. I. et al. In vivo imaging of neuronal activation and plasticity in the rat brain by high resolution positron emission tomography (microPET). Nat Biotechnol 18, 655–660 (2000).
Li, G. et al. Cortical activations upon stimulation of the sensorimotor-implicated acupoints. Magn Reson Imaging 22, 639–644 (2004).
Li, Z. R. Experimental Acupuncture. Chinese Medicine Press, Beijing (2003).
Moffet, H. H. Acupuncture may be ineffective for stroke. Arch Intern Med 166, 930 (2006).
Phelps, M. E. et al. Tomographic measurement of local cerebral glucose metabolic rate in humans with (f-18)2-fluoro-2-deoxy-d-glucose: validation of method. Ann Neurol 6, 371–388 (1979).
Ren, L., Zhang, W. A., Fang, N. Y. & Wang, J. X. The influence of electro-acupuncture on neural plasticity in acute cerebral infarction. Neurol Res 30, 985–989 (2008).
Schwartz, W. J. et al. Metabolic mapping of functional activity in the hypothalamo-neurohypophysial system of the rat. Science 205, 723–725 (1979).
Syuu, Y., Matsubara, H., Hosogi, S. & Suga, H. Pressor effect of electroacupuncture on hemorrhagic hypotension. Am J Physiol Regul Integr Comp Physiol 285, 1446–1452 (2003).
Sze, F. K., Wong, E., Or, K. K., Lau, J. & Woo, J. Does acupuncture improve motor recovery after stroke? a meta-analysis of randomized controlled trials. Stroke 33, 2604–2619 (2002).
Tamura, A., Graham, D. I., McCulloch, J. & Teasdale, G. M. Focal cerebral ischaemia in the rat: 1. description of technique and early neuropathological consequences following middle cerebral artery occlusion. J Cereb Blood Flow Metab 1, 53–60 (1981).
Wang, Y. et al. Treatment of apoplectic hemiplegia with scalp acupuncture in relation to CT findings. J Tradit Chin Med 13, 182–184 (1993).
Witt, C. et al. Acupuncture in patients with osteoarthritis of the knee: a randomised trail. Lancet 366, 136–143 (2005).
Young, A. R. et al. Early reperfusion in the anesthetized baboon reduces brain damage following middle cerebral artery occlusion: A quantitative analysis of infarction volume. Stroke 28, 632–638 (1997).
Acknowledgements
This work was partially supported by the Natural Science Foundation of China (No. 60872068), National Basic Research Program of China (No. 2010CB732500) and grant GRF 621707 from the Hong Kong Research Grant Council. We thank Dr. Can Yang and Mr. Wei Huang for the technical support and Dr. Hideo Tsukada at Hamamatsu Photonics K. K. for the suggestion of using injury-volume as a brain function index.
Author information
Authors and Affiliations
Contributions
W. Yu conceived the idea. H. Liu and W. Yu initialized the study. H. Tang, H. Liu and W. Yu designed the experiments. X. Shen, J. Li and T. Xiang carried out the experiments. X. Shen and W. Yu analyzed the data. H. Liu and W. Yu drafted the manuscript. All authors have read and agreed with the manuscript.
Ethics declarations
Competing interests
The authors declare no competing financial interests.
Rights and permissions
This work is licensed under a Creative Commons Attribution-NonCommercial-NoDerivs 3.0 Unported License. To view a copy of this license, visit http://creativecommons.org/licenses/by-nc-nd/3.0/
About this article
Cite this article
Liu, H., Shen, X., Tang, H. et al. Using MicroPET Imaging in Quantitative Verification of the Acupuncture Effect in Ischemia Stroke Treatment. Sci Rep 3, 1070 (2013). https://doi.org/10.1038/srep01070
Received:
Accepted:
Published:
DOI: https://doi.org/10.1038/srep01070
This article is cited by
-
Feature-based Quality Assessment of Middle Cerebral Artery Occlusion Using 18F-Fluorodeoxyglucose Positron Emission Tomography
Neuroscience Bulletin (2022)
-
Best Practice Recommendations for Stroke Patients with Dysphagia: A Delphi-Based Consensus Study of Experts in Turkey-Part II: Rehabilitation
Dysphagia (2021)
-
Effect of Electroacupuncture on Neurological Deficit and Activity of Clock and Bmal1 in Cerebral Ischemic Rats
Current Medical Science (2020)
-
Acupuncture points can be identified as cutaneous neurogenic inflammatory spots
Scientific Reports (2017)
-
Mechanisms of Acupuncture Therapy for Cerebral Ischemia: an Evidence-Based Review of Clinical and Animal Studies on Cerebral Ischemia
Journal of Neuroimmune Pharmacology (2017)
Comments
By submitting a comment you agree to abide by our Terms and Community Guidelines. If you find something abusive or that does not comply with our terms or guidelines please flag it as inappropriate.
