
The ‘correlation coefficient’ was coined by Karl Pearson in 1896. Accordingly, this statistic is over a century old, and is still going strong. It is one of the most used statistics today, second to the mean. The correlation coefficient's weaknesses and warnings of misuse are well documented. As a 15-year practiced consulting statistician, who also teaches statisticians continuing and professional studies for the Database Marketing/Data Mining Industry, I see too often that the weaknesses and warnings are not heeded. Among the weaknesses, I have never seen the issue that the correlation coefficient interval [−1, +1] is restricted by the individual distributions of the two variables being correlated. The purpose of this article is (1) to introduce the effects the distributions of the two individual variables have on the correlation coefficient interval and (2) to provide a procedure for calculating an adjusted correlation coefficient, whose realised correlation coefficient interval is often shorter than the original one.
The implication for marketers is that now they have the adjusted correlation coefficient as a more reliable measure of the important ‘key-drivers’ of their marketing models. In turn, this allows the marketers to develop more effective targeted marketing strategies for their campaigns.
CORRELATION COEFFICIENT BASICS
The correlation coefficient, denoted by r, is a measure of the strength of the straight-line or linear relationship between two variables. The well-known correlation coefficient is often misused, because its linearity assumption is not tested. The correlation coefficient can – by definition, that is, theoretically – assume any value in the interval between +1 and −1, including the end values +1 or −1.
The following points are the accepted guidelines for interpreting the correlation coefficient:
-
1
0 indicates no linear relationship.
-
2
+1 indicates a perfect positive linear relationship – as one variable increases in its values, the other variable also increases in its values through an exact linear rule.
-
3
−1 indicates a perfect negative linear relationship – as one variable increases in its values, the other variable decreases in its values through an exact linear rule.
-
4
Values between 0 and 0.3 (0 and −0.3) indicate a weak positive (negative) linear relationship through a shaky linear rule.
-
5
Values between 0.3 and 0.7 (0.3 and −0.7) indicate a moderate positive (negative) linear relationship through a fuzzy-firm linear rule.
-
6
Values between 0.7 and 1.0 (−0.7 and −1.0) indicate a strong positive (negative) linear relationship through a firm linear rule.
-
7
The value of r2, called the coefficient of determination, and denoted R2 is typically interpreted as ‘the percent of variation in one variable explained by the other variable,’ or ‘the percent of variation shared between the two variables.’ Good things to know about R2:
-
a)
It is the correlation coefficient between the observed and modelled (predicted) data values.
-
b)
It can increase as the number of predictor variables in the model increases; it does not decrease. Modellers unwittingly may think that a ‘better’ model is being built, as s/he has a tendency to include more (unnecessary) predictor variables in the model. Accordingly, an adjustment of R2 was developed, appropriately called adjusted R2. The explanation of this statistic is the same as R2, but it penalises the statistic when unnecessary variables are included in the model.
-
c)
Specifically, the adjusted R2 adjusts the R2 for the sample size and the number of variables in the regression model. Therefore, the adjusted R2 allows for an ‘apples-to-apples’ comparison between models with different numbers of variables and different sample sizes. Unlike R2, the adjusted R2 does not necessarily increase, if a predictor variable is added to a model.
-
d)
It is a first-blush indicator of a good model.
-
e)
It is often misused as the measure to assess which model produces better predictions. The RMSE (root mean squared error) is the measure for determining the better model. The smaller the RMSE value, the better the model, viz., the more precise the predictions.
-
a)
-
8
Linearity Assumption: the correlation coefficient requires that the underlying relationship between the two variables under consideration is linear. If the relationship is known to be linear, or the observed pattern between the two variables appears to be linear, then the correlation coefficient provides a reliable measure of the strength of the linear relationship. If the relationship is known to be non-linear, or the observed pattern appears to be non-linear, then the correlation coefficient is not useful, or at least questionable.
CALCULATION OF THE CORRELATION COEFFICIENT
The calculation of the correlation coefficient for two variables, say X and Y, is simple to understand. Let zX and zY be the standardised versions of X and Y, respectively, that is, zX and zY are both re-expressed to have means equal to 0 and standard deviations (s.d.) equal to 1. The re-expressions used to obtain the standardised scores are in equations (1) and (2):


The correlation coefficient is defined as the mean product of the paired standardised scores (zX i , zY i ) as expressed in equation (3).

Where n is the sample size.
For a simple illustration of the calculation, consider the sample of five observations in Table 1. Columns zX and zY contain the standardised scores of X and Y, respectively. The last column is the product of the paired standardised scores. The sum of these scores is 1.83. The mean of these scores (using the adjusted divisor n–1, not n) is 0.46. Thus, r X,Y =0.46.
REMATCHING
As mentioned above, the correlation coefficient theoretically assumes values in the interval between +1 and −1, including the end values +1 or −1 (an interval that includes the end values is called a closed interval, and is denoted with left and right square brackets: [, and], respectively. Accordingly, the correlation coefficient assumes values in the closed interval [−1, +1]). However, it is not well known that the correlation coefficient closed interval is restricted by the shapes (distributions) of the individual X data and the individual Y data. The extent to which the shapes of the individual X and individual Y data differ affects the length of the realised correlation coefficient closed interval, which is often shorter than the theoretical interval. Clearly, a shorter realised correlation coefficient closed interval necessitates the calculation of the adjusted correlation coefficient (to be discussed below).
The length of the realised correlation coefficient closed interval is determined by the process of ‘rematching’. Rematching takes the original (X, Y) paired data to create new (X, Y) ‘rematched-paired’ data such that all the rematched-paired data produce the strongest positive and strongest negative relationships. The correlation coefficients of the strongest positive and strongest negative relationships yield the length of the realised correlation coefficient closed interval. The rematching process is as follows:
-
1
The strongest positive relationship comes about when the highest X-value is paired with the highest Y-value; the second highest X-value is paired with the second highest Y-value, and so on until the lowest X-value is paired with the lowest Y-value.
-
2
The strongest negative relationship comes about when the highest, say, X-value is paired with the lowest Y-value; the second highest X-value is paired with the second lowest Y-value, and so on until the highest X-value is paired with the lowest Y-value.
Continuing with the data in Table 1, I rematch the X, Y data in Table 2. The rematching produces:
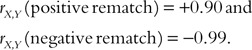
So, just as there is an adjustment for R2, there is an adjustment for the correlation coefficient due to the individual shapes of the X and Y data. Thus, the restricted, realised correlation coefficient closed interval is [−0.99, +0.90], and the adjusted correlation coefficient can now be calculated.
CALCULATION OF THE ADJUSTED CORRELATION COEFFICIENT
The adjusted correlation coefficient is obtained by dividing the original correlation coefficient by the rematched correlation coefficient, whose sign is that of the sign of original correlation coefficient. The sign of adjusted correlation coefficient is the sign of original correlation coefficient. If the sign of the original r is negative, then the sign of the adjusted r is negative, even though the arithmetic of dividing two negative numbers yields a positive number. The expression in (4) provides only the numerical value of the adjusted correlation coefficient. In this example, the adjusted correlation coefficient between X and Y is defined in expression (4): the original correlation coefficient with a positive sign is divided by the positive-rematched original correlation.
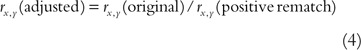
Thus, r X,Y (adjusted)=0.51 (=0.46/0.90), a 10.9 per cent increase over the original correlation coefficient.
IMPLICATION OF REMATCHING
The correlation coefficient is restricted by the observed shapes of the individual X- and Y-values. The shape of the data has the following effects:
-
1
Regardless of the shape of either variable, symmetric or otherwise, if one variable's shape is different than the other variable's shape, the correlation coefficient is restricted.
-
2
The restriction is indicated by the rematch.
-
3
It is not possible to obtain perfect correlation unless the variables have the same shape, symmetric or otherwise.
-
4
A condition that is necessary for a perfect correlation is that the shapes must be the same, but it does not guarantee a perfect correlation.
CONCLUSION
The everyday correlation coefficient is still going strong after its introduction over 100 years. The statistic is well studied and its weakness and warnings of misuse, unfortunately, at least for this author, have not been heeded. I discuss a ‘maybe’ unknown restriction on the values that the correlation coefficient assumes, namely, the observed values fall within a shorter than the always taught [−1, +1] interval. I introduce the effects of the individual distributions of the two variables on the correlation coefficient closed interval, and provide a procedure for calculating an adjusted correlation coefficient, whose realised correlation coefficient closed interval is often shorter than the original one, which reflects a more precise measure of linear relationship between the two variables under study.
The implication for marketers is that now they have the adjusted correlation coefficient, as a more reliable measure of the important ‘key drivers’ of their marketing models. In turn, this allows the marketers to develop more effective targeted marketing strategies for their campaigns.
Author information
Authors and Affiliations
Corresponding author
Additional information
1founder and President of DM STAT-1 Consulting, has made the company the ensample for Statistical Modeling & Analysis and Data Mining in Direct & Database Marketing, Customer Relationship Management, Business Intelligence and Information Technology. DM STAT-1 specialises in the full range of standard statistical techniques, and methods using hybrid machine learning-statistics algorithms, such as its patented GenlQ Model© Modeling & Data Mining Software, to achieve its Clients' Goals across industries of Banking, Insurance, Finance, Retail, Telecommunications, Healthcare, Pharmaceutical, Publication & Circulation, Mass & Direct Advertising, Catalog Marketing, e-Commerce, Web-mining, B2B, Human Capital Management and Risk Management. Bruce's par excellence consulting expertise is clearly apparent, as he is the author of the best-selling book Statistical Modeling and Analysis for Database Marketing: Effective Techniques for Mining Big Data (based on Amazon Sales Rank since June 2003), and assures: the client's marketing decision problems will be solved with the optimal problem-solution methodology; rapid start-up and timely delivery of projects results; and, the client's projects will be executed with the highest level of statistical practice. He is often-invited speaker at public and private industry events.
Rights and permissions
About this article
Cite this article
Ratner, B. The correlation coefficient: Its values range between +1/−1, or do they?. J Target Meas Anal Mark 17, 139–142 (2009). https://doi.org/10.1057/jt.2009.5
Published:
Issue Date:
DOI: https://doi.org/10.1057/jt.2009.5