
Abstract
We present a method for adapting a biologically optimized treatment planning for particle beams to a spatially inhomogeneous tumor sensitivity due to hypoxia, and detected e.g., by PET functional imaging. The TRiP98 code, established treatment planning system for particles, has been extended for including explicitly the oxygen enhancement ratio (OER) in the biological effect calculation, providing the first set up of a dedicated ion beam treatment planning approach directed to hypoxic tumors, TRiP-OER, here reported together with experimental tests. A simple semi-empirical model for calculating the OER as a function of oxygen concentration and dose averaged linear energy transfer, generating input tables for the program is introduced. The code is then extended in order to import such tables coming from the present or alternative models, accordingly and to perform forward and inverse planning, i.e., predicting the survival response of differently oxygenated areas as well as optimizing the required dose for restoring a uniform survival effect in the whole irradiated target. The multiple field optimization results show how the program selects the best beam components for treating the hypoxic regions. The calculations performed for different ions, provide indications for the possible clinical advantages of a multi-ion treatment. Finally the predictivity of the code is tested through dedicated cell culture experiments on extended targets irradiation using specially designed hypoxic chambers, providing a qualitative agreement, despite some limits in full survival calculations arising from the RBE assessment. The comparison of the predictions resulting by using different model tables are also reported.
Export citation and abstract BibTeX RIS
General scientific summary This paper presents the first implementation of the oxygen effect in treatment planning for particle radiotherapy. Solid tumours are often locally deprived of oxygen (hypoxia), which gives rise to an increased radioresistance, quantified as the oxygen enhancement ratio (OER). This can lead to a failure of radiotherapy. Ion beams with their high linear energy transfer (LET) have the potential to counteract this effect and improve the clinical prognosis. We have modelled the double dependency of the OER on LET and oxygen concentration and modified the biological effect calculation in the treatment planning system TRiP98, beyond the conventional RBE-weighted dose, to achieve OER optimized treatment plans. Performing inverse planning we obtain the required cell killing uniformly distributed across the target volume. We have verified our approach experimentally with carbon ions and give a quantitative outlook for the use with different ions of even higher LET, such as oxygen.
1. Introduction
The reduced concentration of oxygen in cells (hypoxia) results in a significantly lower cell death rate after exposure to ionizing radiation. This situation is often found in clinical cases and it is related to insufficient blood supply compared to the consumption; it may occur for several reasons in partial areas of a tumor tissue, and according to that may result in different effects, but is generally correlated to poor treatment outcome in radiotherapy (Fyles et al 2002). An acute hypoxia is induced by a perfusion limit for a transiently occluded blood vessel, while a chronic hypoxia is generated by a diffusion limit from the vessels walls to the given cells (Hall and Giaccia 2006). The microscopic source of this effect on the radiosensitivity is mainly due to the quenching of the DNA damage mechanism mediated by free radicals (von Sonntag 1987, 2007), which, in the presence of oxygen, are able to fix the biological damage and make it permanent. Since the relative importance of the latter mechanism, usually called indirect effect, compared to the overall damage, is related to the quality of radiation and, in general, to the linear energy transfer (LET), this effect is also LET dependent (Hirayama et al 2009, Ito et al 2006). Even if still not univocally understood in full detail, this dependence has been explained as a track density effect (Gervais et al 2006, Meesungnoen and Jay-Gerin 2009): in fact, in high density tracks (corresponding to high LET) a recombination process of the generated radicals is likely to occur and it was clearly observed an increase in molecular species yields as well as a corresponding reduction of radical ones (LaVerne 2000), thus drastically reducing the component of indirect damage and the consequent dependence on oxygen content. Thence, ion beam irradiation allows, in principle, a drastic reduction of this effect and promises, in addition to the other well known physical and radiobiological advantages (Schardt et al 2010, Durante and Loeffler 2010), a potential solution to the hypoxia problem (Kraft and Kraft 2009).
Hypoxia induced radioresistance is quantified by the parameter oxygen enhancement ratio (OER), defined as the ratio between the radiation dose at a given (reduced) concentration of oxygen and the radiation dose in fully oxygenated conditions (air) that produces the same level of biological effect, i.e.:

with pO2, oxygen partial pressure, Da, dose in normoxic conditions (characterized by pO2 = pa ∼ 20%) and D(pO2) isoeffective dose at given hypoxic condition, with pO2 < pa.
As mentioned, then, this effect is crucially dependent on LET, but practically, the conditions sufficient to completely damp this increased radioresistance (down to OER ≈1) are realized only at relatively high LET, i.e. even for ions like carbon, only in small portions of an extended target irradiation (ETI) close to the distal end. This means, that if it is true that ion therapy is the perfect candidate to fight hypoxic tumors, the solution to the problem is not as trivial as it may be seen. It is required the optimal knowledge of the spatial distribution of the different hypoxia levels in the targets, as well as of their radioresistivity dependence at different LET, in order to optimally adapt the use of the particle beams. There is no way at the moment to precisely quantify this dependence, also there is no treatment planning system (TPS) for ions equipped with this feature.
While cell experiments of the kind reported in this work (see section 4), allow a precise conditioning of the target tissue oxygen concentration by construction (Schicker et al 2009), for in vivo and patient studies, a reliable oxygenation quantification is clearly much more complicate. The golden standard for oxygen pressure measurements in vivo is represented by the Eppendorf probe (Lyng et al 1997, 1998), but due to its invasive nature it is not applicable to clinical use.
The major efforts of the imaging community are thus directed to PET tracers such as 18F-Fluoromisonidazole (FMISO), or 18F-Fluoroazomycin-arabinoside (FAZA) and many others (see Mees et al (2009), Padhani et al (2007), Bentzen and Gregoire (2011) for an extensive review). This method, despite several present limits, such as the difficult correlation between uptake and effective oxygen content (Lin et al 2008, Toma-Dasu et al 2009b), is the most promising and widely investigated. Alternative measurements of tissue oxygenation have been also suggested through functional magnetic resonance imaging, f-MRI (Krishna et al 2001).
The problem of adapting the treatment to differently oxygenated areas has been tackled from different sides, mainly for IMRT irradiation, (Toma-Dasu et al 2009a, 2009b, Sovik et al 2007a, 2007b, 2009). Among different techniques, dose painting by numbers (DPN) and by contours (DPC) (Thorwarth and Alber 2010, Thorwarth et al 2007, 2008), are respectively, a method to define subvolumes of different level of hypoxic condition to be irradiated with different doses, and a pixel by pixel based dose coverage of the irradiated volume. For ion beam irradiation, it has been suggested very recently to perform a 'LET painting', trying to take advantage of the different LET composition of the ETI by ions (Bassler et al 2010).
To the best of our knowledge, in any case the two quantities (LET and pO2) and their effect on the OER, have never been considered explicitly simultaneously in treatment planning, not even in a forward calculation of the biological effect distribution, for a given irradiation setup and target composition. The present work, thus, is dedicated to provide this capability to an ion beam TPS through the formalization of the OER bidimensional dependence and its inclusion in the biological optimization of the code, after modifying the algorithms computing the biological effect of a mixed irradiation field. In fact, the OER effect cannot be disentangled from the RBE one in a biologically based optimization since both are dependent on LET and having the largest gradient in a similar region, as already shown in Blakely et al (1979). In contrast to other approaches, where only one of the parameters is regarded, the present one leads to an effect-based optimization of the irradiation fields. This will allow one to explore different methods directed to targeting hypoxic tumors, with exploiting the full capabilities of ion beam irradiation.
The paper is organized as follows: in the following section 2 the original method for generating the OER tables is presented; in section 3 the extension of the code is explained and several exemplary results of forward and inverse planning are given; the experimental tests of the expected survival calculations in the presence of hypoxia are reported in section 4, while in section 5 a comparison with alternative OER tables, generated through different models, is presented together with their impact on treatment planning, after using them as input for our extended TPS code.
2. OER modeling
For modeling the OER dependence, a rigorous analysis would lead to the inclusion of several parameters: oxygen pressure in the hypoxic region, oxygen pressure under the corresponding fully aerated conditions, LET, survival level, projectile type, tissue, cell cycle, etc. In our analysis we had to decide at least for the start to reduce at the minimum the number of parameters. Given the modular structure of TRiP98, a finer refinement including more dependencies will always be possible. Following a literature survey and recent, ad hoc GSI measurements (Tinganelli et al 2011, 2013), it was decided to start with a simple bidimensional parameterization of the OER as a function of LET and pO2 of the hypoxic tissue. A major problem in this task comes from the fact that experimental data on OER measurements are quite poor. These data are available for photons at several different levels of pO2, while for ions of different LET, only in fully anoxic conditions (pO2 = 0). A comprehensive collection of these experiments, and their relative conditions, is reported in tables on Wenzl and Wilkens (2011a) and Stewart et al (2011).
2.1. pO2 dependence
The first dependence to be mapped is obviously the one on oxygen concentration. For that, we decided to extend for every LET level the dependence at asymptotically low LET, i.e. in the case of photon radiation. For this case in the corresponding photon studies (Sovik et al 2007a, 2007b) the parameterization provided by Alper and Howard-Flanders (1956) (AHF) is universally used. They, on the basis of several experiments, describe the relative radiosensitivity RR at a given concentration of oxygen pO2, i.e., the ratio of the sensitivities respectively in that condition, RS(pO2), and in total absence of oxygen, RS(0), with the formula

where M is a maximum effect (generally found for x-rays, for different cell lines, to be M ∼ 3) and K the concentration corresponding to a half maximum sensitization, i.e. (M − 1)/2. Then, considering that RS(pO2)∝1/D(pO2), from (1) the OER may be expressed with a slight approximation in a similar way

with b = K/M
It is worth here to point out that some authors, especially in recent literature (e.g. Stewart et al (2011)), prefer to adopt for this quantity the term 'Hypoxia reduction factor' (HRF). This gives emphasis to the fact that the varying quantity is the pressure (and thus the required isoeffective dose) of the hypoxic phase with respect to the fixed dose required in full oxygenation. On the contrary, the term OER is there left to its historical conception and thus to a ratio where the varying dose is in the normoxic phase, while the reference is taken as the dose in total anoxic (pO2 = 0) conditions. To avoid confusion we stress that the quantity which we will deal in this paper will be always the one defined in (1).
2.2. Survival level (dose) dependence
In principle all OER experimental data are reported as a function of the survival level S or of the dose D. In fact, according to the linear quadratic model (LQ)

with α, β general parameters, the OER dependence should be:

This means that for a given pO2 one cannot, in general, neglect the dependence in S. Alternatively, the same dependence may be expressed on the dose D. It is object of debate for several years if this S dependence should play a role or not, since it is known, for example, that the sensitization effect on β is different from that on α and even some studies report a remarkable dependence (Skarsgard and Harrison 1991), especially at low dose, for x-rays. A very recent paper also attempts to systematize these data and to estimate a small correction factor for neglecting this dose dependence in clinical cases (Wenzl and Wilkens 2011b). Nevertheless it was clear from most of the literature that if the effect should be accounted for, this will be not as relevant as for example it happens markedly for RBE, and that it even reduces drastically, until vanishing, for increasing LET values. Thus, in a first approximation, a dose modifying factor  , at any survival level, can be assumed. E.g. in Carlson et al (2006) it was shown that even if an independent fit of the LQ parameters for an hypoxic and a normoxic curve will lead in general to a dose dependent OER value, it is possible to perform a different fit with the additional constraint of imposing such an average, constant dose modifying factor, with an almost negligible deviation in the resulting curves compared to the experimental uncertainties. The value of this factor is normally very close to the OER(10%). This allows us to safely neglect this effect especially for ion beams, at least for the initial input tables for the code; considering, still, the possibility to reintroduce it in refined tables, as mentioned at the start of this section, or to correct the outcome with the estimations provided in Wenzl and Wilkens (2011b).
2.3. LET dependence
As for the LET dependence, we decided to map explicitly its dose averaged value, where the dose averaged LET is defined as

with Di dose and Fi fluence of the radiation component i. It was shown that dose averaged LET is a better descriptive quantity of the radiobiological effect of an ion producing a mixed radiation field (ICRP 2003), as compared e.g., to a track average, and in this case it is the more natural indicator of radiation quality.
Firstly, after the asymptotically low LET, the other asymptotic condition was considered, i.e. pO2 = 0. This condition (pure anoxia) is not really interesting in clinical practice, since it is mostly related to already dying cells, while the hypoxic fraction at intermediate levels of oxygen is most dangerous. Nevertheless it is useful to describe the maximum effect, and it is also the condition where most experiments are available. For our purposes, then, we used the large Japanese dataset (Furusawa et al 2000), with several OER measurements for several ions and two exemplary tissues (V79 and HSG cells). There it was shown a very slight dependence on the ion type (more pronounced for the lighter ones). In fact, results for ions as different as carbon and neon lead to a difference which is sensible but small as compared to the experimental spread of the data. Moreover, the tissue dependence has also been shown to be relatively small, since the two, quite different, sampled cell lines present very similar OER profiles. This fact was found also in previous works, e.g. in Freyer et al (1991), in the systematic review of Wenzl and Wilkens (2011b) and also in recent measurements from ourselves (Tinganelli et al 2013). There, cell lines even with remarkable differences in sensitivities showed a quite similar OER. This allows us to take a table extracted from V79 measurements as a primer also for modeling different cell types. Certainly, in case of future availability of extensive data for a specific cell line, more accurate tables for the latter can be generated and imported in the program in the same way. Then the OER data at pO2 = 0, for 10% survival in V79 cells, as a function of LET were fitted with a form similar to the AHF one but where, in order to reproduce the steeper fall-off toward higher LET, we introduced an additional parameter γ:

with fitting parameters found to be a = 8.27 · 105(keV μm−1)γ and γ = 3.0; and M0 a maximum value at zero pressure set to 3.0.
A confirmation of the very small OER dependence on the dose and then of the validity of an approximation employing a dose modifying factor, arises from the analysis of these data and specifically comparing the fit obtained on the 10% survival data with the other data reported in that collection (Furusawa et al 2000): in figure 1 the survival dependence is extracted through inserting the reported LQ parameters in (5), and it is especially visible how, at increasing LET, the assumption of the dose modifying factor becomes even more safe, as also reported in Wenzl and Wilkens (2011b).
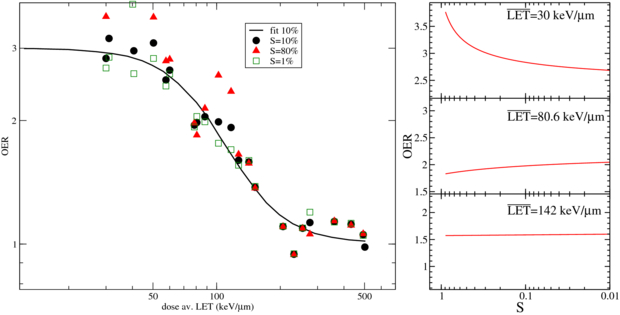
Figure 1. Dose averaged LET dependence of OER at pO2 = 0, obtainable from experiments on V79 cells (Furusawa et al 2000): left panel, OER resulting data at different survival levels and compared to the fit provided in this work and performed using only the 10% values; right panel, survival dependence of observed OER at different  levels.
Download figure:
Standard image High-resolution imageOther intensive experiments of heavy ions with hypoxia were reported by the Berkeley group (Blakely et al 1979) and Rijswyk/London (Barendsen et al 1966) but since data reported are versus track averaged LET and not dose averaged, a comparison is not straightforward; and for the same reason in the Japanese report mentioned above no comparison is performed with these older data.
Finally the extension in the full two-dimensional plane ( ) was obtained combining the two asymptotic relations by assuming a similar pO2 dependence at any
  , refining an approach we introduced in Scifoni et al (2011), and thus substituting to the M in (3) a maximum value dependent on
  , coming from (7):

with M0 = 3.0 and b = 0.25%.
The complete surface is shown in figure 2, with the parameter values introduced above. Independent measurements performed at GSI, with the techniques described in following section 4, confirmed the behavior of the fully anoxic curve, and additionally gave some insights of the partial hypoxic conditions with a set of measurements at pO2 = 0.5%, for a single LET value, which resulted, after averaging on the three performed experiments, in very good agreement with the corresponding computed curve. These measurements were performed on CHO-K1 cells, a tissue type similar but not identical to the Japanese one, thus confirming the above mentioned very low tissue dependence. The complete original experimental data, partially reported in Tinganelli et al (2011) and Durante et al (2012), will be published separately (Tinganelli et al 2013), while the extracted OER values are summarized in figure 2 and superimposed to our independent parameterization. There, the numbers close to the points correspond to the number of experiments performed; and when only a single experiment was possible, mean and standard deviation are derived from the colonies counts. These data also confirmed the almost negligible dependence on ion type, for a discrete range of Z, once the dose average LET is considered, as also found in Furusawa et al (2000).
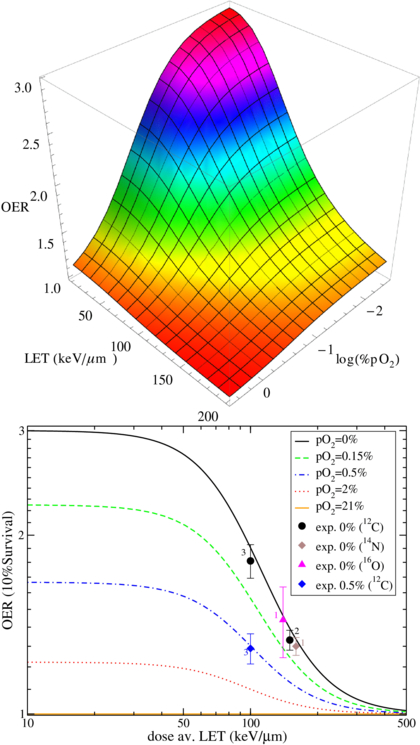
Figure 2. OER dependence on LET and oxygen concentration, in the parametric description provided in this work and, in the lower panel, selected surface cuts compared to independent experimental data (Tinganelli et al 2011, Durante et al 2012). The number of performed experiments is also shown close to the corresponding average point, see text for details.
Download figure:
Standard image High-resolution imageThe complete lack of experimental data (except the single one reported) at intermediate values of pO2 and LET, impose a serious uncertainty to the present as well as to any other model, especially since these are the most relevant conditions for treatment planning. In fact, the typical  values in an ETI with carbon ion are between 70 and 130 keV μm−1, exactly in the region where the slope of the OER surface is maximum and the most typical values for hypoxic tumors are for a pO2 between 0.15 and 2%. We want to point out that the single measurement we reported at 100 keV and pO2 = 0.5% is the first one in this region, which should be definitely explored more extensively.
3. TRiP implementation
TRiP98 (Treatment planning for particles) (Krämer et al 2000, Krämer and Scholz 2000, Gemmel et al 2008) is a code born in connection with the pilot project at GSI and is now, after more then ten years, developed in several directions, including moving targets handling, multiple field optimization (MFO), various beam models, adaptive treatment planning, multiple ions, etc. Present status is summarized in Krämer and Durante (2010). After serving the pilot project at GSI (Amaldi and Kraft 2005), TRiP98 is presently intensively used as a research prototype for the growing facilities preparing to use ion beams for therapy (Krämer et al 2012b). Furthermore, due to its modular structure, it is especially suited to be expanded to account for different effects and it is thus the ideal candidate to be enhanced toward the hypoxia handling approach. The core part of the program is the optimization (see figure 3), available also for multiple fields (Gemmel et al 2008) and based on biological effect, but where the biological effects are presently accounted only via the RBE. The key quantity in the optimization process is the objective function χ2 which should be minimized as a function of the fluences in every raster spot:

where  is a vector, whose components are the particle numbers in each raster point,
  ,
,  and
and  , are respectively the prescribed dose, the actual one and the maximum acceptable one at the voxel i and the ΔD are adjustable weight factors, while Θ is the Heaviside function evaluating to 1 when the argument is strictly positive, and otherwise to 0.

Figure 3. Main structure of program TRiP98 (for further details see Krämer and Durante 2010).
Download figure:
Standard image High-resolution imageThe computed doses, in case of biological optimization, are corresponding to the biological dose, which is presently related to the physical (absorbed) one by the relation

Our purpose was then to include in the biological effect also the OER. For the explicit calculation of the biological dose, a straightforward simplification is possible from the recently introduced low dose approximation (Krämer and Scholz 2006):

where αx, βx are photon parameters,  ,
,  the ion parameters after dose averaging in the mixed field resulting at voxel i and
  the corresponding row of the dose correlation matrix (Krämer and Durante 2010), representing the magnitude of the contribution of all raster spots to the voxel i. The
  (which we approximated to the OER10 extracted from the experiments) thanks to its dose modifying feature, may then be easily included in (11) by substituting the ion parameters by


so that the complete biological effect, an isoeffective dose in the presence of hypoxia, can be computed, and subsequently the resulting survival level.
The code is then enhanced to deal with provided external tables for a given tissue, with the possibility to provide different entries also for every ion type. However, for the start, for the reasons mentioned in the previous section, the latter dependence is used as a dummy, with all the particles following the same OER dependence. This approximation affects mostly the accounting of the lighter fragments which probably will give a significant deviation. The use of the dose averaged LET, as shown in the results of Furusawa et al (2000) and confirmed by our group (Tinganelli et al 2011), mitigates this deviation, but does not eliminate completely this dependence and a better description of—especially—proton and helium ions would be necessary in further developments.
The OER tables are imported and then, at any voxel, according to the local pO2 of the tissue and the computed  resulting from the local mixed field, a bilinear interpolation returns a value to be passed to the biological effect routines mentioned above (see figure 4 for details). The pO2(xi, yi, zi) entering there, are the values of oxygen concentration in the voxels i pertaining to the target, and may be introduced by a proper transformation of PET imaging data, loaded together with the CT ones after proper registration. Details on how we performed this importation for clinical input tests will be done in a separate dedicated publication, while in the present one we deal mostly with simulated PET, where the tumor voxels are labeled with arbitrary pO2 values.

Figure 4. TRiP-OER implementation scheme: the OER tables are produced as described in section 2, while the pO2 values labeling the tumor voxels may be input e.g., from imaging data; the OER is calculated at any voxel and for every field and is entering the biological effect calculation and the optimization of the fields.
Download figure:
Standard image High-resolution image3.1. Expected survival calculations
Results accessible from this new TRiP98 extension, which we call TRiP-OER, are of a different kind. The quantity immediately retrievable from this model and from the  resulting at any point of an irradiated target is the
  as a function of ion penetration depth. This analysis is shown for several pO2 values and for two different primary ions on figure 5. There an extended target of 4 cm centered at a depth of 8.3 cm was planned in order to get an RBE-weighted dose of 6.5 Gy(RBE) in a normoxic target for carbon. The effect of stopping particles, dominating at the distal end of the target volume, in suppressing the radioresistance effect is clearly evident, especially for the more drastic (lower) pO2 conditions. But it is also evident how this LET 'counter-effect' plays a role, especially for carbon ions, only in a relatively small region of the irradiated extended target volume.

Figure 5. Comparison of the computed  along an extended target irradiation, for carbon (black curves) and oxygen (red (lighter) curves) at different pO2 levels. The hatched areas represent the clinical interesting regions for hypoxia (0.15% < pO2 < 0.5%). Doses indicated are prescribed RBE-weighted doses in the target.
Download figure:
Standard image High-resolution imageThis allows one to draw some estimates of an expectable clinical advantage of the use of different ions as the ones available, e.g., in the Heidelberg HIT facility, where the oxygen beam was recently characterized (Kurz et al 2012). In fact, while one may appreciate the overall effect of a carbon ion, it is remarkable how an oxygen ion irradiation, with a prescribed dose chosen in order to maintain the same dose in the entrance channel, may drastically further reduce the effect in the intermediate pO2 values corresponding to relevant clinical hypoxia.
For a more detailed comparative analysis see tables 1 and 2. In table 1 a similar situation as the one plotted in figure 5 is shown, for different extensions of the tumor target (and then of the region covered with the extended irradiation) along the penetration depth dimension z. The effect of the two ions, delivering the same dose to the entrance channel are explored at the proximal end and in the central point of the extended volume. From the relative reduction ( ) it is quite visible how the effect of the higher LET ion is especially advantageous in small tumors, highly hypoxic, reaching a value of 30%. In table 2 the same analysis is done for tumors of the same extension (4 cm along z) placed at different depth, i.e. where the isocenter is placed respectively at 6.3, 8.3 (as in figure 5) and 10.3 cm in water equivalent path length (WEPL) from the tissue entrance. In this case a clear trend as a function of depth seems not evident, and the improvement appears to be almost constant for more deep seated tumors as compared to the ones closer to the surface. A similar comparative analysis for protons and carbon ions, but just for a single irradiation configuration, is reported in Wenzl and Wilkens (2011a). In the case of oxygen and carbon this analysis is less sensitive to error in the OER versus LET parameterization, since as shown, the different ions behave very similarly in the experiments.
Table 1.  for carbon and oxygen and relative reduction (RO/C) for a tumor of different sizes (extension along z), centered at a depth of 8.3 cm WEPL, computed at different positions within the extended volume. Data for 4 cm size correspond to figure 5.
| Tumor size (cm) | pO2 | 0% | 0.15% | 0.5% | |
|---|---|---|---|---|---|
| Target center | 2.0 |  |
2.1 | 1.7 | 1.4 |
 |
1.5 | 1.3 | 1.2 | ||
| RO/C(%) | 29 | 23 | 15 | ||
| 4.0 |  |
2.5 | 1.9 | 1.5 | |
 |
1.9 | 1.5 | 1.3 | ||
| RO/C(%) | 26 | 21 | 13 | ||
| 6.0 |  |
2.6 | 2.0 | 1.6 | |
 |
2.1 | 1.7 | 1.4 | ||
| RO/C(%) | 21 | 17 | 12 | ||
| Proximal end | 2.0 |  |
2.5 | 1.9 | 1.5 |
 |
1.9 | 1.5 | 1.3 | ||
| RO/C(%) | 25 | 22 | 17 | ||
| 4.0 |  |
2.7 | 2.1 | 1.6 | |
 |
2.3 | 1.8 | 1.4 | ||
| RO/C(%) | 17 | 15 | 11 | ||
| 6.0 |  |
2.8 | 2.2 | 1.6 | |
 |
2.6 | 2.0 | 1.5 | ||
| RO/C(%) | 10 | 9 | 6 |
Table 2.  for carbon and oxygen and relative reduction (RO/C) for a 4 cm WEPL extended tumor centered at different depths, computed at different positions within the extended volume. Data for 8.3 cm depth correspond to figure 5.
| Tumor depth (cm) | pO2 | 0% | 0.15% | 0.5% | |
|---|---|---|---|---|---|
| Target center | 6.3 |  |
2.5 | 2.0 | 1.5 |
 |
1.8 | 1.5 | 1.3 | ||
| RO/C(%) | 28 | 23 | 16 | ||
| 8.3 |  |
2.5 | 1.9 | 1.5 | |
 |
1.9 | 1.5 | 1.3 | ||
| RO/C(%) | 26 | 21 | 13 | ||
| 10.3 |  |
2.6 | 2.0 | 1.5 | |
 |
1.8 | 1.5 | 1.3 | ||
| RO/C(%) | 28 | 23 | 16 | ||
| Proximal end | 6.3 |  |
2.8 | 2.1 | 1.6 |
 |
2.2 | 1.8 | 1.4 | ||
| RO/C(%) | 20 | 17 | 12 | ||
| 8.3 |  |
2.7 | 2.1 | 1.6 | |
 |
2.3 | 1.8 | 1.4 | ||
| RO/C(%) | 17 | 15 | 11 | ||
| 10.3 |  |
2.8 | 2.1 | 1.6 | |
 |
2.2 | 1.8 | 1.4 | ||
| RO/C(%) | 19 | 16 | 12 |
This kind of analysis may help to lay the basis for the conditions which drive the choice for a multi-ion treatment; a point which will be further developed in tight connection with the TRiP multi-ion development (Krämer et al 2012a, 2012b). The latter recent extension, in fact, allows to perform inverse planning with the use of different beam modalities and then to optimize at once, e.g., two beams of different ions, selecting accordingly the proper fluences for any beam at any raster point. The full application of this multiple ion feature to the present hypoxia problem goes beyond the scope of this paper, where we focus on carbon beams, but will be exploited in a forthcoming one.
Then, using the survival calculations implemented as explained above, it is possible to perform forward planning calculations yielding the corresponding survival level, assuming an homogeneous target at different pO2 states (figure 6). One can now appreciate in terms of actual survival level along the irradiated extended volume, how the combined role of oxygen concentration and dose averaged LET drastically affect the biological outcome, as shown for an exemplary tissue of CHO-K1 cells (αx = 0.22 Gy−1, βx = 0.02 Gy−2), very similar, as mentioned, to the ones used in the parameterization.
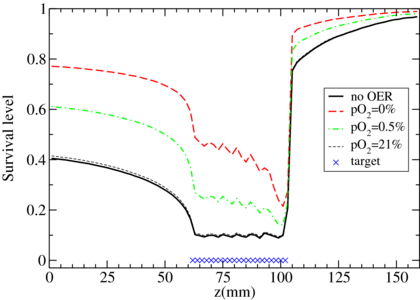
Figure 6. TRiP-OER recomputed survival curves along a carbon ion extended target irradiation, for different oxygenation levels of irradiated (CHO cells), after optimization on a corresponding normoxic tissue.
Download figure:
Standard image High-resolution imageA refined tissue model can also be considered, as shown in figure 7, where the oxygenation level is spatially inhomogeneous (as in the interesting clinical cases) and the code is shown to correctly deal with changes of pO2 values from one voxel to the other.

Figure 7. Expected survival computed in a model tumor with differently oxygenated regions, irradiated by a carbon ion plan optimized on the whole normoxic tissue.
Download figure:
Standard image High-resolution image3.2. Optimization and dose compensation
After exploiting the capability of TRiP-OER to predict the survival including the OER, in 3D along an ETI, attempts of dose compensation and inverse planning have been performed. In the first version, the biological effect accounting for OER is computed directly in each iteration step, while the mechanism of the iterative solution is not altered from the previous version (Gemmel et al 2008, Horcicka 2012, Horcicka et al 2012).
Results are plotted in figure 8. As is visible, in the case of a homogeneous hypoxic tissue (left panels), dose compensation is able to restore the required survival level. Also in the case of a composed tissue, even if with slight fluctuations, the dose compensation in the tissue is successful, but the price to pay is a larger damage in the entrance channel which eventually needs to be prevented, but cannot at this point. The effect of the correction is clearly visible in the resulting absorbed (or physical) dose, which, as evident in the composed tissue case, may consequently also have discontinuous shapes in correspondence to abrupt changes in tissue sensitivity. Another technical point that is arising from this data is that as long as a strong sensitivity variation is along the z axis, it is technically not problematic to adjust the dose delivery accordingly, but when it occurs within the same isoenergetic slice, an abrupt jump in fluence might be required to the ion scanning system that is not always feasible. This point might require the design of specific irradiation geometries in order to minimize the gradient in the x, y directions. A two-dimensional view of the survival profile in a similar, slightly more complex, model tissue, shows clearly the uniformity of the dose coverage (figure 9).

Figure 8. TRiP-OER optimized plan for an homogeneous tissue at pO2 = 0.5% (left) and for a composed target (normoxic, 0.5%, 0%). Upper figures, survival rates, lower figures physical doses, in units of per mil of prescribed dose (Dpre), resulting from the full biological optimization. Results with dose compensation shown in solid lines and compared to a normoxic target plan (dashed lines).
Download figure:
Standard image High-resolution image
Figure 9. TRiP-OER computed survival level distributions (values in legend) in two dimensions, without (left) and with (right) taking into account the non-uniform oxygen concentration of the target tissue into the optimization.
Download figure:
Standard image High-resolution imageThe normal tissue can be much better spared adopting an additional field and performing a MFO, i.e. optimizing at the same time the contributions from both fields to the overall effective dose. This means that the vector  in (9) is containing as many components as all the raster spots of all the fields, and the minimization of the χ2 function is performed on this full space at once. This method has been already shown to be convenient in RBE-weighted dose optimization, especially of complex target geometries (Gemmel et al 2008). In this specific case, where hypoxia is additionally included, considering the OER dependence on LET it is especially advantageous to use several fields, since the differently oxygenated regions can be irradiated using the best components of the two fields, as also suggested in Bassler et al (2010). In the example of figure 10, where two opposed fields are simultaneously optimized, it is evident how the overall survival has a more convenient profile, moreover, the contributions from different fields to the absorbed dose, show how the modified optimization algorithm selects the beams accordingly.
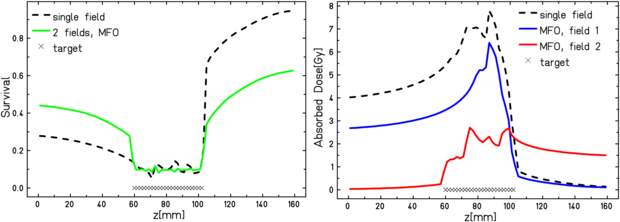
Figure 10. TRiP-OER optimized plan for an inhomogeneous target as in figure 8, but with two opposed fields in multiple field optimization as compared to single field. Left panel survival level, right panel, absorbed dose contributions.
Download figure:
Standard image High-resolution image4. Experimental verification
Dedicated plans were produced for several beamtimes performed at GSI in order to test the predictive features of the code and the reliability of the semi-empirical OER model used. Given the small impact of the LET induced OER reduction for an extended irradiation with carbon, as explained above, the aim of the experiment was also to analyze if this effect on the survival would be detectable through biological dosimetry, and if yes, whether the proposed simplified model would be consistent for describing the affected region. For that, a specifically designed exposure chamber with conditioned oxygenation has been used, which has been developed and patented at GSI (Schicker et al 2009). CHO-K1 cell lines were grown on a 4.5 cm2 area on gas permeable foil supported on a PVC-ring. Each ring is covered with a 3 mm layer of medium and sealed with a second foil. This allowed to gas the chamber for several hours with standard gas mixtures: 95% N2, 5% CO2 for anoxic condition and 94.5% N2, 5% CO2, 0.5% O2 for hypoxic condition. The ring can be turned in the two opposite orientations with respect to the beam, allowing to expose the cell layer at different depth positions. The chambers are made of polyether etherketone and available either in a simple shape, containing a single ring, or with three rings (details in Tinganelli et al (2013)). The chamber's wall for the beam entrance has a thickness of 1 mm and the gas flow was measured with a thermal mass flow meter calibrated for nitrogen.
4.1. Pilot experiment
In a first beamtime, a tumor tissue with three different concentrations of oxygen has been simulated. A 4 cm water equivalent length target centered at 8.1 cm from the beam entrance was planned, divided in a first region (from the proximal end) of 13 mm of normoxia, a second layer of 13 mm of hypoxia (pO2 = 0.5%), and a last one of complete anoxia (pO2 = 0%), 14 mm, a phantom corresponding to that of figure 8, right. Three chambers, each one containing three rings and entirely gased at the corresponding concentration, were then placed in a corresponding position after accounting for the path length conversion factors. The oxygenation condition has been checked to be maintained during the time of irradiation, after performed tests on the concentration changes after interruption of the gasing procedure. Additionally, two normoxic single chambers were placed in the entrance channel as a further control (figure 11). The plan was prepared in order to have a 10% survival in the target in a normoxic case, but was later recomputed according to the average photon parameters obtained from all the measurements performed in our group in the last three years on these cells on film support: αx = 0.171 Gy−1, βx = 0.02 Gy−2, Dt = 17.5 Gy (Tinganelli et al 2013). In order to assure uniformity in the dose coverage, the target was chosen as a broad parallelepiped, with Δx = 6 cm and Δy = 10 cm. A single beam was used, with energies optimized by the program to cover the requested range (Emin = 173.63 MeV/u, Emax = 224.81 MeV/u). For having a reasonable fast irradiation we imposed a set of energies corresponding to depth steps of 3 mm, corresponding to the size of the ripple filter employed. For the lateral extension the raster spots were imposed at steps of 2 mm in both directions (x, y) and for each of them beam size was 5.4 mm FWHM.
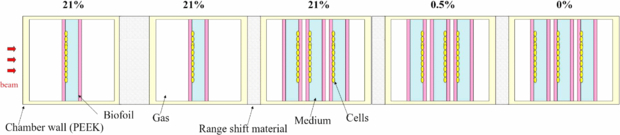
Figure 11. Schematic top view of the irradiation configuration for the pilot experiment. On top, the oxygenation condition (pO2) induced inside the corresponding single or triple chamber. The cells are let grown on different edges of the ring, as shown, in order to cover different depth positions.
Download figure:
Standard image High-resolution imageAfter the irradiation, one of the biofilms sealing the ring is removed (the one opposed to the cell layer) and cells are trypsinized for 5 min at 37 °C and then counted and reseeded in tissue culture flasks according to the expected survival and the plating efficiency. After one week the colonies are counted and the survival level is computed. Details on the standard procedure for plating/counting are available in Tinganelli (2012).
The results (figure 12), where the error bars derived from the colonies count are also reported, show an overall qualitative agreement between measured survival and the TPS predictions and suggested refined insights for a second experiment. In fact, apart for an overall scaling factor, which may be induced to a collective increased radioresistance of all the cells, the most puzzling fact was the impossibility to detect any kind of LET effect at the distal end of the peak. This could be due to range uncertainties which displaced the cell layers to lower LET regions. The two sources of these uncertainties are tiny leaks of medium, which may occur and slightly reduce the effective depth, and deformation of the rings with accumulation of the medium toward the bottom due to gravity, inducing a non uniform exposure of different compartments of the target cell layers. Such uncertainties, in the present case, accumulate, especially in the last of the three triple chambers placed in a row along the beam.
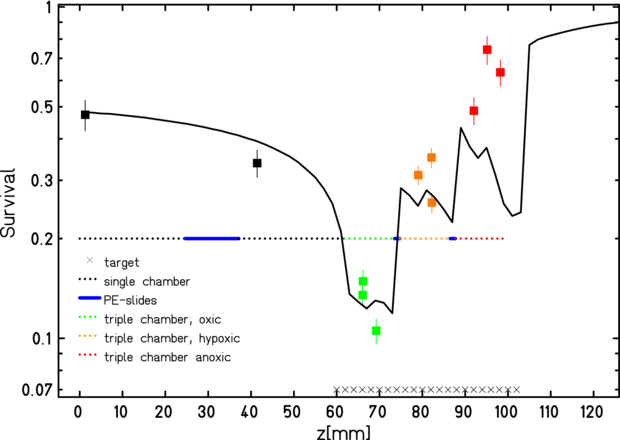
Figure 12. TRiP-OER computed (line) and measured (points) survival for differently oxygenated regions along an extended target irradiation in the pilot experiment. Indicative error bars derived from the colonies counts (see text for details).
Download figure:
Standard image High-resolution image4.2. Refined experiments
The following series of beamtimes was focused on the distal part of the irradiated extended target, which has been analyzed in total anoxic conditions; and, in order to check the consistency, an identical configuration with normoxic cells was irradiated too. No additional chambers were placed upstream the beam, in order to reduce the range uncertainties. Moreover, in order to minimize the time of vertical placing of the rings, and then the gravity-induced deformations mentioned above, the chambers were kept with the rings parallel to the ground until positioning for irradiation.
Three triple chambers were prepared in normoxic conditions and another three at pO2 = 0. In addition, two unirradiated controls, for each oxygenation condition, were prepared and subjected to the same procedure as the others, except irradiation. In order to increase the number of sampling points within the target volume, the three triple chambers, for every oxygenation state were placed on a conveyor belt perpendicular to the beam, with respectively 0, 1 and 2 slices of material (poly-methyl-methacrylate) inducing a shift of 1.255 mm WEPL each (figure 13). In this way the last 8 mm of the irradiated extended target volume, where the LET effect is supposed to be larger, have been sampled uniformly and fairly densely. The beam features were the same of the previous experiment, a part for a slightly deeper centering of the target (8.3 cm), for convenience of the setup construction, and a reduction of the lateral extension of the field (Δx = Δy = 4 cm), to spare irradiation time.
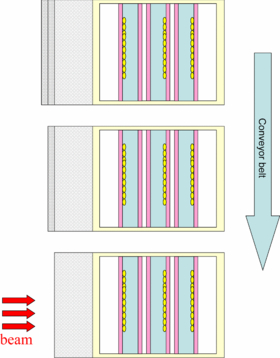
Figure 13. Schematic top view of the irradiation configuration for the second type of experiments, for each oxygenation condition. A conveyor belt is used to successively expose identical triple chambers with an additional range shift induced by one and two slices of material. For elements' details see figure 11.
Download figure:
Standard image High-resolution imageThis experiment was repeated in its complete form two times. Two additional measurements were performed of the single anoxic curve. On one of these occasions, additionally, a survival curve at intermediate oxygen concentration (pO2 = 0.5%) and a fixed LET value (100 MeV mm−1), obtained from an irradiation on a small (1 cm) extended volume, was performed to test the introduced model for generating the OER tables in a crucial region, confirming the point plotted in figure 2.
The average of the results obtained in all the beamtimes (four anoxic and two normoxic measurements) are shown in figure 14, where they are plotted together with the bar of errors resulting from the standard error of all the corresponding independent experiments. In this case, as visible, the resulting data showed a much better agreement with the predictions, as compared to the pilot experiment. The agreement is anyhow not fully satisfactory, and progressively worse, at the last 4–5 mm of the extended target, and still the pure effect of the LET in suppressing the OER seems not to be visible. This is, however, understandable when looking to the corresponding deviation in the normoxic curve. In this region (the extreme distal part of an extended target volume) as already commented in Friedrich et al (2010, 2012), the uncertainty of the photon parameters (αx, βx) which are input in the advanced RBE modeling (LEM IV) used in TRiP98, will induce a larger uncertainty in RBE. This is, in particular, the case for in vitro cell lines which might underly temporal variations: significant variations, indeed, for anticorrelated LQ variables for multiple measurements are observed. And this is the case for the employed CHO cells, which we choosed for the convenient behaviour in the hypoxic chambers. This 'distal end' effect becomes even more pronounced if associated to slight range uncertainties, of the kind we mentioned above, which still may occur in a non-rigid setup as the one we used. In this case, a slight progressive overestimation of the RBE it is quite evident in this last region, returning a smoother curved profile, instead of the predicted steep gradient as requested in the optimization. In usual experiments, this deviation does not play a crucial role, but in this specific case where we are interested exactly in the very last 5 mm of the target, the overestimation of the RBE, and then an underestimation of the required physical dose, is enough to compensate the OER-suppressing effect of the high LET occurring at those depths and resulting in an overall almost flat survival profile. This deviation is quite typical for RBE tables produced with LEM IV, which slightly tends to overestimate the RBE at high LET, inversely of what happened, e.g., in the LEM I case. The impact of this effect on treatment planning, specifically on the distal ends of ETI, and especially in comparison with tables produced with LEM I was extensively analyzed and commented in a very recent publication (Grün et al 2012). There it was also shown that any deviation is strongly reduced by the application of two opposed fields, and then, in practical clinical situations. It is anyhow also worth mentioning that TRiP98 biological optimization is not bound to a specific LEM version. In fact, as recalled in the previous section, the RBE model provides the initial intrinsic RBEα(E,Z) tables for any energy and particle type, which after importing are combined for each voxel by different internal models.
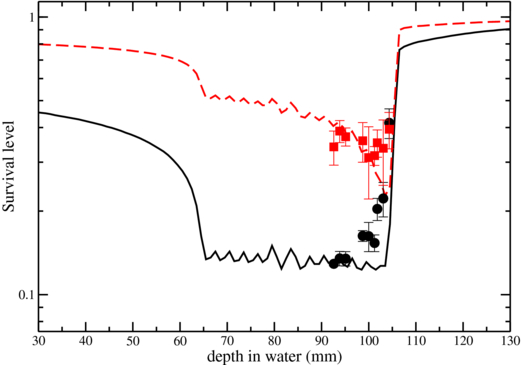
Figure 14. TRiP-OER computed (lines) and measured (points) survival for normoxic (solid line) and fully anoxic (dashed) CHO cells along the distal end of an extended target irradiation. Average values and error bars derived from four (anoxic) and two (normoxic) independent experiments (solid points).
Download figure:
Standard image High-resolution imageNevertheless, since the above effect is affecting in the same way, the normoxic and anoxic data, a confirmation of the above mentioned argument and a better evaluation of the goodness of the present OER prediction is visible in the following figure 15. There, the RBE dependence is disentangled from the OER one, by taking the ratio of the logarithm of the survival data, collected in the same occasion (only the two anoxic measurements performed in combination with normoxic controls were taken), and considering that at high LET, i.e. for depth z in the distal end, it is valid

In this way also the impact of range uncertainties is substantially leveled, considering a similar effect in the anoxic and the normoxic setup. So it is possible to compare the resulting  along the irradiated volume, in that region, resulting from the code predictions and from the set of experiments over reported. In this case the agreement is more remarkable and the trend in reducing the
  is evident also from the experimental data. The oscillations of the computed curves, here and in previous figures, are a consequence of the energy resolution employed in the active scanning (corresponding to steps of 3 mm in depth, as specified above in the beam features). The similar plot of figure 5, with smoother profile, was instead optimized employing more beam energies (corresponding to steps of 1 mm in depth).

Figure 15. TRiP-OER computed (lines) and measured (points)  along the extended target irradiation. Blue (dashed) line: TRiP-OER results by loading OER tables extracted from Wenzl and Wilkens (2011a) (see section 5), black (solid) from present model. Error bars propagated from normoxic and anoxic survival data collected at the same time in two independent experiments.
Download figure:
Standard image High-resolution imageFrom the obtained results it is possible to conclude that the effect of LET in suppressing the  in an extended carbon ion irradiation is detectable, through biological dosimetry, even if the region where this effect plays a role is quite small and present a large uncertainty in RBE assessment. Moreover, the effect is in agreement with the predictions of the enhanced TRiP98 code presented here. This possibility would open the way to optimize the treatment even with the only use of carbon beams, e.g. simply concentrating that high LET component in the more hypoxic region either with the more sophisticated optimization approaches accessible through TRiP98. As mentioned above, anyhow, for a more remarkable and spatially extended effect, the combined use of different ions would be of larger efficiency, as indicated in table 1. In the latter case, also absolute survival measurements are expected to be less affected by RBE uncertainties, as also already verified in the case of multiple fields of carbon beams (Grün et al 2012).
5. Comparison and inclusion of different OER models
After performing our first tests with our own parameterization (Scifoni et al 2011) we got in contact with three groups who just published in the same year a similar modeling of OER(pO2, LET). We then performed several comparisons, in order to evaluate the effect of the different OER tables when loaded in the present code. In Wenzl and Wilkens (2011a) it is introduced a parameterization which stems from a slightly different approach. In this case an AHF-like behavior is assumed on each of two LQ parameters for the pO2 dependence, while a linear dependence with respect to the LET is also included for the α parameter. Then the parametric expression for α(LET, pO2) and  values are inserted in (5) and, assuming always S = 0.1, the related parameters are obtained.
The result is sensibly different from our approach as visible in figure 16. In their approach much more experiments are taken into account, while the parameterization is extracted considering all the points in full anoxic conditions and then the other parameters are derived. For details see Wenzl and Wilkens (2011a). They show different results for in vitro data and in vivo data, where also the fully oxygenated state is different, and thus the parameter pa was taken differently and corresponding to 4%. A comparison of the bidimensional dependence is shown in figure 16. The most evident feature is that the overall gradient of LET dependence is much less steep.

Figure 16. Comparison of  surface cuts from the present work (black lines) with those from Wenzl and Wilkens (2011a) (left, blue lines) and those from Stewart et al (2011) (right, red lines). (Different linestyles for all sets of curves refer to the corresponding pO2 values on the legend).
Download figure:
Standard image High-resolution image
Then, the TRiP-OER extension was shown to be able to handle successfully also these alternative tables, and the results for the obtained  along an irradiation configuration as we described in the previous section are shown also in figure 15. The comparison in this case shows a slightly better agreement with our proposed model tables, which are more suitable for the specific in vitro case (while eventually, for in vivo irradiation the latter tables could be more appropriate).
In a subsequent, just published work of the same group (Wenzl and Wilkens 2011b) the tables are expanded accounting for a dose dependence. The correction has been shown to be relatively small and we do not analyze here, for the moment, this issue.
A parametric approach very similar to ours was presented, again during 2011, from Brahme (2011). In this work also the dose modifying approximation is used and the same pO2 dependence as we did, while the LET dependence is described according to an exponential formula:

A very small deviation is observable from our model (an even steeper gradient in LET fall-off), which can be considered negligible when propagated to the treatment plans.
Finally, another interesting model of the same two-dimensional dependence has been provided very recently by Stewart et al (2011), attempting a partially mechanistic explanation. This stems from a Monte Carlo simulation of the probability of the damage fixation mechanism to occur as a function of radiation quality and oxygen concentration. Then the  (HRF) of the double strand break induction obtained from the model is matched to that one of clonogenic survival from the experiments, in the same asymptotic cases as we considered. The resulting function has the same dependence in the pO2 variable, as we used (3), while the maximum value M therein is modulated from the LET dependence as a parametric function of (Zeff/β)2 (square of ion effective charge over its speed relative to the speed of light) (Stewart et al 2011).
In figure 16 is shown a comparison of OER tables resulting from the latter model with ours, after converting the latter radiation quality indicator to the dose averaged LET, on the basis of the relation provided in Watt (1996) and adopted in Furusawa et al (2000) for the experimental data used in both approaches.
Implementations of those tables in TRiP-OER is then also feasible and straightforward, returning very small deviations in the survival profiles.
6. Conclusions and outlook
It has been shown that is possible and straightforward to improve the TRiP98 TPS in order to account for spatially inhomogeneous sensitivity due to hypoxia.
- A working version has been tested and now it is possible to provide OER tables in addition to RBE tables to the code.
- A semi-empirical map of OER dependence on LET (dose averaged) and pO2 has been provided and can be loaded into the program. The simple model used has been verified with independent experiments.
- The enhanced TPS version is able to return survival prediction on a given irradiation configuration as well as to preliminary compensate the required dose to obtain homogeneous coverage across the target.
- The latter dose compensation has been shown to work correctly also with multiple field optimization, opening the possibility to tune the LET components of simultaneous fields accordingly.
- Qualitative as well as near-quantitative agreement with extended volume ion beam irradiation experiments has been shown.
Additionally, indications have been provided to the use of several ions in treatment.
As for the experimental verification, while the pure  along the irradiated area, returned by TRiP-OER, is remarkably in agreement with the measurements, the absolute survival cannot be fully reproduced in the region of maximum LET gradient, in the given example, for the combined amplification of RBE prediction errors and experimental positioning error occurring exactly in that region. Nevertheless, the present approach does not claim to provide exact full biological effect calculation, rather to offer a tool, open also to importing different models, for using target oxygenation information in a full biophysical optimization, then maximally exploiting the specific capabilities of ion beam irradiation.
Furthermore, the non negligible difference in the resulting survival profiles of different tables coming from different OER modeling (see section 5), suggests to further investigate on modeling as well as to further perform experiments, especially for intermediate levels of oxygen pressure (0.15% to 0.5%) and for intermediate levels of LET. In order to let improve the model and fill the experimental gap, a collaborative project between NIRS and GSI has been established in the context of the International Open Laboratory for performing at HIMAC several experiments with different ions, in order to cover different ranges of LET, exactly at the intermediate pO2 values which are needed (Durante et al 2012). Also the importance of further investigation in mechanistic modeling of the oxygen effect is stressed. E.g., the slight dependence on ion type observed, points out the need of additional investigation on the track structure effects for higher Z ions. These efforts will be crucial to better understand and improve the efficiency of LET-aided reduction of hypoxia resistance, when implemented in this kind of adaptive treatment planning.
Another important factor that should be kept in mind is that, as mentioned in the introduction, chronic and acute hypoxia, which should be encountered in different parts of a tumor, result in considerably different effects. This difference in the OER has been measured in our group for x-rays (Ma et al 2011), for different pO2 levels, and has been initially addressed for ion beams at selected LET values (Ma et al 2013).
The clinical data implementation of the present work, briefly sketched in Scifoni et al (2012), is in progress and will be published separately, including plans on real clinical cases through FMISO and FAZA PET data. The possibility to merge the present TRiP-OER version with the multi-ion one (Krämer et al 2012a) toward a fully optimizable, multi-ion hypoxia-driven treatment planning, is promising to provide a perfect tool for multi-ion therapy sites, such as HIT and CNAO.
Acknowledgments
This work is funded by ULICE under the EU framework, contract no. 228436. W Tinganelli is funded by PARTNER project, EU contract no. 215840. N Ma is acknowledged for precious help in the experiments; Y Furusawa for providing corrected data; G Kraft, M Scholz, T Friedrich, M Horcicka, A Santiago, A Brahme, T Wenzl, N Bassler, A Lühr and G Fattori for multiple fruitful discussions.