
Abstract
Amyloid PET is useful for early and/or differential diagnosis of Alzheimer's disease (AD). Quantification of amyloid deposition using PET has been employed to improve diagnosis and to monitor AD therapy, particularly in research. Although MRI is often used for segmentation of gray matter and for spatial normalization into standard Montreal Neurological Institute (MNI) space where region-of-interest (ROI) template is defined, 3D MRI is not always available in clinical practice. The purpose of this study was to examine the feasibility of PET-only amyloid quantification with an adaptive template and a pre-defined standard ROI template that has been empirically generated from typical cases. A total of 68 subjects who underwent brain 11C-PiB PET were examined. The 11C-PiB images were non-linearly spatially normalized to the standard MNI T1 atlas using the same transformation parameters of MRI-based normalization. The automatic-anatomical-labeling-ROI (AAL-ROI) template was applied to the PET images. All voxel values were normalized by the mean value of cerebellar cortex to generate the SUVR-scaled images. Eleven typical positive images and eight typical negative images were normalized and averaged, respectively, and were used as the positive and negative template. Positive and negative masks which consist of voxels with SUVR ⩾1.7 were extracted from both templates. Empirical PiB-prone ROI (EPP-ROI) was generated by subtracting the negative mask from the positive mask. The 11C-PiB image of each subject was non-rigidly normalized to the positive and negative template, respectively, and the one with higher cross-correlation was adopted. The EPP-ROI was then inversely transformed to individual PET images. We evaluated differences of SUVR between standard MRI-based method and PET-only method. We additionally evaluated whether the PET-only method would correctly categorize 11C-PiB scans as positive or negative. Significant correlation was observed between the SUVRs obtained with AAL-ROI and those with EPP-ROI when MRI-based normalization was used, the latter providing higher SUVR. When EPP-ROI was used, MRI-based method and PET-only method provided almost identical SUVR. All 11C-PiB scans were correctly categorized into positive and negative using a cutoff value of 1.7 as compared to visual interpretation. The 11C-PiB SUVR were 2.30 ± 0.24 and 1.25 ± 0.11 for the positive and negative images. PET-only amyloid quantification method with adaptive templates and EPP-ROI can provide accurate, robust and simple amyloid quantification without MRI.
Export citation and abstract BibTeX RIS

Original content from this work may be used under the terms of the Creative Commons Attribution 3.0 licence. Any further distribution of this work must maintain attribution to the author(s) and the title of the work, journal citation and DOI.
1. Introduction
Beta-amyloid plaque (Aβ) accumulation in brain cortex is a pathological hallmark of Alzheimer's disease (AD) and is believed to begin before the onset of cognitive impairment (Klunk et al 2004, Sperling et al 2011, Johnson et al 2013). Aβ imaging with PET provides an important tool for the assessment of early and differential diagnosis of AD with the National Institute on Aging-Alzheimer's Association (NIA-AA) criteria (Ng et al 2007, McKhann et al 2011) and also used for screening of subjects and evaluation of responses to therapy in clinical trials of AD therapeutics (Doody et al 2014, Salloway et al 2014).
Quantification of amyloid deposition with standardized uptake value ratio (SUVR) has been generally performed to improve diagnosis and to monitor AD therapy, particularly in clinical research and trial (Lopresti et al 2005, Rinne et al 2010). Amyloid PET quantification typically requires an individual high-resolution MRI for spatial normalization into standard Montreal Neurological Institute (MNI) space (Evans et al 2012) and to generate a probability map of gray matter (Lundqvist et al 2013, Nordberg et al 2013). Although MRI is often used for normalization into MNI space where region-of-interest (ROI) template is defined, a high-resolution 3D-MRI is not always available in clinical practice (Lundqvist et al 2013, Bourgeat et al 2015). On the other hand, when MRI-based quantification is performed, the errors potentially occur in the process of gray matter segmentation and co-registration between MRI and PET images. Furthermore, geometric distortion and motion artifact of MRI might influence the accuracy of ROI definition (Imabayashi et al 2013). Therefore, a PET-only quantification method is desirable that does not rely on the availability of MRI.
Several previous studies have attempted to quantify amyloid deposition based on spatial normalization using PET image alone (Edison et al 2013, Zhou et al 2014). However, amyloid positive images and negative images have strikingly different activity distribution patterns, which hamper use of a single template image for all cases. Lundqvist et al and Bourgeat et al each has suggested an automated PET-only adaptive template method (Lundqvist et al 2013, Bourgeat et al 2015). These methods have reported accurate and robust quantification without the use of MRI. However, these previous studies have adopted manually defined ROI template or automatic-anatomical-labeling (AAL) ROI or FreeSurfer-based ROI (Lundqvist et al 2013, Su et al 2013, Schain et al 2014, Zhou et al 2014). These anatomical ROIs were not necessarily suitable for amyloid quantification because they were not generated voxel-wise over the regions that are apt to accumulate amyloid PET drugs in pathological conditions. On the other hand, the ROI defined manually on the co-registered MRI were also used to calculate SUVR mainly for clinical research (Lopresti et al 2005, Becker et al 2013, Lundqvist et al 2013). However, the manual ROI is less reproducible and requires a strenuous work. A ROI template characterizing voxel-wise amyloid specific regions may provide higher sensitivity and specificity.
The purpose of this study was to examine the feasibility of PET-only amyloid quantification with adaptive template and empirically determined amyloid-characteristic ROI.
2. Materials and methods
2.1. Brain MRI and PiB PET scans
This study was retrospective and handled MRI and PET images acquired in various clinical research projects on either AD or mild cognitive impairment (MCI) or cognitively normal subjects. All research projects had been approved by the ethics committee, and all subjects had signed an informed consent form for the respective research and the retrospective data analysis of this kind. The results of present data analysis did not influence clinical decision making.
Two sets of subject data were studied: the 1st set was for ROI generation and for comparison with conventional method, and the 2nd set was for testing the new method.
The first set consists of 34 subjects (6 AD subjects; 22 MCI subjects; 6 normal control subjects) who underwent 3D-MRI and 11C-PiB PET. T1-weighted 3D-SPGR transaxial images were acquired using a 1.5 Tesla SIGNA EXCITE (GE Healthcare, Milwaukee, WI) with the following parameters: TE 5 ms, TR 23 ms, slice thickness 2.0 mm, FOV 22.0 cm, flip angle 30°. For the PET study, the subjects had an intravenous injection of 571.6 ± 19.0 MBq of 11C-PiB and underwent PET emission scans for 20 min starting at 50 min post injection using a Discovery-690 PET/CT scanner (GE Healthcare, Milwaukee, WI) (Bettinardi et al 2011). The PET data were reconstructed using ordered-subset expectation-maximization (OSEM) algorithm with 4 iterations and 16 subsets. Gaussian filter with 5 mm FWHM was applied into reconstructed PET images, which is a 128 × 128 matrix with 2.0 mm pixels and 3.27 mm slice thickness. These parameters were determined based on phantom studies (Akamatsu et al 2016). The CT component of the Discovery-690 PET/CT scanner was a 16-multidetector CT scanner. The technical parameters of the CT scan were 120 kV, 200 mA, 0.5 s tube rotation, 18.75 mm/rot and 3.75 mm slice collimation. The CT images were used for attenuation correction.
The second set consists of 34 subjects (13 AD subjects, 8 MCI subjects, 13 normal control subjects), of which 10 underwent a PiB-PET/CT scan (566.9 ± 32.7 MBq) in the same way as the first set of subjects written above, and 24 underwent PiB-PET with a SET-3000 G/X PET scanner (Shimadzu Medical Systems, Kyoto, Japan) (Matsumoto et al 2006). For the latter 24 subjects, the PET data of 20 min duration between 50 and 70 min after injection were reconstructed using dynamic row-action maximum-likelihood algorithm (DRAMA) with 4 iterations and 0 filter cycles. Attenuation correction was performed using the 137Cs transmission data (Matsumoto et al 2006). Then the PET images were reconstructed to a 128 × 128 matrix with 2.0 mm pixels and 2.6 mm slice thickness. No MRI was taken for the 2nd set of subjects.
2.2. Visual interpretation
All PiB-PET images were visually interpreted and classified into positive or negative through consultation by two PiB-PET expert physicians. In the visual interpretation of PiB-PET images, regional PiB uptake for each of four cortical areas on each side (frontal lobe, lateral temporal lobe, lateral parietal lobe and precuneus/posterior cingulate gyrus) was evaluated as positive, equivocal or negative, according to the following J-ADNI criteria (Iwatsubo 2010): The area is positive if uptake clearly higher than white matter extends more than one gyrus of the cortical area; The area is equivocal if uptake slightly higher than or similar to white matter extends more than one gyrus of the cortical area, i.e. radioactivity extending beyond white matter to the cortical surface, or if a high uptake spot is observed but limited to one gyrus; The area is negative if uptake is lower than white matter. Cases with at least one positive area in any of the above 4 cortical areas are classified as positive. Otherwise, cases with at least one equivocal area in any of the above 4 cortical areas are classified as equivocal. Cases without positive or equivocal area in any of the above 4 cortical areas are classified as negative. In this study, equivocal scans were combined into positive scans. Note that striatal uptake was not used for the classification.
2.3. Amyloid positive and negative templates
We used the PMOD software ver3.4 (PMOD group, Switzerland) and MATLAB (The Mathworks, MA) for all image analyses. The PET image was rigidly registered to the MRI using the normalized mutual information method, and then was spatially normalized to the standard MNI T1 atlas using the same transformation parameters of individual MRI-based normalization. The AAL-ROI template was applied into normalized images on MNI space. All voxel values were normalized by the mean value of cerebellar cortex (AAL-ROI labeled as 'Cerebellum_Crus') to generate the SUVR-scaled images. Eleven typical positive images (4 AD and 7 MCI subjects with high PiB accumulation in all 4 cortical areas and striatum mentioned above) and eight typical negative images were averaged to generate positive and negative templates, respectively (figure 1).
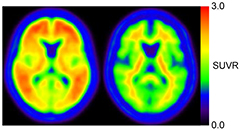
Figure 1. Positive (left) and negative (right) templates. Eleven typical positive images and eight typical negative images, which were spatially normalized by using individual MRI, were respectively averaged.
Download figure:
Standard image High-resolution image2.4. Empirically determined PiB-prone region-of-interest template (EPP-ROI)
Figure 2 shows the process of making an empirically PiB-prone ROI template (EPP-ROI). Voxels, in which PiB accumulation was higher than 1.7 in SUVR, were extracted from the positive template. Non-specific PiB accumulative voxels, which actually covers the white matter, were also extracted from the negative template based on the SUVR cutoff value of 1.7. We adopted the SUVR cutoff value of 1.7 to make non-specific PiB accumulations of the negative template fit the white matter of average MRI (figure 3) by discussions among nuclear medicine physicians and technologists. We then generated the EPP-ROI by subtracting the negative mask from the positive mask and further selecting voxels overlapping with one of the following AAL-ROIs (Tzourio-Mazoyer et al 2002) that were considered important: 'Precentral' (precentral gyrus), 'Rolandic_Oper' (rolandic operculum), 'Supp_Motor_Area' (supplementary motor area), 'Frontal_Sup' (superior frontal gyrus), 'Frontal_Mid' (middle frontal gyrus), 'Frontal_Inf' (inferior frontal gyrus), 'Rectus' (rectus gyrus), 'Cingulum_Ant' (anterior cingulate gyrus), 'Cingulum_Mid' (middle cingulate gyrus), 'Postcentral' (postcentral gyrus), 'SupraMarginal' (supramarginal gyrus), 'Angular' (angular gyrus), 'Parietal' (superior and inferior parietal gyrus), 'Cingulum_Post' (posterior cingulate gyrus), 'Precuneus' (precuneus), 'Calcarine' (calcarine fissure and surrounding cortex), 'Cuneus' (cuneus), 'Occipital' (occipital gyrus), 'Fusiform' (fusiform gyrus), 'Temporal' (superior, middle and inferior temporal gyrus), 'Putamen' (putamen) and 'Pallidum' (globus pallidus) (figure 4).
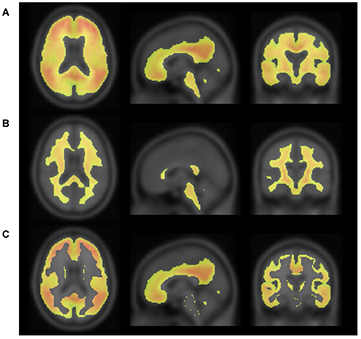
Figure 2. Positive (A) and negative (B) masks, consisting of voxels with SUVR of more than 1.7. PiB-prone areas were generated by subtracting the negative mask from the positive mask (C).
Download figure:
Standard image High-resolution image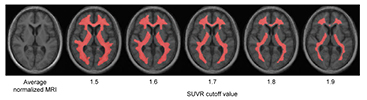
Figure 3. Average normalized MRI of eight amyloid-negative subjects and PET/MR fusion images, in which averaged PiB-PET images were the binarized with variable SUVR cutoff values.
Download figure:
Standard image High-resolution image
Figure 4. The PiB-prone ROI (EPP-ROI), which were empirically generated from PiB images and AAL-ROI labels.
Download figure:
Standard image High-resolution imageThe cerebellar cortex region, which was created by trimming the outside of AAL-ROI labeled as 'Cerebellum_Crus' areas to minimize the influence of the partial volume effect, was included in the EPP-ROI as a reference region.
2.5. MRI-based quantification method
Probability map of gray matter was generated based on the individual MRI using PMOD software. The PET images were spatially normalized to the standard MNI T1 atlas using PET/MRI coregistration and MRI-based spatial normalization. The AAL-ROI template and EPP-ROI template were respectively applied to the PET images using the inverse transformation, in which the AAL-ROI template was defined as the entire area of each of those AAL-ROIs listed in the previous section. We computed the SUVR as the volume-weighted average of regional activity normalized by the mean activity of the cerebellar cortex (AAL-ROI labeled as 'Cerebellum-Crus').
We calculated the SUVR using the AAL-ROI and the EPP-ROI, respectively, on the first set of subject images.
2.6. PET-only quantification method with adaptive template method
Figure 5 shows the workflow of PET-only quantification method. First, the PET images were non-rigidly normalized to the positive and negative template, respectively. Second, the normalized cross-correlation (NCCz) was calculated between the normalized PET image and the respective template on each axial slice (z) that contains brain tissue as follows:
where x and y are image matrix size. Then NCCz was averaged across the slices to obtain NCC. The normalization template having higher NCC was adopted. Third, the EPP-ROI was inversely transformed to individual PET images. We calculated the SUVR and evaluated differences among three methods for the first set of subjects. Table 1 shows the property of the three methods.

Figure 5. Image processing workflow of PET-only quantification method. Upper two images are defined in the original PET space. The red line surrounds images defined in the MNI standard space.
Download figure:
Standard image High-resolution imageTable 1. Summary of three types of quantification methods.
| Process | MRI-based AAL-ROI | MRI-based EPP-ROI | PET-based EPP-ROI |
|---|---|---|---|
| Gray matter segmentation | MRI-based | — | — |
| Spatially normalization | MRI-based | MRI-based | PET-based with AT |
| Coregistration | NMI method | NMI method | — |
AT: adaptive template method. NMI: Normalized mutual information method.
2.7. Comparison of new method with visual interpretation
We applied the PET-only quantification method to the 2nd set of 34 11C-PiB scans in order to evaluate whether the method could correctly categorize 11C-PiB scans as positive or negative in contrast to visual categorization.
2.8. Statistical analysis
In all statistical analyses, we used the JMP software. Coefficient of correlation was calculated to evaluate the relationship between the SUVR calculation methods.
3. Results
Table 2 shows the SUVR obtained by three methods. The higher SUVR was obtained with EPP-ROI compared with the AAL-ROI when MRI-based normalization was used. On the other hand, the SUVR were almost the same between MRI-based and PET-based methods as long as EPP-ROI was employed. Figure 6 shows the representative ROI setting of the three methods on a PiB positive subject. MRI-based AAL-ROI protruded from the cortex while the EPP-ROI was localized over the PiB accumulative cortical areas. In PET-based normalization process, the NCC value chose the 'correct' template corresponding to the actual visual classification for all negative images. For the positive images, accordance was found for 87% of the subjects (20/23 cases).
Table 2. The PiB SUVR obtained by three methods.
| Methods | SUVR (PiB) | |
|---|---|---|
| Positive (n = 23) | Negative (n = 11) | |
| MRI-based AAL-ROI | 1.96 ± 0.32 | 1.23 ± 0.07 |
| MRI-based EPP-ROI | 2.19 ± 0.37 | 1.30 ± 0.09 |
| PET-based EPP-ROI | 2.21 ± 0.39 | 1.29 ± 0.06 |
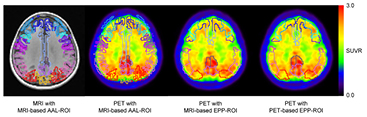
Figure 6. MRI and PET superimposed with three types of ROI for a representative 'positive' subject. MRI-based AAL-ROI protruded from cortical surface due to gray matter segmentation error. On the other hand, the EPP-ROI was localized within the cortical areas.
Download figure:
Standard image High-resolution imageFigure 7 shows the correlation between SUVRs obtained by MRI-based AAL-ROI method and MRI-based EPP-ROI method (A) and the correlation between SUVRs obtained by MRI-based EPP-ROI method and PET-based EPP-ROI method (B). Both showed a high correlation (R = 0.99, 0.99). Figure 8 shows individual SUVR values computed with the three methods in relation to clinical diagnosis. Most of the patients clinically diagnosed with AD or MCI showed higher SUVR. All normal control subjects showed lower SUVR. MRI-based EPP-ROI method provided higher SUVR than MRI-based AAL-ROI, while PET-based EPP-ROI and MRI-based EPP-ROI presented almost identical SUVR values.
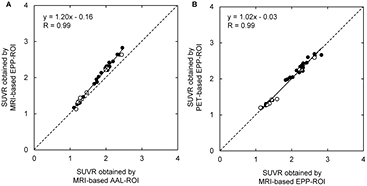
Figure 7. Correlation between MRI-based AAL-ROI SUVR and MRI-based EPP-ROI SUVR (A) and corresponding correlation between MRI-based EPP-ROI SUVR and PET-based EPP-ROI SUVR (B). Black dots indicated subjects that were used to generate positive or negative templates.
Download figure:
Standard image High-resolution image
Figure 8. Individual SUVR values for the first set subjects in relation to clinical diagnosis that were computed with three quantification methods. The EPP-ROI provided higher SUVR than the AAL-ROI especially for the positive subjects. Furthermore, the EPP-ROI made a clearer differentiation between positive and negative subjects.
Download figure:
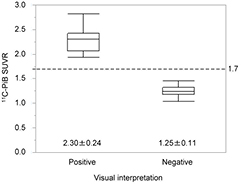
Standard image High-resolution imageFigure 9 shows the results of 11C-PiB SUVR on the 2nd set of subjects obtained by PET-based EPP-ROI method. All subjects were correctly categorized into positive (n = 19) and negative (n = 15) using cutoff value of 1.7.
Figure 9. Box plots of 11C-PiB SUVR for positive and negative groups. All subjects were correctly categorized into positive and negative based on cutoff value of 1.7.
Download figure:
Standard image High-resolution image
4. Discussion
In this study, we have generated an empirically determined PiB-prone ROI (EPP-ROI) and have examined PET-only quantification with adaptive template method. The PET-only amyloid quantification method provided comparable SUVR values to the MRI-based SUVR and categorized 11C-PiB scans exactly the same as visual assessment.
We generated empirically PiB-prone ROI based on actual human PiB images. The results showed high correlation between SUVR obtained with MRI-based AAL-ROI and EPP-ROI (R = 0.99). The EPP-ROI provided higher SUVR than the AAL-ROI irrespective of positive or negative images, especially in positive images. This difference is considered to arise from exclusion of the voxels adjacent to the contour of the cortical area that are included in AAL-ROI, making EPP-ROI less sensitive to partial volume effect and normalization error. In a case with an error in the MRI-based gray matter segmentation as shown in figure 6, AAL-ROI extends beyond the cortical surface, leading to underestimation of SUVR. On the other hand, the EPP-ROI template is considered to provide more accurate and reproducible SUVR because it was derived from the cortical accumulation pattern of actual PiB images and does not contain voxels on the brain surface or gray–white border. Therefore the EPP-ROI has a potential to improve quantitative accuracy of amyloid quantification.
In this study, we adopted the SUVR cutoff value of 1.7 to make the EPP-ROI cover only amyloid-specific areas. We preliminarily generated the ROI template based on the SUVR cutoff value of 2.0 and calculated the SUVR for the 20 subjects of the 1st set as a pilot experiment. Average SUVR computed with the ROI template (made from the cutoff value of 2.0) were 2.23 for the positive subjects and 1.36 for the negative subjects. On the other hand, those computed with the EPP-ROI (cutoff value of 1.7) were 2.18 and 1.30, respectively. Since the difference between these two was relatively small (<5%), SUVR may not be so sensitive to selection of the cutoff level. Conversely, if we choose a smaller cutoff value, the ROI template may become smaller and may be more localized in cortical areas. However, this may potentially trim important amyloid-specific regions, particularly if a PET camera with poor spatial resolution is used.
When the EPP-ROI was used, the PET-based spatial normalization method with adaptive template provided almost the same SUVR as the MRI-based method. This result indicates that PET-based normalization with adaptive template method exhibited equivalent performance as the MRI-based normalization. Lundqvist et al and Bourgeat et al have also evaluated the PET-based normalization using adaptive template in order to quantify amyloid deposition (Lundqvist et al 2013, Bourgeat et al 2015). While they used more than two types of templates, we adopted only two templates. We believe that two types of templates provided a sufficient accuracy for amyloid PET image normalization because our PET-based normalization was comparable to the MRI-based normalization results (table 2). Furthermore, our PET-only quantification method is simple and robust because it does not rely on MRI segmentation and that it applies the EPP-ROI to original PET images without interpolation. ROI analysis in the original PET space can minimize the risk of reducing quantitative accuracy and reproducibility (Lundqvist et al 2013). Edison et al and Saint-Aubert et al have suggested that PET-only quantification method is adequate for clinical use (Edison et al 2013, Saint-Aubert et al 2014). Our method is considered to be useful especially for clinical practice.
We tested the PET-only quantification method by applying it to a 11C-PiB image set acquired with two different PET cameras. As a result, all subjects were correctly categorized into positive and negative based on the cutoff value of 1.7. Categorization of 11C-PiB scans by the PET-only quantification method showed exact concordance with the visual read results. Therefore, the PET-only quantification method could help interpretation of amyloid images based on these results. This PET-only quantification method could be generalized to any other amyloid tracers if their specific templates are created, and the idea of standardizing the scaling of quantitative values may also be applicable (Klunk et al 2015).
5. Conclusion
The PET-only amyloid quantification with adaptive template and EPP-ROI provides accurate, robust, simple and automated amyloid quantification without MRI. In addition, categorization of amyloid PET scans using an SUVR threshold showed good concordance with the visual read results. The proposed quantification method could help interpretation and quantitative evaluation of amyloid PET images and be useful for clinical practice as well as for research.
Acknowledgments
This study was supported by JSPS KAKENHI Grant Number 16K19882.