
Abstract
The spill-in counts from neighbouring regions can significantly bias the quantification over small regions close to high activity extended sources. This effect can be a drawback for 18F-based radiotracers positron emission tomography (PET) when quantitatively evaluating the bladder area for diseases such as prostate cancer. In this work, we use Monte Carlo simulations to investigate the impact of the spill-in counts from the bladder on the quantitative evaluation of prostate cancer when using 18F-Fluorcholine (FCH) PET and we propose a novel reconstruction-based correction method. Monte Carlo simulations of a modified version of the XCAT2 anthropomorphic phantom with 18F-FCH biological distribution, variable bladder uptake and inserted prostatic tumours were used in order to obtain simulated realistic 18F-FCH data. We evaluated possible variations of the measured tumour Standardized Uptake Value (SUV) for different values of bladder uptake and propose a novel correction by appropriately adapting image reconstruction methodology. The correction is based on the introduction of physiological background terms on the reconstruction, removing the contribution of the bladder to the final image. The bladder is segmented from the reconstructed image and then forward-projected to the sinogram space. The resulting sinograms are used as background terms for the reconstruction. SUVmax and SUVmean could be overestimated by 41% and 22% respectively due to the accumulation of radiotracer in the bladder, with strong dependence on bladder-to-lesion ratio. While the SUVs measured under these conditions are not reliable, images corrected using the proposed methodology provide better repeatability of SUVs, with biases below 6%. Results also showed remarkable improvements on visual detectability. The spill-in counts from the bladder can affect prostatic SUV measurements of 18F-FCH images, which can be corrected to less than 6% using the proposed methodology, providing reliable SUV values even in the presence of high radioactivity accumulation in the bladder.
Export citation and abstract BibTeX RIS

Original content from this work may be used under the terms of the Creative Commons Attribution 3.0 licence. Any further distribution of this work must maintain attribution to the author(s) and the title of the work, journal citation and DOI.
Introduction
Positron emission tomography (PET) is a non-invasive imaging technique that visualizes the distribution of different molecules in the body providing functional and molecular information for different tissues. PET is routinely used for staging and treatment response evaluation in oncology (Jeraj et al 2008, Ben-Haim et al 2009) with fluorodeoxyglucose (FDG) as the most common radiotracer of choice. Despite the fact that traditional evaluation is usually performed by visual inspection of the images, the current potential of PET relies on its capability to provide quantitative information (El Naqa et al 2007), usually provided by a semi-quantitative parameter known as Standard Uptake Value (SUV). This parameter provides relatively objective tumour characterization, reliable differential diagnosis, and earlier evaluation and monitoring of treatment response (Boellaard 2009, Adams et al 2010).
Regarding prostate cancer, with around 250 000 new cases each year in the United States and mortality around 12% (Siegel et al 2012), an efficient and early detection of the disease is critical both for successful patient care and for the cost-efficiency of the health care systems. Imaging plays a critical role in correct diagnosis and staging, since the tumour treatment must be selected in strict dependence on the clinical stage and risk profile (Jadvar 2009). In this context FDG PET has shown very poor sensitivity and specificity on prostate cancer mainly due to two critical factors: some prostatic tumours do not show an elevated glucose consumption; many infectious processes such as prostatic benign hyperplasia show an increased FDG uptake producing false positives (Salminen et al 2002, Jadvar 2011).
During the last decade the development of novel radiotracers provided PET a more relevant role in prostate imaging. The most widespread of these tracers are those based on choline labelled with different radioisotopes (Hara et al 1998, DeGrado et al 2001, Chen et al 2012). Choline is a compound that supports the synthesis of cell membranes and thus proliferation. In the case of prostate cancer, it has been strongly related with elevated levels of choline uptake and certain choline metabolites, which can be used as potential prognostic biomarkers for the management of prostate cancer patients (Awwad et al 2012). The Fluorocholine (FCH) molecule labelled with 18F showed the highest biological compatibility with choline leading to a behaviour in the body very similar to that of natural choline (Hara 2001). An example of carcinoma detection on 18F-FCH PET with bladder accumulation is shown on figure 1, where the tumour is pointed with an arrow. A well-known drawback of 18F-FCH and other 18F-based radiotracers is their variable urinary excretion with high accumulation in the bladder, which can affect detectability (Schoder and Larson 2004, Massaro et al 2012). Reported solutions in order to mitigate this effect are mainly aimed at early acquisitions or bladder voiding by urinary catheterization (Witney et al 2012), but these solutions are not ideal for several reasons. On the one hand, the accumulation of radiotracer in the bladder is a patient-dependent process so early acquisitions cannot guarantee avoiding bladder accumulation (Massaro et al 2012). On the other hand, catheterization for bladder voiding is an invasive process that has been identified as a potential source of infection (Lo et al 2014). Despite this serious shortcoming, 18F-FCH is currently the radiotracer of choice for prostate PET imaging with indications for diagnosis, staging, restaging, and therapy monitoring in prostate cancer (Hodolic 2011, Beheshti et al 2013, Chondrogiannis et al 2014). The usage of bladder voiding, early acquisitions or both is highly centre-dependent.
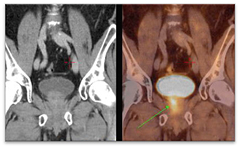
Figure 1. 18F-FCH PET/CT detects a metabolically active prostate carcinoma, pointed with an arrow. Image is reproduced with consent from Vivantes International Medicine (Am Nordgraben 2, Berlin, Germany).
Download figure:
Standard image High-resolution imageRegarding quantification, 18F-FCH PET images have shown high SUV variability in normal prostate tissue (SUV 3.4–4.1), prostate cancer (SUV 1.7–6.2), and local recurrence (SUV 2.7–12.42) (Tindall and Scardino 2011). The reasons for this variability are still unclear, since SUV can be affected by different factors. Verwer et al (2015) modelled the 18F-FCH-PET kinetics of lymphatic and haematogenous metastases and proposed modifications in the SUV calculations to address problems related with 18F-FCH-PET kinetic studies. In this context, additional work is required for evaluating technical issues related to acquisition, reconstruction, and quantification (Boellaard 2009, Adams et al 2010, Silva-Rodríguez et al 2015). Particularly important in 18F-FCH-PET imaging might be the overestimation due to the inclusion of spill-in counts originally coming from separated high-activity regions such as the bladder. This effect has been defined in the literature as spill-in (Bai et al 2013) or shine-through effect (Liu 2012) and included in a broader definition of the partial volume effect (PVE) by different authors (Soret et al 2007). This effect has been widely reported in cardiac SPECT (DePuey et al 2012), dual tracer parathyroid scintigraphy (Wu et al 2003, Liu et al 2005), and 18F-FDG PET (Liu 2012, Du et al 2013). In PET, different cases have been reported to affect the quantification of lung tumours when the lesions are in the vicinity of the myocardium or the quantification of prostate tumours close to the urinary bladder (figure 1). Despite multiple methodologies that have been proposed for the correction of the underestimation produced by the spill-out counts in small regions (Erlandsson et al 2012), which responds to the most traditional definition of PVE (Rousset et al 1998), the effect of spill-in counts has been less studied and it is not routinely corrected for in PET studies.
The aim of this work is first to study the impact of the spill-in counts from the bladder on the quantitative evaluation of 18F-FCH PET studies using realistic anthropomorphic computational simulations, and second, to propose a correction method for this effect when necessary. To the best of our knowledge, further analyses on this effect or similar correction methods have not been previously reported in literature.
Methods
Both geometric and anthropomorphic physical phantoms have been widely used for investigating the impact of different factors on the output PET images, enabling for us applications that cannot be performed with patient studies. Nevertheless, they have several important limitations, such as reduced flexibility for changing shapes and volumes of the internal structures, high cost, and cumbersome use. An alternative is the use of digital phantoms (Zaidi and Xu 2009), so that simulated PET studies can be generated from the realistic projection of digital phantoms by using computer simulation techniques. In this work, we generated a database of 18F-FCH PET studies by Monte Carlo (MC) simulation of a modified version of the XCAT2 phantom (Extended Cardiac-Torso Phantom Version 2.0) (Segars et al 2010). Figure 2 shows a general layout of the experiment, which allowed us to investigate the impact of bladder uptake on prostate SUV values in a realistic and well-controlled framework.
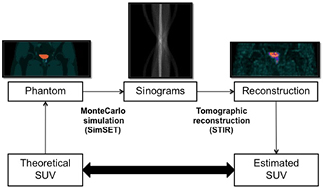
Figure 2. General layout of the simulation experiment.
Download figure:
Standard image High-resolution imageAn anthropomorphic phantom for 18F-FCH PET imaging
A modified version of the anthropomorphic XCAT2 phantom (Segars et al 2010) was obtained by including typical 18F-FCH distribution, uptake variations for the bladder, and prostatic lesions. All phantoms were based on the anatomy of an average Caucasian adult male human (172 cm, 76 kg), and the uptake of 18F-FCH for different tissues was obtained from bibliography, which provides activity concentrations, contrast ratios, or SUV variations with time measured on patient studies. These values were used to provide the corresponding activity indices for the simulated phantoms (DeGrado et al 2002, Schillaci et al 2010, Giussani et al 2012). A hot spot (24 ml) was added to the prostatic left lobe in order to simulate a primary prostate tumour or local recurrence. The phantoms were generated with different combinations of prostate tumour and bladder activities: tumours with SUVs of 3.03 and 6.06 g l−1 and bladders with SUVs of 1.1, 3.03, 7.58, 13.64, 15.92, and 18.19 g l−1 and a fixed volume of 500 ml. Additionally, different bladder volumes of 100, 250, 500, and 750 ml were also simulated for the lesion SUVs of 3.03 and 6.06 g l−1 and a bladder SUV of 7.58 g l−1. The simulated activity was 370 MBq distributed over the whole phantom for all the simulations, following the protocols used for patients at our institution.
Monte Carlo simulation
Simulated PET studies were generated by MC simulation of the previously described anthropomorphic phantoms. We used the open access package SimSET version 2.9.1 (Simulation System for Emission Tomography) (Harrison et al 1997, Harrison 2010), which includes simulation code for relevant processes in PET imaging related with positrons and their annihilation (positron range and non-colinearity) and emitted photons (photoelectric effect, coherent scattering, and incoherent scattering) for energies of interest in nuclear medicine (below 1 MeV). Detector geometry was based on previous MC models for the General Electric (GE) Advance NXi scanner (Barret et al 2005, Silva-Rodríguez et al 2014), the scanner present at our Nuclear Medicine Department. Realistic acquisition times of 300 seconds per bed were simulated. The number of simulated photons was carefully adjusted to obtain realistic signal-to-noise ratios, and the simulations were performed on a computer cluster with computer nodes including a Xeon® Processor E5-2418L (Intel Corporation, Santa Clara, California, United States) and 8 Gb DDR3 RAM. Each simulation was performed on an individual node divided on eight sub-processes in order to use the eight threads of the processor. Variance reduction tools on SimSET were activated to improve simulation computational speed. Each simulation consumed around 200 h of CPU time adding the time used by the eight processes. Only the pelvic bed was simulated, including radioactivity outside of the field of view (FOV). Decay during the 5 min acquisition was not considered.
Reconstruction
Attenuation and scattered photons were pre-corrected before the reconstruction, following the methodology followed for the particular system by the scanner manufacturer (Bailey and Meikle 1994). Five noise realizations of each lesion/bladder values combination were performed for statistical analysis purposes. The reconstruction was performed with ordered subset expectation maximization (OSEM) using STIR library release 2.2 (Software for Tomographic Image Reconstruction) (Thielemans et al 2012). The algorithm uses the ordered subsets (OS) scheme for convergence acceleration and data update during iterations (Hudson and Larkin 1994). Reconstruction parameters were tuned to fit those in the scanner. Sixteen full iterations were performed (32 sub-iterations, 2 subsets), and no post-filtering was applied. Matrix and voxel size of the reconstructed images were 128 mm × 128 mm × 35 mm and 4.3 mm × 4.3 mm × 4.47 mm respectively. The entire simulation and reconstruction procedure was described and validated comparing the results of real and simulated NEMA-NU 2-2007 tests (Silva-Rodríguez et al 2014).
Correction method for spill-in counts effect
For the current work, we have modified the original OSEM algorithm in equation (1), where  is the value of the reconstructed image at pixel j for the n iteration,
  is the measured projection at the i bin, and
  is the detection probability of photons from pixel j to projection bin i, for including a novel practical method for bladder uptake correction. The estimation of
  is based on the multiple ray-tracing techniques included in the STIR library and it was chosen in order to reproduce the GE Advance protocols. No dedicated Point-Spread-Function (PSF) was included for the particular scanner in the
  .
.

The method requires an independent estimate of the bladder volume, shape, and activity that is obtained from the reconstructed image. An operator drew an ROI R visually containing the activity in the bladder. The segmented bladder was then obtained as shown in equation (2), where  is the ROI pixel value (0 or 1) for pixel j,
  the final reconstructed image value and
  the pixel value on the segmented bladder,
  . Different operators manually delineated the ROIs for each simulation, so that the corrected image measurements include potential variability induced by manual delineation of the bladder. The segmented bladder,
  , was then analytically forward-projected into the sinogram space following equation (3), where
  is the contribution of the bladder to bin i. This contribution is then included in the reconstruction algorithm as a background term as shown in equation (4). A final reconstruction is performed providing reconstructed images without the bladder contribution.


This approach is inspired by the methodology to correct physiological background radioactivity on dynamic acquisitions originally proposed by Tsoumpas and Thielemans (2009). A schematic layout of the process can be observed on figure 3.

Figure 3. Layout of the correction method process. The original sinograms are reconstructed using STIR. Afterwards, the bladder is segmented and then projected using the STIR analytical projector used inside the reconstruction. Finally, the image is reconstructed again using the obtained sinograms as a background term, obtaining the corrected images without the bladder contribution.
Download figure:
Standard image High-resolution imageTumour quantification
Following the clinical methodology, SUVmax and SUVmean were measured for quantifying the prostatic lesion. In order to calculate the SUVmax, the operator delineated an ROI containing the prostate lobe with the tumour, and the pixel with the maximum concentration was obtained. For SUVmean, the original phantom attenuation map was used as an anatomical reference to draw an ROI accurately containing the tumour, and the SUVmean was obtained as the average concentration of this ROI.
Results
Impact of bladder uptake
As an example, figure 4 shows the reconstructed images of the tumour with SUV 3.03 g l−1 and different bladder uptakes ranging from 1.01 to 15.92 g l−1 using a full range scale. As expected, an increase in bladder uptake is a counterpart for detectability, so that the tumour with SUV value of 3.03 g l−1 is clearly observed for bladder uptake of 1.01 g l−1 but not for high bladder uptakes.

Figure 4. Reconstructed images of the XCAT2 phantom for different bladder uptakes ranging from 1.01 to 18.19 g l−1 and tumour SUV of 3.03 g l−1.
Download figure:
Standard image High-resolution imageFigure 5 shows the measured tumour SUVmax and SUVmean for different bladder uptakes ranging from 1.01 to 18.19 g l−1 obtained from the simulated studies with theoretical tumour SUVs of 3.03 and 6.06 g l−1. It is observed that measured tumour SUVs values were significantly increased with respect to the originally measured tumour SUV value when bladder SUV is increased. Biases of the values are shown as percentages on table 1. Measured SUVmean values underestimated the theoretical SUV in all cases, due to the small tumour size. The results were compared to the SUVmean without bladder uptake (simulated bladder uptake 1.01 g l−1) in order to evaluate repeatability. The uncertainty bars in the figure were calculated for both SUVmax and SUVmean as the standard deviation (STD) of the SUV measured for each of the five repetitions performed for each case. It can be derived from the results on figure 5 that this effect is particularly important when simulated bladder SUV is higher than theoretical tumour SUV, and that SUVmean is less sensitive to this particular effect than SUVmax. The fact that the maximum bias in the same range of bladder values is around half for a lesion with two times the simulated SUV (23.4% versus 41.3% for SUVmax and 10.8% versus 22.2% for SUVmean) is a suggestion of a strong dependency of the effect on the bladder/tumour ratio.
Table 1. Biases of the measured tumour SUVmax and SUVmean for all bladder and tumour combinations.
| Bladder SUV (g l−1) | Simulated tumour SUV (g l−1) | SUVmax bias (%) | SUVmean bias (%) |
|---|---|---|---|
| 1.01 | 3.03 | 1.7 | 0 |
| 3.03 | 3.03 | 5.6 | 9.1 |
| 7.58 | 3.03 | 19.8 | 13.1 |
| 13.64 | 3.03 | 24.1 | 16.7 |
| 15.92 | 3.03 | 27.4 | 20.2 |
| 18.19 | 3.03 | 41.3 | 22.2 |
| 1.01 | 6.06 | −2.3 | 0 |
| 3.03 | 6.06 | 0.1 | −1.8 |
| 7.58 | 6.06 | 0.7 | 0.8 |
| 13.64 | 6.06 | 7.9 | 6 |
| 15.92 | 6.06 | 16.2 | 8.5 |
| 18.19 | 6.06 | 23.4 | 10.8 |

Figure 5. Variations on measured SUVs due to the spill-in counts from the bladder on tumours of theoretical SUVs of 3.03 and 6.06 g l−1 before the correction. SUVmax is shown on the left, and SUVmean on the right. Solid lines represent the simulated SUV on the left and the SUVmean without bladder uptake on the right.
Download figure:
Standard image High-resolution imageImpact of bladder volume
Figure 6 shows variations of the measured SUVmax with bladder volumes ranging from 100 to 750 ml, for simulated tumour SUVs of 3.03 and 6.06 g l−1 and bladder SUV of 7.58 g l−1. Our results did not show any important variations with the bladder size for the analysed volumes ranges.

Figure 6. Variations of the measured SUVmax with bladder volume on prostatic tumours of theoretical SUVs of 3.03 and 6.06 g l−1. Solid lines represent the simulated SUV. Uncertainty for each point was calculated from the statistical variations from five realizations of the simulation.
Download figure:
Standard image High-resolution imageCorrection method
The proposed correction method was applied to all the simulated images and SUV measurements were performed again over the corrected images. Figure 7 shows an example of the visual effect of the correction and the improvement of detectability. The bladder has disappeared and the tumour is observed more clearly on the final image.

Figure 7. Visual impact of the correction method. On the top row: coronal (left), axial (centre) and sagittal (right) views of the uncorrected images are shown for bladder SUV of 7.58 g l−1 and tumour SUV of 3.03 g l−1. On the bottom row: views of the corrected images without bladder contribution for the same case. Al the images are in the same scale, indicated on the right-hand-side of the image.
Download figure:
Standard image High-resolution imageRegarding quantification, figure 8 shows the effect of the correction on quantification for lesions SUVs of 3.03 and 6.06 g l−1, showing plots of the values obtained with and without the correction. It can be observed that the error induced by the bladder has disappeared after correction. The biases induced by the bladder, shown in table 2, decreased significantly, presenting values fewer than 4% for SUVmean and fewer than 6% for SUVmax. It is observed in the uncertainty bars that the correction did not decrease the repeatability of the measurement.
Table 2. Bias of the measured tumour SUVmax and SUVmean for the bladder and tumour combinations including values for corrected and uncorrected images.
| Bladder SUV (g l−1) | Simulated Tumour SUV (g l−1) | SUVmax bias (%) | Corrected SUVmax bias (%) | SUVmean bias (%) | Corrected SUVmean bias (%) |
|---|---|---|---|---|---|
| 1.01 | 3.03 | 1.7 | 1.7 | 0 | 0 |
| 3.03 | 3.03 | 5.6 | 4.3 | 9.1 | 2.0 |
| 7.58 | 3.03 | 19.8 | 5.5 | 13.1 | 0.5 |
| 13.64 | 3.03 | 24.1 | 2.1 | 16.7 | −2.0 |
| 15.92 | 3.03 | 27.4 | 0.5 | 20.2 | −3.5 |
| 18.19 | 3.03 | 41.3 | 4.0 | 22.2 | 0.5 |
| 1.01 | 6.06 | −2.3 | −2.3 | 0 | 0 |
| 3.03 | 6.06 | 0.1 | 1.8 | −1.8 | −1.8 |
| 7.58 | 6.06 | 0.7 | 2.0 | 0–8 | 0.8 |
| 13.64 | 6.06 | 7.9 | 0.8 | 6.0 | −2.8 |
| 15.92 | 6.06 | 16.2 | 1.7 | 8.5 | −1.8 |
| 18.19 | 6.06 | 23.4 | 2.7 | 10.8 | −0.2 |
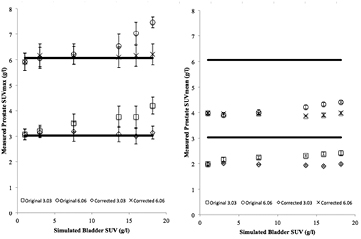
Figure 8. Variation on measured SUVs due to the bladder on prostatic tumours of theoretical SUVs of 3.03 and 6.06 g l−1 before and after the correction. SUVmax is shown on the left, with SUVmean plotted on the right. The crosses represent the corrected values while the circles represent the uncorrected measurements. Solid lines represent the simulated SUV on the left and the SUVmean without bladder accumulation on the right (for graphic representation convenience). Uncertainty for each point was calculated from the statistical variations from five repetitions of the simulation.
Download figure:
Standard image High-resolution imageIn order to validate the impact of the correction on the convergence of the reconstruction method, we selected the case of the tumour SUV of 3.03 g l−1 and bladder SUV of 7.58 g l−1 (figure 7). Figure 9 shows both the SUVmean and  defined in equation (5), up to 64 sub-iterations.

 has values of 1.44% and 1.56% for 16 sub-iterations, 0.26% and 0.34% for 32 sub-iterations, and 0.18% and 0.24% for 64 sub-iterations for uncorrected and corrected images respectively, showing that the convergence of the reconstruction is similar for both corrected and uncorrected images and that the chosen 32 sub-iterations are reasonable for ensuring the convergence even when applying the proposed correction method.

Figure 9. SUVmean (up) and  for different numbers of iterations and for corrected and uncorrected images.
Download figure:
Standard image High-resolution image
Discussion
Bladder accumulation is a well-known drawback for 18F labelled radiotracers in general. When using 18F -FCH, this problem is usually solved by performing very early acquisitions or by bladder voiding using a catheter (Witney et al 2012), but these solutions are not optimal. On the one hand, the accumulation of radiotracer in the bladder is a physiological process, so it is patient-dependent, and early acquisitions have proven to be ineffective. Massaro et al (2012) concluded that the earlier and/or dynamic acquisitions do not provide further relevant information to change the exam interpretation. On the other hand, the use of a catheter for bladder voiding is effective, but it has been recognized as a potential source of infection (Lo et al 2014), and it is an invasive and patient disturbing process, when imaging should be kept as a non-invasive technique whenever possible. In this investigation, we have developed and tested a novel software-based correction method that allows us to correct the effects of bladder accumulation on 18F-FCH PET, and that is potentially applicable to other situations. This methodology expands the scope of the work presented by Tsoumpas and Thielemans (2009).
The first step was to characterize the effect of bladder accumulation over the evaluation of tumours located in the region. The first consequence of this accumulation, the loss of detectability (Schoder and Larson 2004) on the bladder region is well known, observed in figure 4. Additionally, Liu (2012) reported that this accumulation could also have an impact on quantification values caused by shine-through effect or spill-in, presenting some clinical cases. In order to assess this effect on 18F-FCH studies, we designed a Monte Carlo simulation experiment, which produced images of the XCAT2 anthropomorphic phantom with a hot spot (24 ml) on the prostatic left lobe for different combinations of bladder accumulation intensities and volumes. The results of this analysis, shown in figure 5, revealed that the measured SUV values could be biased as much as 41.3% for SUVmax and 22.2% for SUVmean when the bladder SUV varies on a range from 1.01 to 18.19 g l−1, with strong dependence on bladder/lesion ratio. No remarkable variations of the measured SUV were found when the bladder volume ranges from 100 to 750 ml, as it is observed on figure 6, pointing out that the effect is independent of the size of the secondary source. These first results reveal that the quantification on the prostatic area is very sensitive to variations in bladder accumulation, which is dependent on technical and uncontrollable physiological factors, suggesting that uncorrected 18F-FCH might not be an appropriate radiotracer for quantification of tumours in this area, with 11C-labelled choline analogues providing a more reliable solution. These conclusions provide supporting evidence of additional 18F-FCH quantification problems, recently reported by Verwer et al (2015). The obtained SUV values should be taken and used with precaution when any presence of radiotracer is observed in the bladder, especially if its intensity is higher than the intensity of the lesion. The prevention of this effect with bladder voiding or the usage of a proper correction method is mandatory. The results also showed a systematic underestimation of the SUVmean values, most likely related to the partial volume effect (PVE) (Soret et al 2007) due to the small tumour size. This underestimation is common on clinical PET, but it is not a shortcoming for the use of SUVmean in the clinic, where the most concerning issue is usually SUV repeatability (Silva-Rodríguez et al 2015).
After this in-depth analysis of the bladder uptake impact, we proposed a correction method. The method was based on the hypothesis that spill-in counts from the bladder could be corrected with appropriate modification of the reconstruction process. The bladder was segmented from the conventional reconstructed PET image using a manually drawn ROI. After the segmentation, the bladder was analytically projected with the same projector that was used for the iterative reconstruction, generating new analytical sinograms of the bladder only. Segmenting directly from a fused CT image would avoid the step of the first reconstruction, but since the bladder volume will vary during the acquisition, and as PET and CT acquisitions are not simultaneous, there will be a size mismatching between CT and PET, making the PET segmentation more convenient for the particular case of the bladder (Heiba et al 2009). This limitation may be diminished if simultaneous PET-MR systems are utilised, where the bladder could be accurately segmented from the MR co-registered image.
Following segmentation and forward projection, the reconstruction of the original sinograms was performed again, with the bladder sinograms as a physiological background term for the reconstruction (Tsoumpas and Thielemans 2009). This background term in the reconstruction algorithm provided the information that the bladder contribution of the sinogram is undesired on the final image. The process is mathematically the same as used for standard scatter and random coincidences corrections. This new method was applied to all the simulated images and the result was an image without the bladder contribution, as shown in figure 7. This first result is already useful, since it solves the problems of lesion detectability observed on figure 4 and produces images visually similar to those of 11C-choline (Witney et al 2012). It is remarkable that the results are very consistent over all the images, even when manually drawn ROIs were used, highlighting that the method is not very dependent on ROI delineation, as soon as the ROI has been drawn in a reasonable way, taking almost all the activity of the bladder.
Despite these first promising results, the main goal of this work was to solve the problems with quantification. In order to evaluate this, we compared the SUVmax and SUVmean quantification values before and after the correction. The results on figure 8 point out that the correction also manages to successfully recover the quantification values. A significant improvement was observed in SUVmax and SUVmean for both lesions of SUVs of 3.03 and 6.06 g l−1 with bladder/lesion ratios from 0.18 to 6. The main conclusion of the analysis is that after the correction, the images provided higher accuracy and repeatability of both SUVmax and SUVmean values, with good repeatability and in good agreement with simulated SUV values and quantified values without bladder uptake respectively. About statistical noise, no increase was noticed compared to the images without the correction according to the STD over five repetitions. Convergence of the proposed methodology was studied and it was shown that the correction does not have an impact on the convergence of the reconstruction algorithm, so the chosen number of thirty-two iterations was adequate.
Overall, the results of our experiment show that the usage of the method makes possible a reliable use of SUV on prostatic lesions when injecting 18F-FCH, at least from a reconstruction point of view. More experiments are needed to ensure the applicability of the proposed method to patient studies, and modifications of the method might be necessary when applying it to the clinic, particularly related with the segmentation of the bladder that can be hindered by the physiology of clinical PET studies. These and other factors affecting the segmentation such as influence of patient movement and bladder volume variations are outside the scope of this work but subject to future investigations.
Finally, it has to be mentioned that the proposed methodology could be applied to other cases, such as spill-in counts derived from the myocardium to coronary arteries or a neighbouring lung tumour (Liu 2012). Nevertheless, potential motion artefacts could complicate the applicability of the method.
Conclusions
The impact of the bladder uptake on prostate tumours quantification was evaluated using MC simulations. Our results showed that measured SUV can be biased as much as 40% when bladder/tumour ratios are high. A correction method based on the introduction of prior information about bladder on the reconstruction was proposed and tested, showing improvements both on visual detectability and quantification. Applying the proposed correction method, reliable SUVs can be obtained from 18F-FCH images.
Acknowledgments
This work was supported in part by the public Fondo de Investigaciones Sanitarias (PI11/01806), MINECO (2014/CSUN1/000004) and the EU COST Action TD1007 (www.pet-mri.eu). Instituto de Salud Carlos III supports J. Pardo-Montero through a Miguel Servet grant (CP12/03162) and P. Aguiar is awarded a public fellowship from Xunta de Galicia (POS-A/2013/00).