
Abstract
Frailty is an important geriatric syndrome strongly linked to falls risk as well as increased mortality and morbidity. Taken alone, falls are the most common cause of injury and hospitalization and one of the principal causes of death and disability in older adults worldwide. Reliable determination of older adults' frailty state in concert with their falls risk could lead to targeted intervention and improved quality of care. We report a mobile assessment platform employing inertial and pressure sensors to quantify the balance and mobility of older adults using three physical assessments (timed up and go (TUG), five times sit to stand (FTSS) and quiet standing balance). This study examines the utility of each individual assessment, and the novel combination of assessments, to screen for frailty and falls risk in older adults.
Data were acquired from inertial and pressure sensors during TUG, FTSS and balance assessments using a touchscreen mobile device, from 124 community dwelling older adults (mean age 75.9 ± 6.6 years, 91 female). Participants were given a comprehensive geriatric assessment which included questions on falls and frailty. Methods based on support vector machines (SVM) were developed using sensor-derived features from each physical assessment to classify patients at risk of falls risk and frailty.
In classifying falls history, combining sensor data from the TUG, Balance and FTSS tests to a single classifier model per gender yielded mean cross-validated classification accuracy of 87.58% (95% CI: 84.47–91.03%) for the male model and 78.11% (95% CI: 75.38–81.10%) for the female model. These results compared well or exceeded those for classifier models for each test taken individually. Similarly, when classifying frailty status, combining sensor data from the TUG, balance and FTSS tests to a single classifier model per gender, yielded mean cross-validated classification accuracy of 93.94% (95% CI: 91.16–96.51%) for the male model and 84.14% (95% CI: 82.11–86.33%) for the female model (mean 89.04%) which compared well or exceeded results for physical tests taken individually.
Results suggest that the combination of these three tests, quantified using body-worn inertial sensors, could lead to improved methods for assessing frailty and falls risk.
Export citation and abstract BibTeX RIS
1. Introduction
Preventing falls in older adults is an increasingly important clinical challenge due to a globally aging population. Approximately one third of adults over 65 years of age fall each year (Masud and Morris 2001). In the United States in the year 2000 alone, fatal falls cost $179 million, while non-fatal falls cost $19 billion. As the worldwide population ages, the incidence of falls and their associated costs are set to increase (Gillespie et al 2001, WHO 2007). Frailty in older adults has emerged as an important geriatric syndrome which is strongly associated with falls (Fried et al 2001, Lang et al 2009, Romero-Ortuno 2010). Frailty is a multi-factorial condition, influenced by the combination of physical, psychological and social health. It has been shown that frailty has statistically significant predictive associations with five important health outcomes: death, first hospitalization, first fall, worsening activities of daily living (ADL) disability and worsening mobility (Fried et al 2001, Santos-Eggimann et al 2009).
Different risk factors for falls have been identified, spanning physical and psychological factors. A variety of tests are used to assess falls risk, however, many of these are subjective in nature and require training and experience in geriatrics and are typically performed in specialized clinical locations. This approach presents enormous challenges in terms of its ability to scale to meet the ever increasing demands for falls-related services. Screening technologies suitable for use in community settings will likely meet a demand for increased falls risk and frailty screening services over the coming years.
Owing to the multi-factorial nature of falls and frailty, an objective method to reliably identify patients at risk of falls or frailty could be used to target interventions which may prevent falls or a descent into frailty. Periodic assessments would enable objective monitoring over time. Furthermore, it is arguable that assessment of patients for both falls risk and frailty could provide a more accurate clinical picture of a patient's physical state. The American Geriatrics Society/British Geriatrics Society (AGS/BGS) recommend an annual falls risk assessment for people aged 65 or older (Gillespie et al 2001). Targeting large groups of older adults, before they decline or develop a high risk of falling is a challenging task. Recent research has focused on using body-worn inertial sensors to enhance the accuracy of standard clinical mobility assessments. Prompt and accurate identification of a person's falls risk or frailty state could allow effective multi-factorial intervention which has been shown to improve health outcomes (Tinetti et al 1994).
The Timed Up and Go (TUG) test (Mathias et al 1986, Podsiadlo and Richardson 1991) is a standard mobility assessment; the time taken to perform a prescribed routine is recorded. The test has been shown to be a strong predictor of frailty (Savva et al 2013) and is commonly used for assessing falls risk in older adults. The TUG test has been recommended by the AGS/BGS guidelines as a screening tool for identifying older adults at increased risk of falls. Shumway-Cook et al (2000) reported 13.5 s as a cut-off to distinguish older adults with a history of recurrent falls within 6 months of assessment from those with no history of falling. Whitney et al reported an extended cut-off of 15 s to identify those at high risk of falls (Whitney et al 2005a). This single measure may have limited value, particularly given its variability and poor performance in classifying falls history (Thrane et al 2007, Greene et al 2010) and predicting future falls (Greene et al 2012a). Inertial sensors have been used to enhance the ability of the TUG test to assess falls risk, with significantly improved performance for both classification of falls history and prediction of future falls.
The five-times-sit-to-stand test (FTSS) is a clinically accepted assessment of lower limb strength, which has been associated with balance dysfunction (Lord et al 2002, Lusardi et al 2003, Whitney et al 2005b) and falls risk (Najafi et al 2002b, Buatois et al 2010, Doheny et al 2013). FTSS completion times greater than 15 s have been reported to indicate a 74% greater risk of recurrent falls (Buatois et al 2008). The FTSS was also reported to provide more added value to a falls risk assessment than the TUG test, and the 'One-Leg-Balance' test, particularly when examining those at moderate risk of falls (Narayanan et al 2010). Older adults who are prone to falls are more likely to demonstrate abnormalities in postural stability and balance control, as compared to healthy older controls (Maki 1997).
Clinically, balance (and associated falls risk) is commonly assessed using clinical tests such as the Berg balance scale (BBS) (Berg 1989), which can be subjective, time-consuming and have limited predictive power for falls (Bogle Thorbahn and Newton 1996). Quantitative assessment of balance and postural sway traditionally utilises specialized laboratories and expensive, non-portable equipment, such as force plates or optical motion capture systems (Prieto et al 1996a). Recently, body-worn inertial sensors and portable pressure sensors have been used to quantitatively assess postural sway during standing balance tasks (O'Sullivan et al 2009, Mancini and Horak 2010, Mancini et al 2011, Doheny et al 2012). Inertial and pressure sensor data have also been used to classify participants based on falls history, with up to 73.3% classification accuracy reported (Greene et al 2012a). Such methods would be appropriate for community-based screening for balance deficits and associated falls risk.
A number of previous studies have focused on how parameters derived from body-worn inertial sensors correlate with clinically validated reported falls risk assessments (Najafi et al 2002a, Giansanti 2006, Narayanan et al 2010). Other studies were based on retrospective falls history (Greene et al 2010) or prospective follow-up for falls (Marschollek et al 2011, Greene et al 2012a). To address the multiple and diverse risk factors for falls, different mobility tests have been combined; Narayanan et al (2010) used a waist mounted accelerometer during the TUG, alternative step test (AST) and FTSS to classify patients according to the Physiological Profile Assessment (PPA). Similarly, Marschollek et al (2011) used a waist mounted accelerometer during a TUG and 20 m walk test to predict falls. Martinez-Ramirez et al (2011) used accelerometers during a standing balance task to examine the utility of parameters derived from an accelerometer using a wavelet based algorithm to discriminate between frail, pre-frail and robust participants. A previous study by the present authors (Greene et al 2014) investigated a fast method for automatic, quantitative assessment of frailty employing body-worn inertial sensors during the TUG test.
In the present study, a touchscreen mobile assessment platform using wireless inertial (and pressure sensors for the balance test) was developed to quantify the balance and mobility of older adults during TUG, FTSS and balance assessments. Support vector machine (SVM) classifier models to assess falls risk and frailty were developed using sensor-derived features from each assessment. We aimed to investigate the novel combination of assessments to screen for frailty and falls risk in older adults. This study examines the utility of each individual assessment, (and for the balance test, the combination of pressure and inertial sensors). The utility of the FTSS and balance tests (or a combination of physical tests), instrumented with inertial sensors in classifying frailty has not previously been reported. While the Fried frailty criterion has been extensively validated in the scientific literature it is essentially a surrogate indicator of physical decline and it is not in itself an event or condition requiring clinical intervention. Conversely, the economic and social costs associated with falls are well documented, however given the varying causes and aetiologies for falls they can be extremely difficult to predict. As result we feel a combined falls and frailty risk assessment might offer a more clinically useful measure of a patient's physical state then either measure taken alone.
2. Methods
2.1. Cohort
130 community-dwelling older adults gave their informed consent and had their gait and balance assessed in the TRIL clinic, St James's hospital (SJH), Dublin, Ireland between January and July 2012. This study was conducted as part of larger study on aging (www.trilcentre.org), a portion of which aims to develop technologies to enhance the clinical assessment of falls risk. Participants were at least 65 years old, had never experienced a stroke, did not suffer from any neurological impairment, and were able to walk without assistance. Ethical approval was received from the local research ethics committee.
Each participant received a comprehensive geriatric assessment (Romero-Ortuno et al 2011) which included tests of visual acuity (Binocular LogMar) and visual contrast sensitivity (Pelli-Robson test), maximum grip strength and blood pressure, to check for orthostatic hypotension (defined as orthostatic SBP drop > 20 mmHg). Each participant's balance and mobility was evaluated using the TUG test and also the Berg balance scale (BBS) (Berg 1989). Maximum grip strength (lbs) (taken as the maximum of the left and right hand grip strength over three attempts) was measured using a handheld dynamometer (Baseline® Hydraulic Hand Dynamometers, NexGen Ergonomics Inc., Quebec, Canada). The results of these assessments along with clinical characteristics are tabulated in table 1.
Table 1. Clinical information for the cohort. Participants are grouped by modified (binary) Fried frailty category (non-frail and frail) as well as by falls classification (faller, non-faller). Values are reported as mean ± std. dev. Significant differences (p < 0.05) in clinical parameter when grouped by frailty status are indicated by * while significant differences (p < 0.05) when participants were grouped by falls classification are indicated by ^.
| Variable | Non-frail | Frail | Fallers | Non-fallers |
|---|---|---|---|---|
| N (M/F) | 17/41 | 16/50 | 11/37 | 22/54 |
| Age (yrs)* | 73.72 ± 6.04 | 77.77 ± 6.44 | 76.02 ± 6.24 | 75.79 ± 6.78 |
| Height (cm) | 162.77 ± 8.00 | 160.51 ± 8.32 | 160.02 ± 8.23 | 162.55 ± 8.11 |
| Weight (kg)^ | 72.45 ± 12.14 ± | 72.37 ± 13.84 | 69.33 ± 11.92 | 74.34 ± 13.39 |
| Binocular LogMar^ | 0.14 ± 0.19 | 0.18 ± 0.18 | 0.20 ± 0.19 | 0.14 ± 0.17 |
| Contrast Sensitivity | 1.48 ± 0.17 | 1.43 ± 0.16 | 1.45 ± 0.17 | 1.46 ± 0.17 |
| Max. Grip (kg)* | 28.92 ± 10.07 | 20.96 ± 6.45 | 22.81 ± 7.93 | 25.87 ± 9.80 |
| TUG (s)* | 9.36 ± 1.39 | 12.06 ± 3.43 | 11.08 ± 3.25 | 10.62 ± 2.82 |
| BBS* | 54.79 ± 1.75 | 51.36 ± 4.99 | 52.65 ± 4.33 | 53.17 ± 4.11 |
A fall was defined as an event which resulted in a person coming to rest on the lower level regardless of whether an injury was sustained, and not as a result of a major intrinsic event or overwhelming hazard (Tinetti et al 1988). All participants had a detailed clinical assessment and falls history consistent with the AGS/BGS guidelines (Gillespie et al 2001). Participants who had experienced more than one fall during the 12 months prior to assessment or had a fall resulting in any injury were categorized as fallers. Participants not meeting these criteria were categorized as non-fallers.
Each participant's frailty status was assessed using the criteria reported by Fried et al (2001). This formulation defined frailty as a syndrome in which three or more of the following criteria are present: unintentional weight loss, self-reported exhaustion, weakness (as measured by grip strength), slow walking speed, low physical activity. Participants were then categorised into three Frailty classes: robust, pre-frail and frail based on the five frailty criteria outlined above. A participant was classed as frail if they met three or more of the criteria listed above. Participants meeting one or two criteria were classed as pre-frail according to the modified Fried criteria used by Ní Mhaoláin et al (2012).
2.2. Data acquisition
Inertial sensors (SHIMMER, Shimmer research, Dublin, Ireland), containing tri-axial accelerometers and a tri-axial gyroscope, were used to quantify movement during each assessment. Participants wore 5 inertial sensors during all assessments (figure 1). One on the anterior aspect of each shin (IS1 and IS2), with one axis aligned with the tibial bone, and secured using elasticated tubular bandages (Tubigrip). A third sensor (IS3) on the lateral aspect of the right thigh, also secured using elasticated tubular bandages. A fourth sensor (IS4) was placed on the lower back, above L5, and a final sensor (IS5) on the sternum. The axes of both of these were aligned with the vertical, medio-lateral and anterior-posterior axes of the body, and secured using surgical tape. A pressure sensor (PS) platform, the Wii balance board (Nintendo, Japan), was also used to quantify postural sway during each balance assessment.
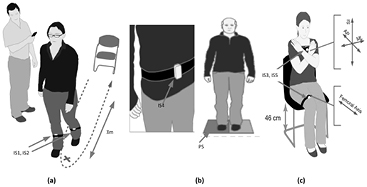
Figure 1. Experimental setup for each of the three instrumented tests performed: (a) timed up and go (TUG), (b) standing balance, (c) five time sit to stand test (FTSS). Participants wore inertial sensors (IS1-5) during each of the tests and stood on a pressure sensitive balance board (PS) during the standing balance test.
Download figure:
Standard image High-resolution imageInertial sensor data were sampled at 102.4 Hz, while pressure sensor data were interpolated (from a variable and unevenly sampled rate) to sample at 40 Hz. Inertial and pressure sensor data were synchronously acquired in real-time via Bluetooth using a custom developed Android application, and aggregated using a 7'' (17 cm) tablet computer (Acer Iconia, Android ver. 3.2). The touchscreen application featured an integrated application suite launcher, from which the data acquisition application for each mobility assessment could be launched manually. Each data acquisition application automatically connected to the relevant sensors, allowed the research nurse to start and stop the recording manually, and automatically stepped through all iterations of each assessment. Data were automatically saved to text format for subsequent offline analysis. Post-processing and analysis were conducted off-line using Matlab (Mathworks, VA, USA).
2.3. Timed up and go
During the timed up and go (TUG) inertial data were collected from IS1, IS2 and IS4. Participants stood from a 46 cm high chair with armrests, walked 3 m, turned 180°, and returned to the chair and sat down (figure 1(c)). They were instructed to perform this at their normal pace. The clinician said 'go' when they started the recording, and ended the recording when the participant was re-seated with their back touching the back of the chair. This was repeated three times, with at least 30 s rest between each iteration.
Accelerometer and gyroscope data were calibrated using a published procedure (Ferraris et al 1995) and low-pass filtered using a Butterworth IIR filter with a 20 Hz corner frequency. 52 features quantifying the temporal, spatial, turning and rotational characteristics (details appear elsewhere (Greene et al 2010, Greene et al 2012a)) were extracted from inertial sensor data for each participant. The features for each TUG test were averaged across all three trials for each participant. Figure 2 illustrates sample signals from each of the three physical tests including inertial and pressure sensors.

Figure 2. Sample signal for each of the three physical tests. (a) shows a sample shank ML angular velocity signal obtained during a TUG test, (b) sample PS signal obtained during eyes closed standing balance, (c) shows a sample thigh AP acceleration signal obtained during a FTSS test (d) tri-axial acceleration signals obtained during an eyes closed standing balance test.
Download figure:
Standard image High-resolution image
2.4. Balance
During the balance assessments inertial data was collected from IS4. Pressure sensor data were also collected using PS to determine if the addition of a PS would improve the classification of falls and frailty using an inertial sensor. Participants were asked to remove their shoes and put on appropriately sized non-slip disposable slippers. Participants were then asked to stand as still as possible with their feet approximately 30 cm apart, keeping their hands by their sides. They were asked to keep this position for 40 s, with their eyes open (EO) and looking at a specified spot in front of them. The clinician said 'start' when they started the recording, and informed the participant after 40 s when they ended the recording. This was then repeated while the participant kept their eyes closed (EC). Both conditions, EO and EC, were repeated three times with at least 30 s rest between iterations.
Each balance board contains four strain gauge pressure sensors, one at each corner. Each sensor measures the weight at each corner of the WBB. The centre of pressure (COP) can be estimated for each sample using the equation below (Young et al 2011):
Where COPx and COPy are the x and y coordinates of the COP. Weighti refers to the weight measurement at sensor i for a given sample, while xi and yi are the x and y coordinates of the sensor locations. The time-series of COP coordinates was unevenly sampled so after calculation of the COP coordinate for each sample, the time-series were interpolated to be evenly sampled at 40 Hz. The COP time series were then low pass filtered with a 8th order, zero-phase Butterworth lowpass filter with a 5 Hz corner frequency. The trial was deemed to have begun when the mean weight, taken across all four sensors was above 30 kg, referred to as trial start point.
30 s of data for each trial were taken for analysis. To account for movement during transitional periods and to allow time for stabilization, data prior to the trial start point plus 4 s, were neglected from analysis, similarly, data beyond the trial start point plus 34 s were neglected.
A number of standard quantitative balance parameters (Prieto et al 1996b) were then calculated to quantify the COP excursions over the course of each balance trial: mean COP distance, root mean squared (RMS) COP distance, sway length, mean sway velocity, mean sway area, mean sway frequency, mean sway frequency (medio-lateral (ML) direction), mean sway frequency (anterior-posterior (AP) direction), 95% confidence sway circle area and 95% confidence sway ellipse area.
All inertial sensor parameters were derived from the tri-axial angular velocity and acceleration signals obtained from the inertial sensors mounted on the lower back of each participant while performing the standing balance trials, using a previously reported method (Doheny et al 2012). Accelerometer and gyroscope data were band-pass filtered between 0.1 and 5 Hz. Accelerometer data were also corrected for the effects of gravity (Moe-Nilssen and Helbostad 2002). The RMS amplitude of the ML and AP acceleration were used to quantify postural sway in each direction. The frequency domain variability of the signals obtained by the inertial sensor was also examined for both acceleration and angular velocity signals using the spectral edge frequency (SEF), defined as the frequency below which 95% of the power spectrum of the signal is contained and the median frequency defined as the frequency below which 50% of the power spectrum is contained (Greene et al 2008, Doheny et al 2012). The spectral entropy (H), a measure of signal complexity (Viertiö-Oja et al 2004) of the tri-axial accelerometer and angular velocities signals was also calculated. The mean value of each feature across the three iterations was included in the analysis for each participant.
2.5. Five-times-sit-to-stand
During the five timed sit-to-stand (FTSS) inertial data was collected from IS3, IS4 and IS5. A 46 cm high chair was used, and participants were asked to keep their arms folded across their chest for the duration of the FTSS, figure 1(a). Each participant was then asked to fully stand up and sit back down five times as quickly as possible. The clinician said 'go' when they started the recording, and ended the recording when the participant was re-seated for the fifth time with their back touching the back of the chair. This was repeated three times, with at least one minute rest between each iteration.
Accelerometer data were calibrated using a published procedure (Ferraris et al 1995) and low-pass filtered at 5 Hz. 82 features quantifying the timing and acceleration characteristics (details appear elsewhere (Doheny et al 2013)) were extracted from the accelerometer data for each participant. The features extracted for each FTSS test were then averaged across all three trials for each participant.
2.6. Statistical analysis
A one-way analysis of variance (ANOVA) was used to test for differences (p < 0.05) in each clinical parameter between robust, pre-frail and frail classes (table 1) as well as between the faller and non-faller classes.
Support vector machines (SVM) (Vapnik 1995, Shawe-Taylor and Cristianini 2004) were used to classify participants according to frailty status (frail/non-frail) as well as falls history (fallers/non-faller). Frailty was considered as a binary classification problem; grouping participants listed as frail and pre-frail together into one frail class and comparing this to a non-frail (robust) class. The output of this model was an estimate of the frailty category (frail/non-frail). This estimated frailty category was then compared to the true frailty category (as defined using modified Fried criteria) to yield an estimate of the accuracy in classifying each participant according to frailty category. Separate classifier models were generated to classify participants using features from each test separately as well as the combined features from all three tests. Data were stratified by gender, as improved falls and frailty classification performance through separate male/females classifier models has been documented elsewhere (Greene et al 2012b, 2014).
An SVM finds a separating hyperplane with the maximal margin in a higher dimensional space, training vectors are mapped to a higher dimensional space using a kernel function. A radial basis function (RBF) kernel function, defined as  was used in this study, where σ is the RBF kernel parameter and
  defines the Euclidean norm. Features were selected using sequential forward feature selection (Kohavi and John 1997) within a cross-validation procedure. Default SVM hyperparameters values (σ and box-constraint parameter, C), σ = 1 and C = 1 were used in this study. The generalized performance of each model was evaluated using 10 repetitions of 10-fold cross validation (Duda et al 2001), where training and testing sets are randomly selected for each repetition to obtain an unbiased estimate of generalised classifier performance.
The performance of the classifier model was evaluated using a number of standard performance measures; the classification accuracy (Acc), defined as the percentage of participants correctly classified by the system as being a faller or non-faller. The sensitivity (Sens) is defined as the percentage of the positive class (fallers or frail) classified correctly. Similarly, specificity (Spec) is defined as the percentage of the negative class (non-fallers or non-frail) correctly identified as such by the system. Positive and negative predictive values were also calculated to provide a measure of the predictive power of positive and negative classifications. The positive predictive value (PPV) is defined as the proportion of the positive class participants classified correctly by the algorithm. Similarly, the negative predictive value (NPV) is the proportion of the negative class participants classified correctly. The values reported for each classifier performance metric were averaged across all cross-validation folds and repetitions. 95% confidence interval (95% CI) was also calculated for each classifier performance metric using the test set performances from each fold of cross-validation.
3. Results
Data for 6 participants were neglected from the analysis. Incomplete clinical data or sensor battery issues meant that sensor data for 124 of 130 (95.38%) participants were included in the final analysis (33 males, 91 females, see table 1).
48 participants who had experienced more than one fall during the 12 months prior to assessment or had a fall resulting in any injury were categorized as fallers. 76 participants not meeting these criteria were categorized as non-fallers.
6 participants were categorized as frail, 66 as pre-frail and 60 as robust using Fried's frailty criteria. Grouping the participants as frail or non-frail gave 60 non-frail and 72 participants categorized as frail. The mean age of the cohort at the time of initial evaluation was 75.9 ± 6.6 years, while the mean height and weight were 161.6 ± 8.2 cm and 72.4 ± 13.0 kg respectively. Clinical information for the cohort from the clinical assessment is detailed in table 1.
Statistically significant (p < 0.05) differences across the three frailty categories were observed in a number of the clinical parameters (age, max grip, TUG). Similarly, statistically significant differences were observed between the faller and non-faller classes in a number of clinical parameters (table 1).
Table 2 reports a contingency table for falls history compared to frailty status, 33 of 76 (43.42%) non-fallers were categorized as non-frail, 43 (56.58%) as frail. Similarly, 25 of 48 (52.08%) of fallers were characterized as non-frail, 23 (47.92%) as frail.
Table 2. Confusion matrix illustrating the relationship in the present cohort between frailty (as defined by the modified (binary) Fried frailty phenotype) and falls history.
| Category | Faller | Non-faller |
|---|---|---|
| Non-frail | 33 | 25 |
| Frail | 43 | 23 |
In classifying participants according to falls history, combining sensor data from the TUG, Balance and FTSS tests to a single classifier model per gender, yielded mean cross-validated classification accuracy of 87.58% (95% CI: 84.47–91.03%) for the male model and 78.11% (95% CI: 75.38–81.10%) for the female model. Considering the sensor data from each of the physical tests separately yielded mean classification accuracy of 73.03% (95% CI: 69.64–77.06%) for the male TUG model and 70.99% (95% CI: 68.04–73.88%) for the female TUG model. The male Balance model yielded a mean classification accuracy of 77.81% (95% CI: 73.32–82.44%) while the female model yielded 67.67% (95% CI: 64.93–70.27%). Excluding the pressure sensor features from the Balance model yielded classification accuracies of 70.61% (95% CI: 66.33–74.70%) for the male model and 56.59% (95% CI: 54.80–58.29%) classification accuracy for the female model. These results suggest that a combined balance sensor method or a pressure sensor based method alone is more effective in classifying falls history than an inertial sensor method taken alone. The male and female FTSS models had classification accuracies of 86.36% (95% CI: 83.22–89.88%) and 58.90% (95% CI: 56.06–61.98%) respectively.
Combining the frail and pre-frail classes into a single class reduces frailty classification to a binary problem. Combining sensor data from the TUG, Balance and FTSS tests to a single classifier model per gender, yielded mean cross-validated classification accuracy of 93.94% (95% CI: 91.16–96.51%) for the male model and 84.14% (95% CI: 82.11–86.33%) for the female model. Considering the sensor data from each of the physical tests separately yielded mean classification accuracy of 89.09% (95% CI: 85.11–92.06%) for the male TUG model and 72.31% (95% CI: 69.60–75.04%) for the female TUG model. The male Balance model yielded a mean classification accuracy of 93.13% (95% CI: 90.67–95.99%) while the female model yielded 64.29% (95% CI: 61.21–67.42%). Excluding the pressure sensor features from the Balance model yielded classification accuracies of 78.48% (95% CI: 75.28–84.05) for the male model and 68.46% (95% CI: 65.70–71.34) classification accuracy for the female model. The male and female FTSS models had classification accuracies of 73.33% (95% CI: 69.19–77.97%) and 80.11% (95% CI: 77.31–82.82%) respectively.
Detailed performance metrics for classification of participants according to falls history are provided in table 3. Similarly, detailed performance results for classification of participants according to frailty status are provided in table 4.
Table 3. Results for automated classification of falls history using support vector machine classifier models; participants were categorized as faller or non-faller. Data for each physical test were considered separately as well as combined into a single classifier model. Data for all classifier models were stratified by gender to produce separate male/females classifier models.
| Combined | TUG | Balance | FTSS | |||||||||
|---|---|---|---|---|---|---|---|---|---|---|---|---|
| M | F | Mean | M | F | Mean | M | F | Mean | M | F | Mean | |
| Acc (%) | 87.58 | 78.11 | 82.84 | 73.03 | 70.99 | 72.01 | 77.81 | 67.67 | 72.74 | 86.36 | 58.90 | 72.63 |
| Sens (%) | 72.73 | 85.41 | 79.07 | 34.55 | 60.00 | 47.27 | 77.27 | 62.16 | 69.72 | 63.64 | 30.00 | 46.82 |
| Spec (%) | 95.00 | 71.67 | 83.33 | 92.27 | 78.52 | 85.40 | 74.55 | 70.19 | 72.37 | 97.73 | 78.70 | 88.22 |
| PPV (%) | 87.91 | 67.38 | 77.64 | 69.09 | 65.68 | 67.39 | 60.28 | 58.82 | 59.55 | 93.33 | 49.12 | 71.22 |
| NPV (%) | 87.45 | 87.76 | 87.60 | 73.82 | 74.13 | 73.97 | 86.77 | 73.03 | 79.90 | 84.31 | 62.13 | 73.22 |
Table 4. Results for automated classification of frailty status using support vector machine classifier models; participants were categorized as frail or non-frail. Data for each physical test were considered separately as well as combined into a single classifier model. Data for all classifier models were stratified by gender to produce separate male/females classifier models.
| Combined | TUG | Balance | FTSS | |||||||||
|---|---|---|---|---|---|---|---|---|---|---|---|---|
| M | F | Mean | M | F | Mean | M | F | Mean | M | F | Mean | |
| Acc (%) | 93.94 | 84.14 | 89.04 | 89.09 | 72.31 | 80.70 | 93.13 | 64.29 | 78.71 | 73.33 | 80.11 | 76.72 |
| Sens (%) | 91.25 | 86.00 | 88.63 | 77.50 | 70.80 | 74.15 | 90.00 | 70.60 | 80.30 | 80.00 | 80.60 | 80.30 |
| Spec (%) | 96.47 | 73.66 | 85.06 | 100.00 | 74.15 | 87.07 | 90.59 | 56.59 | 73.59 | 67.06 | 77.56 | 72.31 |
| PPV (%) | 96.05 | 79.93 | 87.99 | 100.00 | 76.96 | 88.48 | 90.00 | 66.48 | 78.24 | 69.57 | 81.41 | 75.49 |
| NPV (%) | 92.13 | 81.18 | 86.66 | 82.52 | 67.56 | 75.04 | 90.59 | 61.21 | 75.90 | 78.08 | 76.63 | 77.35 |
4. Discussion
This study suggests that improved classification of falls risk and frailty is possible based on sensor data obtained from three physical assessments using inertial sensors (and a portable pressure sensor for the balance test) and SVM classifier models. We have shown that classification of frail participants or participants with a history of falls using features combined across all three physical tests yields more accurate results than those obtained from each physical test alone. Furthermore, we have shown that a quiet standing balance test as well as the FTSS test can reliably classify participants according to frailty status and that the use of a portable pressure sensor improves the classification of falls history and frailty when compared to an inertial sensor taken alone.
A major limitation of the present study is the cross-sectional nature of the falls data. The present study classified participants based on their history of falling, which is an established risk factor for future falls (Stalenhoef et al 2002). However, this retrospective design is a limitation of this study, given that self-reported historical falls data can be unreliable. A further limitation of the present study is the small number of participants (N = 6) categorised as frail. To increase the statistical power, the pre-frail and frail categories were merged to produce two classes: frail and non-frail. Given a larger cohort it may be possible to create robust multi-class statistical models that can reliably classify participants into each of the three frailty classes. A large proportion of the present cohort was self-referred which could indicate differences when compared to a cohort of hospital in-patients or nursing home residents. Every effort was made to ensure the statistical models used in the present study were generalized across the study population, differences may exist when compared to the general population given the relatively robust nature of the study population. It should be noted that many physical, psychological and social health factors contribute to falls and frailty, however the present methods only take account of physical factors in the measurements taken.
While many previous studies (Lundin-Olsson et al 1998, Fried et al 2001, Lang et al 2009, Santos-Eggimann et al 2009) have reported the link between frailty and falls it is interesting to note the results from table 2; 33 participants with a history of falls were categorized as robust according to the Fried frailty phenotype, whereas no participants with a history of falls were categorized as frail. This discrepancy may arise due to the time-bounded nature of the falls history collected (i.e. one year) or may reflect a more general discrepancy between frailty categories and falls history.
The reported results suggest that combining sensor data from three physical tests can significantly improve the accuracy of automated frailty and falls classification. For males, the combined tests were significantly more accurate than the TUG or Balance tests in assessing falls risk, while the combined tests were more accurate than TUG and FTSS in assessing frailty. For females, the combined tests were significantly more accurate than any individual test in assessing both falls risk and frailty. The TUG, Balance and FTSS tests contain a wide variety of physical manoeuvres and challenges and so their combination may represent a more a more comprehensive falls risk assessment than that provided by any one test individually. To date the present study is the first to report the improved falls history classification offered through the combination of repeated physical assessments, a method which has potential to improve the performance of existing falls risk assessment methods. Previous research (Greene et al 2012b) reported the utility of a sensor-matrix based pressure sensor in classifying falls history, however the present study employed a different, low-cost strain gauge based pressure sensor (PS) which is more portable and less expensive. We investigated the use of two sensors (PS and inertial) for measurement of balance, this is because each sensor gives rise to potentially different use cases; the pressure sensor could be used in an unsupervised environment such as the home, while the inertial sensor is potentially more portable and could find utility in a supervised clinical environment. We have shown that the combination of pressure and inertial sensors for measurement of balance and the classification of falls and frailty is more effective than an inertial sensor based method taken alone. Classification of frailty status using the time to complete the TUG test (Savva et al 2013) as well as using inertial sensors has been previously reported (Greene et al 2014). To our knowledge, the present study is the first to report the utility of the FTSS or standing balance tests for classification of frailty, and the first to consider combining multiple physical tests for improved automatic classification of frailty.
This study reports novel methods for the combined assessment of falls risk and frailty, suitable for use by non-expert users. Implementation of such methods, along with the combined assessment of patients for falls risk and frailty have the potential to improve the quality of care offered to community dwelling older adults deemed frail or at risk of falling. This would allow more timely medical intervention, such as targeted physiotherapy, medication change or occupational therapy. Furthermore, the reported method has potential for use in a longitudinal monitoring protocol where an increase in falls risk or deterioration in frailty state, manifesting as deterioration in a subject's performance in one or more of the three physical tests, would be noted as a change in the results of periodically performed assessments.
Acknowledgment
This research was completed as part of a wider programme of research within the TRIL Centre, (Technology Research for Independent Living). The TRIL Centre is a multi-disciplinary research centre, bringing together researchers from UCD, TCD, NUIG and Intel, funded by Intel, GE and IDA Ireland (www.trilcentre.org).
Author BRG is supported by an Enterprise Ireland commercialization grant (CF/2013/3600).
We also acknowledge the help and support of the staff of the TRIL Clinic, St James, hospital, Dublin and the participants involved in this study.