

Abstract
Objective: Measurement of skin temperature using infrared thermography has become popular in sports, and has been proposed as an indicator of exercise-induced muscle damage after exercise. However, the relationship between skin temperature and exercise-induced muscle damage is still unclear. Here we set out to investigate the relationship between skin temperature and exercise-induced muscle damage. Approach: Twenty untrained participants completed a protocol of exercise for calf muscles. Before and after exercise blood samples were collected to determine creatine kinase and acetylcholinesterase activity. Thermal images were recorded from the exercised muscles to determine skin temperature. Delayed onset muscle soreness was quantified. Correlations between skin temperature and exercise-induced muscle damage were analyzed considering thermal data, creatine kinase and acetylcholinesterase activity at different time moments. Main results: We found delayed onset muscle soreness and an increased creatine kinase activity 48 h after exercise (P < 0.01). Skin temperature parameters (average, maximal, amplitude and difference pre- and post-exercise, immediately after and 48 h after) did not correlate with the creatine kinase responses (P > 0.05). Acetylcholinesterase activity remained stable (P = 0.59). Significance: We recommend caution when considering changes in skin temperature as dependent on the level of localized and symmetric muscle damage considering calf muscles in untrained participants.
Export citation and abstract BibTeX RIS
1. Introduction
Exercise-induced muscle damage resulting in delayed onset muscle soreness (DOMS) is a matter of concern among athletes, coaches and physiotherapists. Muscle damage due to mechanical stress to the exercised muscle structure (Armstrong 1984) is associated with DOMS lasting from 24 hours to 7 days. This condition may impair functionality and neuromuscular performance (Pearcey et al 2015). The mechanisms of muscle damage are related to biochemical and mechanical stress at the microscopic level in the sarcomere, leading to local inflammation and high sensitivity of pain receptors (Lewis et al 2012).
Although we know that a sudden increase, without a proper control, of training loads and performance of exercises with eccentric actions lead to muscle damage, it is difficult to predict to what extent a training session will cause exercise-induced muscular damage. In this regard, infrared thermography is applied in sports with the justification that changes in skin temperature may correlate with inflammatory responses in conditions of exercise-induced muscle damage. An inflammatory condition may reflect increased blood flow and local temperature, contributing to a condition of hyperthermia in the region (Hildebrandt et al 2010). However, it is unclear whether changes in skin temperature correlate with blood markers of muscle damage. A correlation between infrared thermography and makers of muscle damage would support the practical application of infrared thermography. It can be useful because the collection and analysis of blood samples take time and can be expensive, while measurements using infrared thermography can be performed quickly, and once a camera is acquired, the cost of assessment is low. However, evidence is still needed.
Therefore, the objective of our study was to determine the relationship between skin temperature, determined by infrared thermography, and blood markers of exercise-induced muscle damage in untrained participants. We hypothesized that blood markers of exercise-induced muscle damage would be associated with the evolution of skin temperature.
2. Methods
In this correlational study, untrained participants completed calf rising repetitions to induce muscle damage in the triceps sural muscles. Before, immediately after and 48 hours after the exercise, venous blood samples and thermal images were taken. Muscle soreness was evaluated 48 hours after exercise. Each participant performed all the sessions at the same time of day, in the afternoon period, in order to avoid the effect of the circadian cycle (Marins et al 2015, Costa et al 2016).
A priori analysis of power sample size was performed using the G * Power 3 software (University of Düsseldorf, Dusseldorf, Germany). In order to detect a moderate correlation of 0.6, a sample size of 20 participants was estimated using a power of 90% and α error of 5%. Twenty healthy untrained men were included in our study (mean (standard deviation), age 24 (5) years old, body mass 75 (8) kg, height 174 (6) cm, body mass index 24.8 (2) kg m−2). They were free of previous injury in the lower extremity and reported good health without any clinically detected disease. The participants signed a consent form and the research protocol was approved by the local institutional ethics committee and performed in accordance with the Declaration of Helsinki. Participants were instructed to avoid drinking alcohol or caffeine, smoking, cosmetics, large meals, ointments, sunbathing, physical activity, and physiotherapy treatments (massage, cryotherapy, etc) in the 24 hours preceding the tests in order to reduce the variability of skin temperature (Marins et al 2014, Priego Quesada et al 2017), and during the following 48 hours when the additional measurements were performed.
The calf raise exercise protocol involved multiple sets of bilateral ankle plantar flexion for body elevation. The first set was performed until fatigue to establish the maximum number of voluntary repetitions. The participants performed the trial until they were no longer able to produce the required range of motion. Then, submaximal repetitions involving 75% of the maximal number of repetitions established in the first set were repeated until the participant could no longer perform 50% of the total number of repetitions. A metronome assisted participants in controlling their velocity during the movement execution (1 Hz). The interval between the series was defined by the total duration time of the previous set.
Muscle soreness was quantified by the same experimenter using a 10-point visual scale in which 0 (zero) meant no pain and 10 (ten) represented an excessive pain. The participant was questioned about the pain sensation during passive flexion and extension of the ankle joint (Corder et al 2016).
Blood samples (10 ml) were collected from the ulnar vein before (pre-), immediately (post-0 h) and 48 hours after the exercise (post-48 h) and stored in tubes containing a gel and clot activator. Samples were centrifuged (10 min @ 3500 rpm) to separate the plasma that was stored at −80 °C to further determine creatine kinase activity (CK) using enzymatic commercial kits and acetylcholinesterase activity (AChE) using the modified colorimetric method (Ellman et al 1961).
Skin temperature was determined before, immediately, and 48 hours after the exercise using an infrared thermal camera (E-60, 320 × 240 pixels, Flir Systems Inc., Wilsonville, OR, USA) with noise-equivalent temperature difference (NETD) <0.05 °C, and measurement uncertainty of ±2 °C or 2%. The camera was turned on 10 min before taking the images in order to ensure its stabilization. It was positioned 1 m away from the participant and with the lens aligned perpendicular to the body region of interest (ROI). The images were recorded while the participant was standing up wearing underpants after a room thermal adaption of 10 min (Marins et al 2014) Dry skin, not sweaty, was observed in the exercise region before the image record, in agreement with a previous study performing squat exercises (Formenti et al 2016). An anti-reflective panel was placed behind the participant to minimize effects from infrared radiation reflected in the wall (Priego Quesada 2017). All recommended procedures regarding control of environment temperature (between 18 °C and 26 °C) and humidity (between 30% and 60%) and participant preparation regarding drinking alcohol or caffeine, smoking, cosmetics, large meals ointments, sunbathing, physical activity, and physiotherapy treatments were followed to minimize factors of influence for the measurement (Priego Quesada et al 2017). The TISEM checklist was used to certify that all the important aspects of the protocol and thermographical analysis were attended to (Moreira et al 2017). Data were collected between 02:00 PM and 06:00 PM for all participants. Two ROIs were defined (anterior leg and posterior leg) in both lower limbs (figure 1). The anterior leg was evaluated as a control, since these muscles were not agonists in the movement, given that it was the posterior leg where the muscles were exercised. Each ROI was defined with a similar area for all participants for each measurement. Temperature data were analyzed with a commercial software (Thermacam Researcher Pro 2.10 software, FLIR, Wilsonville, OR, USA), considering an emissivity factor of 0.98 (Steketee 1973). Skin temperature was determined considering the average, maximal, amplitude (maximal–minimum), change immediately (ΔT0), and 48 hours after exercise (ΔT48). This was considered the average from both limbs because no differences were observed between the legs (P > 0.05). The values of asymmetries did not differ between the limbs, being lower than 0.5 (Chudecka et al 2015). The inter-user bias was evaluated by an intra-class correlation coefficient for the thermography measurement, which was found to be excellent (ICC > 0.99). The environmental conditions during the measurements were a temperature of 23 (1) °C and relative air humidity of 60 (10) %.
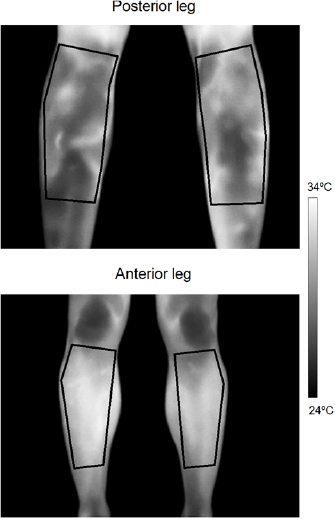
Figure 1. Definition of the regions of interest for the posterior and anterior leg.
Download figure:
Standard image High-resolution imageData are presented as mean and standard deviation. Normality of data distribution was confirmed using a Shapiro–Wilk test (P > 0.05). Muscle soreness, skin temperature, CK and AChE were compared between pre-, post-0 h and post-48 h using repeated measures ANOVA with Bonferroni post-hoc. Sphericity was checked by Mauchly test. Student's t-tests were used to examine the differences of skin temperature between ROIs and between the legs. Pearson correlation coefficient was determined to investigate the strength of association between skin temperature and CK levels at each time point (post-0 h and post-48 h after exercise). Significance level was set at 0.05 for all analysis using SPSS Statistics 21.0 (IBM Armonk, NY, USA).
3. Results
Exercise resulted in muscle soreness 48 hours after exercise (average visual analog scale higher than 6.5 points, F = 74.69; P < 0.01). The skin temperature of the anterior leg and posterior leg decreased and increased, respectively, with exercise (ΔT: −0.8 ± 1.4 and 0.9 °C ±1.1 °C, t = −4.45; P < 0.01; figure 2). Forty-eight hours after exercise, temperature variation was the same for both the ROIs (ΔT48: −0.6 ± 1.4 and −0.3 °C ± 1.1 °C, t = −1.2; P = 0.23, figure 2). CK level increased 48 hours after exercise (F = 9.80; P < 0.01; figure 2). The activity of AChE did not differ between the time points (F = 0.53; P = 0.59; figure 2). No significant correlations (P > 0.05) were observed between CK and skin temperature parameters immediately after exercise (figure 3) and 48 hours after (figure 4). AChE remained stable and therefore was not included in the correlation analyses.
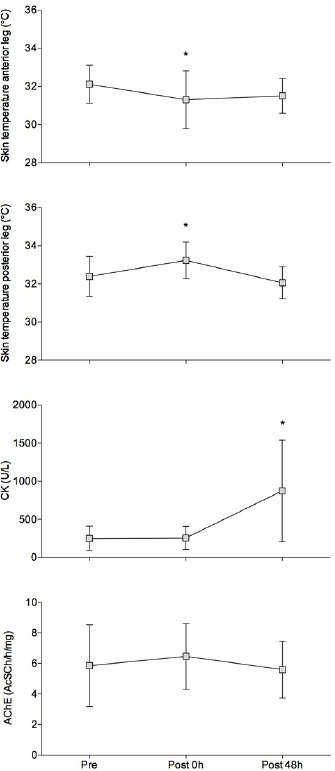
Figure 2. From the top to the bottom: mean (box) and standard deviation (vertical lines) measurements of absolute temperatures in the anterior and posterior leg (celsius degrees); creatine kinase (CK) and acetylcholinesterase (AChE) activity before (pre-), immediately after (post-0 h), and 48 h after exercise (post-48 h). * Different of pre-exercise; repeated measures ANOVA, P < 0.05.
Download figure:
Standard image High-resolution image
Figure 3. Plots of thermography data measured for the anterior (left) and posterior leg (right) immediately after exercise (post-0 h), and creatine kinase activity (CK). Considering Pearson correlation test, r and p values are provided within the graphs.
Download figure:
Standard image High-resolution image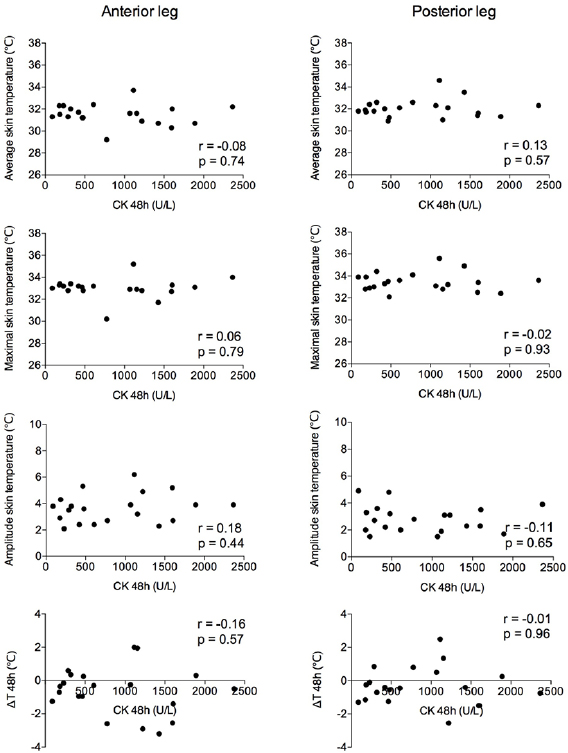
Figure 4. Plots of thermography data measured for the anterior (left) and posterior leg (right) 48 h after exercise (post-48 h), and creatine kinase activity (CK). Considering Pearson correlation test, r and p values are provided within the graphs.
Download figure:
Standard image High-resolution image
4. Discussion
The main purpose of this study was to determine the correlation between skin temperature and exercise-induced muscle damage in untrained individuals. Our main finding is that changes in skin temperature did not correlate with the creatine kinase marker of exercise-induced muscle damage. The exercise protocol was performed considering a specific muscle group in which thermal images could be recorded easily, as well as to determine CK activity, which is widely employed to estimate the magnitude of exercise-induced muscle damage in sports. As a practical implication, we recommend caution when assuming that changes in skin temperature may help to determine the risk of injury and damage due to exercise.
The report of muscle soreness and the increase in CK activity supports the assumption that there was muscle damage in the muscle group investigated. The higher CK activity suggests that muscle fibers were damaged by exercise (Stebbins et al 2014) and the lack of differences in AChE activity compared to the pre-exercise condition suggests that neuromuscular transmission was preserved (Sine 2012).
There is a lack of evidences concerning the relationship of skin temperature and muscle damage. A recent study evaluated the skin temperature and CK activity in soccer players after performing two consecutive matches within a 3-day interval (Fernandes et al 2017). Although the authors observed increments of skin temperature and CK activity after the matches, the correlation between these variables was of low magnitude (r = 0.3–0.4). Soccer involves large muscle groups being exercised at the same time, and testing correlations between skin temperature and muscle damage in this context might be confusing. Furthermore, the variability in the intensities performed by the different players may have significantly influenced the markers of exercise-induced muscle damage. Conversely, in our study we focused in the control of exercise-induced muscle damage to a specific small muscle group. In another study, the authors analyzed the responses of myoglobin and skin temperature to exercise (Al-Nakhli et al 2012). Although the authors considered myoglobin as a marker of muscle damage because muscle soreness was observed, it is important to mention that myoglobin levels might suffer from effects of blood flow and oxygen diffusion, which in fact can be affected by the temperature of the region. There is an influence of pH due to its changes in response to the type of exercise performed, in that case a predominantly anaerobic activity. Furthermore, despite not considering CK activity, the authors reported absolute values of skin temperature, which provide limited insight for the assessment of skin temperature responses because the basal or minimum temperature are not considered and the range of change is difficult to estimate (Priego Quesada et al 2017).
The motivation to use infrared thermography in the analysis of exercise-induced muscle damage is related to the idea that there is an effect of inflammatory responses on skin temperature. However, the effect of this response is usually determined by analysis of the thermal asymmetry, because one ROI is affected and the contralateral is not. However, when muscle damage occurs in both limbs, skin temperature cannot express exactly the levels of muscle damage because it is also affected by other factors, such as skin blood flow or sweat. However, it is important to consider that future studies are needed to address the relations between muscle damage and thermal asymmetries in other exercise configurations, including the exercise of larger muscle groups.
In our study we included untrained participants with the aim of facilitating an increase in exercise-induced muscle damage (Newton et al 2008). It is important to take into account that results could be different if a trained group is considered, because skin temperature changes less and slowly in untrained participants compared to trained participants (Formenti et al 2013). Furthermore, in measurements conducted after exercise in which sweat is negligible, the effect of the level of physical fitness on skin temperature response could be explained by the differences in the fat tissue proportion and skin blood flow (Simmons et al 2011, Neves et al 2015). Future studies should address the differences between trained and untrained participants regarding the relationship between skin temperature and muscle damage.
Another possible explanation for the lack of relationships between skin temperature and CK is that inflammatory processes in the muscle do not occur near to the skin surface. Infrared thermography measures skin temperature and this temperature is not always related with muscle or core temperature (Priego Quesada et al 2016, Fernandes et al 2016). Medical and psychobiological studies have applied thermal stress in their protocols in order to obtain more information about the processes that occur under the skin and how representative of inflammation in deeper structure these could be (Burkes et al 2016, Kolacz et al 2017). Further studies should address this kind of protocol to explore the relationships between exercise-induced muscle damage and skin temperature.
5. Conclusion
Changes in skin temperature are not correlated with the level of exercise-induced muscle damage estimated by CK activity in untrained individuals.
6. Perspective
Infrared thermography has become popular in sports in the recent years. Many coaches and physiotherapists monitor changes in skin temperature screening for injury risks. We found that CK and infrared thermography responses to exercise-induced muscle damage are different. At least for exercise of a specific muscle group in untrained participants, skin temperature did not correlate with the creatine kinase activity. Therefore, the use of infrared thermography to predict or monitor muscle damage deserves further attention.
Acknowledgments
The authors would like to acknowledge the staff from the Applied Neuromechanics Group in the extraction of thermographic data. This study was financed in part by the Coordenação de Aperfeiçoamento de Pessoal de Nível Superior—Brasil (CAPES)—Finance Code 001 awarded to ASM and a postdoctoral fellowship awarded to MAS. A research fellow of CNPq-Brazil supports FPC. The authors declare that they have no financial or other conflict of interests concerning the content of this paper.