


Abstract
identifying the most at risk older people in Emergency Departments (EDs) may help guide clinical practice, and service improvement in emergency care, but little is known about how to implement such tools in practice.
consensus building was used to determine the desirable characteristics of a risk stratification process, including focus groups and literature reviewing. Candidate tools were tested using clinical vignettes in semi-structured interviews with a range of clinicians working in one large ED, assessing speed of use, ease of use and agreement with clinical judgement. The primary outcome was the likelihood of future use of a given frailty tool.
the ideal tool characteristics included brevity (<1 min), simplicity and multidimensionality; tools selected for testing included the Identification of Seniors At Risk, Clinical Frailty Scale, PRISMA-7 and Silver Code. One hundred and twenty-one staff members (43% of the total ED workforce) were recruited from one large ED in the East Midlands. Two hundred and thirty-six individual frailty tool assessments were undertaken using 1 of 10 clinical vignettes; 75% of staff stated that they would use at least one of the tools again, with no significant differences between the individual tools. The median time to complete the tool was around 1 min per patient for all four tools. There were no significant differences in timing, ease of use or agreement with clinical judgement between tools.
validated risk stratification tools are quick, simple, easy to use and 75% of staff would use the tools again in the future.
Introduction
There is a growing awareness that the identification of frailty in the urgent care context is important, allowing a population at high risk of harm and resource use to be flagged for focussed interventions [1–3]. Yet in the UK at least, frailty identification is not routine—of 121 services responding to a survey, 32 (26%) said that they used a standardised clinical instrument; nor is it standardised, with each service using on average 2.4 different frailty identification methods. If frailty identification is to be used to direct patients towards an appropriate clinical response, it is logical for the process to start at the beginning of the patient's urgent care episode. For example, delays in identifying and managing delirium (a hyperacute manifestation of frailty) are associated with increased patient harm [4]. Earlier identification and management of frailty syndromes, such as delirium, has the potential to improve outcomes [5].
Whilst there have seen several papers examining the clinicometric properties of frailty rating scales [1, 6, 7], few studies have addressed the practical issues relating to implementation [8]. Ease of use and the level of training required to complete the tool are all important factors determining acceptability to staff [9], especially in the fast-paced emergency medicine environment. Even tools with the best reliability and validity will not be used if they are too difficult, take too long, or can only be used by a few trained people. To address this potential translation gap, we undertook a study of several commonly used frailty rating or risk stratification tools for older people with urgent care needs. The aim of the study was to ascertain which validated tools were quick, simple and acceptable for use in clinical practice.
Methods
This was a mixed methods study, involving collaboration with relevant stakeholders, a literature review, focus groups and semi-structured staff survey to build an overall view as to which tools are most likely to be acceptable in clinical practice [10].
Tool selection
A survey was undertaken at a frailty symposium at the Royal College of Physicians Edinburgh in 2015; 192 people from healthcare backgrounds took part. Of the participants that identified their role, 20 were involved in geriatric medicine, 7 were primary care practitioners, 17 were nurses and 3 were pharmacists. The remaining participants were either doctors in training (33), staff grade doctors (30), academics (8) or ‘other’. Participants were asked how long they thought a frailty identification tool should take to complete in the urgent care context: 78% opted for less than 5 min.
Additional discussions were held with a national stakeholder group convened to support a related study looking at acute care for older people with frailty (HoW-CGA). This group consisted of leads from national networks focussing upon urgent care (NHS Acute Frailty Network, and Emergency Care Improvement Programme) and national bodies including the British Geriatrics Society, Royal College of Physicians, Royal College of Emergency Medicine, Society for Acute Medicine, patient/public representatives, therapists, Royal College of Nursing and the Association of Directors of Adult Social Services.
An informal consensus building process (a combination of face-to-face meetings and virtual discussion) highlighted three requirements of an ideal tool for identifying frailty in urgent care. The stakeholders indicated that frailty tools should be multi-dimensional (i.e. tools assessing only one domain of Comprehensive Geriatric Assessment [11], such as cognition, would not be suitable), short (taking less than 5 min) and should have been validated.
A literature review, guided by these criteria, identified 46 potential tools; a further 14 tools were identified from an NHS National Benchmarking exercise looking at acute care for older people [12]. Of the 60 tools, 55 were excluded (23 were uni-dimensional, 13 were reported to take more than 5 min in the original validation studies, four could only be completed after Comprehensive Geriatric Assessment (not thought to be feasible for a screening process), four required specific staff members to complete them and 11 required questions or assessments such as tests of walking speed and grip strength, which were not deemed feasible to assess in patients presenting with urgent care needs).
Although the PRISMA-7 tool had not been validated in an ED setting, it was not excluded, as it was recommended in national policy documents. One of the remaining five was excluded as it was still in development and had not been formally validated (see HoW-CGA, http://www.bgs.org.uk/how-cga/how/how-cga-home), resulting in four tools for testing, described in Table 1.
Details of the frailty/risk stratification tools chosen for testing
| Tool name | Number of items | Scoring system | Predictive properties | Comments |
|---|---|---|---|---|
| Clinical Frailty Scale [13] | 9 |
| In an ED setting when predicting in-patient mortality, area under the curve = 0.72 [1] | Originally required CGA before use but has been validated in the ED setting [1] |
| Identification of Seniors At Risk [14] | 6 | ≥2 = at risk [14] |
| Self-report version [15] |
| PRISMA-7 [16] | 7 | ≥3 = requires further evaluation [16] |
| Tool adapted so not self-report format. |
| Silver code [18] | 6 | ≥11 = highest risk [19] | When predicting mortality in the ED setting, area under the curve = 0.70 [19] |
Vignette development
These frailty tools were tested using clinical vignettes—short stories depicting hypothetical characters in specified circumstances [20]. Case vignettes were chosen for pragmatic reasons—namely the complexity of recruiting, consenting and standardising actual patients at different stages of frailty in the Emergency Department (ED). This also increased the consistency of exposure and meant that participants had to rely on the details of the vignette, rather than their judgement based on the appearance of a patient. For the purpose of this investigation, 10 patient vignettes were created that depicted older patients who may or may not have frailty. The vignettes were created using data from focus groups which involved medical and nursing students discussing their perceptions and understandings of the term ‘frailty’, and further developed and refined with the support of the stakeholder group, to ensure that different frailty states were represented.
Setting
Recruitment took place Monday–Saturday in the ED of the Leicester Royal Infirmary (LRI). The LRI is a large teaching hospital with an ED serving a population of 1.4 million, with approximately 150,000 attendees each year, around 10,000 of whom are 65 or older. The hospital was rated as ‘requiring improvement’ by the Care Quality Commission in 2015; the implementation challenges faced in this setting will be as difficult, if not more so, than other settings.
Recruitment
The ED employed 179 members of nursing staff (qualified nurses or ‘Health Care Assistants’ (HCAs)) and 104 doctors. The majority of recruitment took place in the morning, between the hours of 7.30 am and 12.00 pm, as this appeared to be a more convenient time for the department. This avoided needing to disturb staff at night, which is often a busy and difficult time, but allowed all staff to potentially be interviewed, as they all work on rotating shifts.
Information sheets were disseminated via workplace email addresses, as well as at staff handovers during which there was a daily briefing, and then members of staff were approached ‘on the shop floor’.
Participants were asked to complete a formal consent procedure on the shop floor, after having time to read through the details of the study.
Staff interviews
The aim of testing with front line clinicians was to assess the feasibility of different frailty tools, assessed primarily by looking at whether clinicians would use a given tool again in the future. Clinicians’ attitudes towards frailty tools were assessed by asking ‘have you ever used frailty identification tools in practice?’ and ‘would you use frailty identification tools in your clinical practice, in the future?’ [21]. To identify what barriers exist to staff using frailty tools, staff members were asked ‘what stops you from using frailty tools more regularly?’
The initial interview guide was tested for ease of understanding with nine clinicians from different backgrounds in the ED prior to wider use; minor amendments were made to improve clarity.
The interview process involved giving the participant one vignette to read over and they were asked whether they thought the depicted patient had frailty, or not. They were then given one of the four assessment tools to use to rate the patient as frail or not frail, which was timed. They were then asked questions on the ease of use, the quality of the tool, and what they did and did not like about the tool, using the semi-structured interview shown in Supplementary data, Appendix 1, available at Age and Ageing online. This process was then repeated with a different vignette and a different assessment tool. After the second round, participants were asked questions about frailty tools in general, including what they like about them, and what they found problematic about frailty tools.
Analyses
Following discussion with the external stakeholder group, we chose the proportion of people who would use any sort of frailty tool again as our primary outcome, as this best reflected peoples’ future intentions and would show the willingness of staff to engage with a frailty identification system. Other outcomes included time taken to complete an assessment; the proportion of people who would use an individual tool again in the future; subjective ease of use scores (simple Likert scale); and the proportion in whom the frailty tool results agreed or disagreed with the participant's clinical judgement.
All analyses were completed using Stata/IC 14.0. Where averages were required, histograms were created and where distributions were not normal, medians and interquartile ranges were calculated. For binomial data, proportions and 95% confidence intervals were calculated. Agreement was calculated using kappa scores (<0.20 = poor, 0.21–0.40 = fair, 0.41–0.60 = moderate, 0.61–0.80 = good and 0.81–1.00 = very good agreement) [22].
Job roles were condensed into six categories: HCA, junior nurse, senior nurse, junior doctor, senior doctor, and manager. Junior nurses consisted of all nursing staff of band six and below. Junior doctors included all doctors currently in training or trust grade doctors. Senior doctors comprised of consultants, associate specialists and qualified general practitioners (GPs) working in the department. Senior nurses consisted of lead nurses, advanced nurse practitioners, and gerontological nurse specialists.
The quantitative data were tabulated in excel, and logical checks were undertaken to look for errors (e.g. extreme values). Cross-checks were undertaken to look at internal consistency (e.g. if the rater reported frailty estimates, there should always be a measure of agreement with the ‘gold standard’). Random error was checked through a process of double data entry by a second researcher. A sample of 20 responses was checked for errors in the 10 quantitative fields, in which one error was found; estimated error rate 0.05%, 95% CI = 0.01–0.2%.
Sample size
An internal sample size estimate was carried out based on the responses from the first 20 participants, in whom 75.8% would use at least one of the tools again. A sample size of 93 would be able to estimate this with 95% confidence intervals (CIs) extending to 10% in either direction, and a sample size of 330 would be required to estimate to within 5% (Minitab 17©). Considering the time-scale of the study and the number of clinicians available for interviews, a sample size of at least 100 was selected.
Qualitative data
Open responses were analysed in NVivo, not reported in detail here.
Governance
Ethical approval was provided by Essex NRES Committee (East of England), reference: 15/EE/024. Funding for this project, which was undertaken as part of an intercalated BSc degree, was provided by the University of Leicester. The study was supported by a related NIHR HS&DR project 12/5003 (acute hospital care for frail older people).
Results
A total of 121 members of staff (43% of the total ED workforce) were recruited. These 121 were made up of junior doctors (36%), junior nurses (28%), HCAs (19%), senior doctors (10%), senior nurses (7%) and one manager; overall, more junior staff of any discipline (80%) were recruited compared to senior staff. Most participants carried out two ratings (112 out of 121, 93%), one carried out four ratings and the remaining eight carried out one rating only. It was not possible to ascertain additional information on non-participants other than their job role.
Future use
For the primary outcome (whether participants would use a frailty tool again), it was answered for 217/236 individual frailty tool assessments; 75% (n = 162) (CI = 68–80%) stated that they would use at least one of the tools again, with no significant differences between the individual tools.
Timings
Timings were made of all ratings (n = 236); the median (interquartile range) time in seconds to each instrument was: CFS 41 (28–58) s, ISAR 66 (52–93) s, PRISMA-7 52 (40–77) s and Silver code 54 (36–86) s (Figure 1).
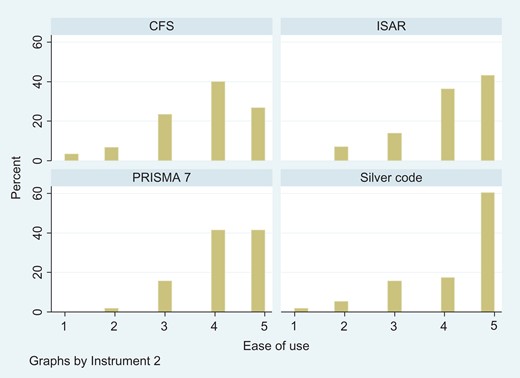
Histograms showing the distribution of the ease of use of each instrument.
There were no significant differences between professions for the time taken to complete an assessment (data not shown).
Ease of use
Participants were asked to rate the ease of use of each tool that they used on a scale of one to five, with one being very difficult and five being very easy. There were no significant differences in ease of use, with all but the Silver Code having a median ease of use score of four out of five (Figure 1).
Agreement
Agreement between participants’ clinical judgement (frail versus non-frail) and the score obtained by when using the tool was calculated from 235 ratings, compared to the frailty rating made by the ‘expert’ group for each vignette. In 83% (n = 193), the clinicians’ judgement of frailty, made immediately after reading the clinical case, agreed with the results they obtained by using the tool. Whilst overall, agreement was good (0.65), it was not perfect [23].
The summary findings are presented in Table 2, which show that overall there were no significant differences between the tools.
Summary of findings for all four tools
| CFS | ISAR | PRISMA-7 | Silver Code | |
|---|---|---|---|---|
| Would use in future n/N, % (95% CI) | 41/55, 75 (61–85)% | 44/52, 85 (72–93)% | 41/52, 79 (65–89)% | 36/58, 62 (48–75)% |
| Median time required in seconds (IQR), number of uses | 41 (28–58), n = 60 | 66 (52–93), n = 58 | 52 (40–77), n = 59 | 54 (36–86), n = 59 |
| Agreement between clinical judgement and tool score (kappa (standard error)), number of uses | 0.68 (0.13), n = 60 | 0.80 (0.14), n = 58 | 0.72 (0.14), n = 59 | 0.44 (0.12), n = 59 |
| Median ease of use score (IQR), number of uses | 4 (3–5), n = 60 | 4 (4–5), n = 58 | 4 (4–5), n = 58 | 5 (4–5), n = 58 |
| Preferred to other tools (%) | 63/214, 29 (23–36)% | 50/214, 23.4 (18–30)% | 48/214, 22.4 (17–29)% | 53/214, 24.8 (19–31)% |
‘Would use again’ refers to the proportion of individuals using a tool that would use it again in the future; ‘median time’ is the time to use in seconds for each tool; ‘agreement’ refers to the agreement between the rater and the gold standard rating of frailty for a given vignette; ‘median ease of use’ is on a Likert scale for each tool per use; ‘preferred’ the number of times a tool was preferred over another as proportion of all ratings.
Open responses
Commonly stated barriers that stopped people using frailty tools more often were: time, lack of availability, not wanting to force patients into categories, using clinical judgement instead and the feeling that it was ‘someone else's role’.
Some positive thoughts about frailty tools included: identifying patients they might ordinarily miss, helpful for ‘grey cases’, and help to back-up clinical decision-making.
A few participants felt that the tools were too easy or over-simplified, but many felt that ease and simplicity were important characteristics in the ED.
Discussion
This study assessed some of the practical issues relating to the use of four commonly used frailty or risk stratification tools in a large, busy ED. Overall, there were no significant differences between the tools, although the Clinical Frailty Scale appeared slightly quicker to use, carried more ‘added value’ (the lower agreement between clinician judgement alone and the clinician's judgement when using the tool indicates that the tool changes clinical impressions more often), was more likely to be preferred in comparison to others, but was slightly less likely to be used in the future.
Although this study has not demonstrated that one tool is superior, it does give organisations or clinicians a range of evidence to inform their considerations about which tool to implement. Strengths of the study include the wide range of staff recruited in ‘real-life’ circumstances, and the range of practical issues discussed that are likely to relate to implementation. The use of a vignette rather than ‘real’ patients might have detracted slightly from the validity of the results, but the standardised approach the vignettes allowed also adds rigour that would have been difficult to reproduce with actual patients. A weakness of the study is that it did not test all possible frailty tools, for example the Fried [24] or Triage Risk Stratification Tool [25]; this relates to the exclusion of studies requiring a physical measurement not thought to be feasible in the urgent care setting (e.g. walking speed) or lacking published, objective detail on timings. Not all ED staff participated in the project, and it is possible that those that did not might have responded differently from those that did. The results may have been different in a different hospital setting.
Some participants stated that they did not or would not use frailty tools because they ‘use their clinical judgement instead’; the kappa scores indicate that this clinical judgement is not always accurate when compared to formal scales. Moreover, whilst clinical judgement is important, but it is not a generalisable and reliable process that covers all staff, and so is a source of variation. Time to complete tools was frequently cited as a barrier, yet our finding that the tools take around 1 min provides some reassurance to busy urgent care staff. Other methods of identifying frailty or risk, such as CGA and computer-based systems, are not feasible for every setting in terms of the time, financial, and human resources required; all still require some judgements to be made. Until more reliable methods are developed and implemented, frailty tools can fill the gap and encourage staff members to think about frailty on a regular basis.
There are potential disadvantages to identifying frailty—firstly, it is not a preferred term by older people themselves [26]; secondly, if not used in the way intended, it might lead to care being denied to older people—a new form of ageism; finally, it is possible that services might be tempted to use frailty to direct clinical care. This is not appropriate, as frailty tools have only been designed to identify a cohort of people at risk of increase harms, in whom a more holistic assessment might be needed. There is no evidence that frailty rating in and of itself, can be used to direct clinical care. The advantages of identifying frailty in the ED setting are multiple. Firstly, it can prompt a more holistic clinical assessment, guided by the principle of Comprehensive Geriatric Assessment [27]. Secondly, it can directly influence clinical decision making; for example, identifying an individual with a CFS score of 9 indicates that they are at high risk of death as an in-patient. This might prompt more aggressive treatment, or alternatively a more palliative approach: in either case it has the potential to influence clinical decision making. Thirdly, it can guide decision about disposition from the ED—it can identify the risk of readmission for those being discharged, or guide referral to geriatric services for those requiring admission. Finally, measuring the magnitude and nature of frailty in the ED, and mapping this onto patient flow pathways can guide service design.
Frailty is an important marker of adverse outcomes for older people accessing emergency care.
No frailty/risk stratification tool has perfect clinometric properties; moreover, there is little guidance on how such tools can be implemented in clinical practice.
Four commonly used and validated frailty/risk stratification tools tested were quick, simple and easy to use. A 75% of Emergency Department (ED) staff would use at least one of the tools again in the future.
The advantages of identifying frailty in the ED include prompting a more holistic clinical assessment, influencing clinical decision-making, guide disposition decisions or service design.
Supplementary data
Supplementary data mentioned in the text is available to subscribers in Age and Ageing online.
Funding
Funding for this project, which was undertaken as part of an intercalated BSc degree, was provided by the University of Leicester.
Conflicts of interest
S.C. is an active researcher in the field, seeking funding to support related studies in this area.

Comments