


Abstract
Systemic maternal infections have been associated with preterm delivery. The authors examined the association of C-reactive protein (CRP), a marker of inflammation, with preterm delivery. This nested case-control study was conducted within Project Viva in Massachusetts between 1999 and 2002. Subjects were 117 women who delivered preterm (<37 weeks' gestation) and 117 controls (term deliveries) matched on age, race/ethnicity, and smoking status. High-sensitivity CRP assays were performed on early-pregnancy (5.3–19.3 weeks' gestation) plasma samples. Odds ratios and 95% confidence intervals were estimated by using conditional logistic regression adjusted for matching factors, gestational age at blood collection, and prepregnancy body mass index. Median concentration of CRP was 3.2 mg/liter in cases versus 2.4 mg/liter in controls. No significant association was found between quartiles of CRP and preterm delivery. However, CRP levels exceeding the threshold defined in the literature were associated with increased risk of preterm delivery (odds ratio = 2.55, 95% confidence interval: 1.05, 6.02 for CRP ≥8 mg/liter). The association was stronger among cases who experienced spontaneous delivery (odds ratio = 4.64, 95% confidence interval: 0.94, 22.96) versus indicated delivery (odds ratio = 1.42, 95% confidence interval: 0.44, 4.61). These findings suggest that very high CRP levels in early pregnancy are associated with preterm delivery.
Intrauterine infections may contribute to 40–50 percent of all preterm births (1). Systemic maternal infections lead to increased inflammatory cytokine levels, which in turn stimulate prostaglandin production; this process can lead to the induction of uterine contractions and cervical ripening culminating in preterm parturition. High concentrations of proinflammatory cytokines such as interleukin-6 and interleukin-8 in serum have been reported in women with symptoms of preterm labor and have been prospectively associated with preterm birth (2). While preterm labor is associated with elevated levels of interleukin-6 in amniotic fluid and fetal plasma sampled by cordocentesis, the association of maternal plasma interleukin-6 with preterm labor is less consistent (3, 4). The widespread clinical use of amniotic fluid and umbilical cord blood is limited because of the invasive nature of amniocentesis. Measurement of circulating inflammatory markers may thus provide an alternative method of detecting women at high risk of preterm delivery.
C-reactive protein (CRP) is a sensitive marker of systemic inflammation and is primarily synthesized in hepatocytes in response to infection and tissue injury (5). Production of CRP is stimulated by the release of proinflammatory cytokines including interleukin-1, interleukin-6, and tumor necrosis factor-alpha. Although sometimes referred to as an acute-phase reactant, CRP accompanies both acute and chronic inflammatory disorders.
Maternal concentrations of CRP have been studied as an aid to diagnosing subclinical infection in pregnant women who experience preterm labor and premature rupture of membranes (6, 7). Recently, elevated levels of CRP measured during gestation have been linked to adverse pregnancy outcomes such as preeclampsia (8, 9) and intrauterine growth restriction (9). To our knowledge, there are only two studies of the relation between CRP levels in maternal circulation during the second trimester of pregnancy and risk of preterm delivery. These studies showed contradictory results. Hvilsom et al. (10) reported a significant association of elevated serum CRP levels with a nearly twofold increased risk of delivery before 37 weeks' gestation. Ghezzi et al. (11) found no relation between circulating CRP levels and preterm delivery. However, they observed a higher median amniotic fluid CRP level in women who delivered preterm compared with women who delivered at term. In light of the conflicting reports, we examined prospectively the association between maternal plasma CRP levels in early pregnancy and risk of subsequent preterm delivery among a cohort of singleton pregnant women.
MATERIALS AND METHODS
Study population
The study population consisted of pregnant women participating in Project Viva, a prospective cohort study of prenatal diet, pregnancy outcomes, and offspring health (12). All women attending their first prenatal visit at one of eight Harvard Vanguard Medical Associates centers in eastern Massachusetts were eligible for Project Viva. Exclusion criteria included multiple gestation, inability to answer questions in English, a plan to move out of the area before delivery, and gestational age greater than 22 completed weeks at the initial prenatal visit. We enrolled 2,670 consenting women between April 22, 1999, and July 31, 2002, of whom 329 subsequently became ineligible because of multiple gestation (n = 19), because obstetric care was transferred to a nonstudy site (n = 115), or because the women were no longer pregnant (n = 195). Of the 2,341 remaining participants, 195 (8 percent) withdrew and 18 (<1 percent) were lost to follow-up. For this analysis, of the 2,128 participants who delivered a live infant, we included the 2,088 women who also provided blood samples in early pregnancy.
The research protocol was approved by the human subjects committee of the participating institutions. All participants received a detailed explanation of the study before providing signed consent.
Data collection
At the initial prenatal visit, each participant provided a plasma sample that was collected in ethylenediaminetetraacetic acid, refrigerated for several hours, and then transported on ice to a central laboratory, where it was centrifuged, aliquotted, and frozen in liquid nitrogen until the time of analysis. Gestational age at blood sampling was 5.3–19.3 weeks (mean, 9.7; standard deviation, 2.1). We obtained information on demographic, medical, and reproductive history through interview and self-administered questionnaires (12). The questionnaire also assessed health-related habits including alcohol consumption, tobacco use, and physical activity. Prepregnancy body mass index was computed by dividing self-reported prepregnancy weight in kilograms by height in meters squared. We reviewed medical records for birth outcome and delivery information. The initial criterion for establishing gestational age was the last menstrual period. If the estimate was different from the ultrasound estimate by 10 days or more, we estimated gestational age from the second-trimester ultrasound. Participants with a diagnosis of genitourinary infection at any time during pregnancy were identified according to International Classification of Diseases, Ninth Revision, codes from the automated medical record system; included were infections and inflammations of the kidney, urethra, urinary tract, and pelvic organs and genital organs, including sexually transmitted diseases.
Case-control selection
In this analysis, we used a prospective, nested case-control approach in which cases were Project Viva participants who experienced preterm delivery (<37 weeks' gestation). Controls were randomly selected from among those women who delivered at 37 or more weeks' gestation, matched 1:1 to cases by age (±5 years), race/ethnicity, and cigarette smoking during the 3 months before the woman learned she was pregnant (yes/no). We identified 118 case-control pairs who met our eligibility criteria. One matched pair was excluded because of an insufficient blood sample for the CRP assay. Of the 117 remaining matched pairs, 52.7 percent were White, 23.2 percent were Black, 10.7 percent were Asian, 8.0 percent were Hispanic, and 5.4 percent were of other race/ethnicity; 16.7 percent had smoked in the 3 months before they knew they were pregnant.
Laboratory procedures
We determined the concentration of CRP in baseline plasma samples with a validated high-sensitivity immunoturbidimetric assay on the Hitachi 911 analyzer (Roche Diagnostics, Indianapolis, Indiana) by using reagents and calibrators from Denka Seiken (Niigata, Japan) (13). A single technician, blinded to case-control status, performed all assays. The interassay coefficients of variability at concentrations of 0.91, 3.07, and 13.38 mg/liter were 2.81, 1.61, and 1.1 percent, respectively. This assay had a sensitivity of 0.03 mg/liter. For one control who had a CRP value below the detection limit, we imputed a value of 0.015 mg/liter (half of the detection limit).
Statistical analysis
We compared the baseline and delivery characteristics of cases and controls by using descriptive statistics. Spearman correlations between CRP and selected variables were calculated. We used the Kruskal-Wallis test and post hoc Wilcoxon tests with the Bonferroni method to compare median CRP levels between women who delivered before 34 weeks' gestation, women who delivered between 34 and less than 37 weeks, and women who delivered at term.
Conditional logistic regression analyses were performed to evaluate the risk of preterm delivery. We divided the population into categories based on quartiles of CRP levels in the control group. Odds ratios and 95 percent confidence intervals for different levels of CRP were estimated by using the lowest category as the referent. The presence of a linear trend in the risk of preterm delivery across the quartiles was tested by using the median values for each quartile. We also modeled CRP as a binary variable by using two different thresholds: less than 8 mg/liter versus 8 mg/liter or more (6, 14) and less than 12 mg/liter versus 12 mg/liter or more (15), which have been associated with chorioamnionitis (16).
We adjusted for gestational age at blood collection (week) in all analyses, taking into account the possible gestational-age-related changes in CRP during pregnancy. Potential confounders considered in the analysis included gravidity (first vs. later pregnancy), prepregnancy body mass index (kg/m2), occurrence of genitourinary infection during pregnancy (yes/no), annual household income (≥$70,000 or not), maternal education (college degree or not), maternal employment (yes/no), physical activity before or during pregnancy (hours/week), and alcohol consumption during the first trimester (g/day). We assessed potential confounders by using the change in estimate method (17), with a cutpoint of 10 percent. We also conducted analyses separately among cases who experienced spontaneous delivery, indicated delivery, and delivery before 34 weeks' gestation.
To further examine the dose-response relation between CRP and preterm delivery, we compared women with different CRP levels at or above the 75th percentile with women whose CRP levels were below the 75th percentile. The percentiles were derived from the distribution of CRP among controls. Models were based on case-control pairs for whom complete data were available on all covariates of interest. All statistical tests were two sided.
RESULTS
Both cases who delivered preterm and controls were similar regarding age, education, employment status, alcohol consumption, and gestational age at blood collection. Compared with controls, women who experienced preterm delivery were heavier before conception and were more likely to have had previous preterm deliveries and a genitourinary infection during the current pregnancy (data not shown).
CRP was correlated positively with body mass index (r = 0.54, p < 0.001) and negatively with alcohol consumption (r = −0.20, p < 0.01). The correlation with gestational age at blood draw was weak, but significant (r = 0.14, p = 0.03). Median CRP levels were higher in women who had had a previous preterm delivery (4.8 mg/liter; interquartile range, 1.8–8.6) than in those who had not (2.5 mg/liter; interquartile range, 1.0–5.4).
Median concentration of plasma CRP was higher in women who delivered before 34 weeks' gestation (5.0 mg/liter; interquartile range, 2.2–8.2) than in those who delivered between 34 and less than 37 weeks (2.8 mg/liter; interquartile range, 0.9–6.2) and those who delivered at term (2.4 mg/liter; interquartile range, 0.9–4.9) (Kruskal-Wallis test, p = 0.01; figure 1). Post hoc tests suggested a significant difference between women who delivered before 34 weeks' gestation and those who delivered at term (p < 0.01). The observed difference between women who delivered before 34 weeks and those who delivered between 34 and less than 37 weeks was not statistically significance (p = 0.10).
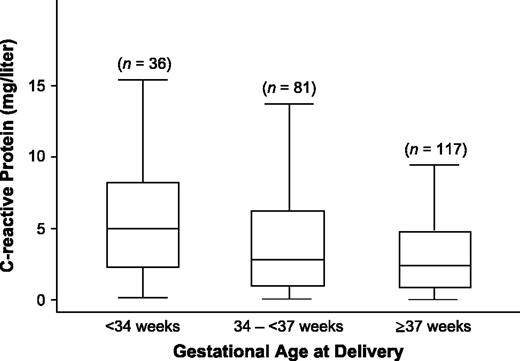
Distribution of C-reactive protein according to gestational age at delivery, Project Viva, Massachusetts, 1999–2003. The boxes represent the interquartile range; the lower edge and upper edge correspond to the 25th and 75th percentiles, respectively. The horizontal line in each box represents the median level of C-reactive protein in each group. The extreme values within 1.5 times the interquartile range from the upper or lower quartile are the ends of the lines extending from the boxes.
Women in the top quartile of CRP had a higher, but nonsignificant risk of preterm delivery compared with women in the lowest quartile (odds ratio (OR) = 1.83, 95 percent confidence interval (CI): 0.82, 4.07; p for trend = 0.09). There was no apparent trend between CRP in quartiles and preterm delivery after adjusting for prepregnancy body mass index (OR comparing extreme quartiles = 1.37, 95 percent CI: 0.54, 3.47; p for trend = 0.44).
For a CRP level of at least 8 mg/liter (vs. <8 mg/liter), the multivariate odds ratio was 2.55 (95 percent CI: 1.05, 6.20); for CRP levels of at least 12 mg/liter (vs. <12 mg/liter), the multivariate odds ratio was 3.19 (95 percent CI: 0.98, 10.32) (table 1) for preterm delivery. The association was stronger for spontaneous preterm delivery (multivariate OR = 4.64, 95 percent CI: 0.94, 22.96 for a CRP level of ≥8 mg/liter, and multivariate OR = 7.24, 95 percent CI: 0.85, 61.53 for a CRP level of ≥12 mg/liter) than for indicated preterm delivery (multivariate OR = 1.42, 95 percent CI: 0.44, 4.61 for a CRP level of ≥8 mg/liter, and multivariate OR = 1.39, 95 percent CI: 0.28, 7.02 for a CRP level of ≥12 mg/liter). When the analyses were restricted to cases who delivered before 34 weeks, the odds ratios associated with CRP levels appeared to be high, but the confidence intervals were very wide. The multivariate odds ratio associated with a CRP level of 8 mg/liter or more was 2.57 (95 percent CI: 0.48, 13.81); for a CRP level of 12 mg/liter or more, it was 3.10 (95 percent CI: 0.31, 31.24).
Association between elevated plasma C-reactive protein concentrations and preterm delivery* according to multivariate conditional logistic regression analysis, Project Viva, Massachusetts, 1999–2003
C-reactive protein concentration | All cases (n = 117) | Spontaneous delivery (n = 55 cases) | Indicated delivery (n = 61 cases) | ||||||
|---|---|---|---|---|---|---|---|---|---|
| Odds ratio | 95% confidence interval | Odds ratio | 95% confidence interval | Odds ratio | 95% confidence interval | ||||
| ≥8 vs. <8 mg/liter† | |||||||||
| Adjusted for gestational age at blood collection‡ | 2.76 | 1.23, 6.21 | 4.70 | 0.99, 22.37 | 1.64 | 0.58, 4.59 | |||
| Multivariate adjusted§ | 2.55 | 1.05, 6.20 | 4.64 | 0.94, 22.96 | 1.42 | 0.44, 4.61 | |||
| ≥12 vs. <12 mg/liter† | |||||||||
| Adjusted for gestational age at blood collection‡ | 2.95 | 1.05, 8.33 | 7.50 | 0.89, 62.95 | 1.29 | 0.34, 4.88 | |||
| Multivariate adjusted§ | 3.19 | 0.98, 10.32 | 7.24 | 0.85, 61.53 | 1.39 | 0.28, 7.02 | |||
For one case, information on type of delivery was missing.
A threshold value of 8 mg/liter corresponded to the 90th percentile, and 12 mg/liter corresponded to the 94th percentile in the control group.
Controlled for matching factors of age, race/ethnicity, and cigarette smoking.
Controlled for matching factors of age, race/ethnicity, and cigarette smoking; additionally adjusted for gestational age at blood collection and prepregnancy body mass index.
Additional analyses comparing women at different CRP levels at or above the 75th percentile with women whose CRP levels were below the 75th percentile (table 2) showed a dose response. The multivariate odds ratio increased from 1.43 (95 percent CI: 0.69, 2.95) for women whose CRP levels were at or above the 75th percentile to 4.17 (95 percent CI: 1.02, 17.03) for those whose CRP levels were at or above the 95th percentile.
Association between plasma C-reactive protein concentrations at different thresholds and preterm delivery according to multivariate conditional logistic regression analysis,* Project Viva, Massachusetts, 1999–2003
C-reactive protein concentration | Cases who delivered preterm | Controls | Multivariate odds ratio | 95% confidence interval | ||||||
|---|---|---|---|---|---|---|---|---|---|---|
| Threshold | mg/liter | No. | % | No. | % | |||||
| <75th percentile | ≤4.85 | 76 | 65.0 | 87 | 74.4 | Referent | ||||
| ≥75th percentile | >4.85 | 41 | 35.0 | 30 | 25.6 | 1.43 | 0.69, 2.95 | |||
| ≥80th percentile | >5.29 | 39 | 33.3 | 25 | 21.4 | 1.53 | 0.73, 3.19 | |||
| ≥85th percentile | >6.50 | 30 | 25.6 | 18 | 15.4 | 2.03 | 0.86, 4.83 | |||
| ≥90th percentile | >7.96 | 26 | 22.2 | 12 | 10.3 | 2.44 | 0.95, 6.28 | |||
| ≥95th percentile | >15.29 | 14 | 12.0 | 6 | 5.1 | 4.17 | 1.02, 17.03 | |||
Controlled for matching factors of age, race/ethnicity, and cigarette smoking; additionally adjusted for gestational age at blood collection and prepregnancy body mass index.
DISCUSSION
In this study of singleton pregnancies, we found that very high levels of maternal plasma CRP in early pregnancy were associated with increased risk of preterm delivery. Compared with women with normal CRP levels, those with elevated CRP levels (≥8 mg/liter) had a greater than twofold higher odds of preterm delivery. The association was stronger for cases who experienced spontaneous preterm delivery versus indicated preterm delivery. These findings suggest that inflammation, as represented by elevated CRP levels, could lead to the physiologic changes that result in preterm delivery.
Our results support those from a previous nested case-control study of serum CRP collected early in the second trimester from 84 women who delivered spontaneously before 37 weeks' gestation and 400 normal controls (10). Elevated CRP levels at different cutoff values corresponding to the 75th, 80th, 85th, and 90th percentiles among the controls (5.6, 6.6, 7.6, and 9.9 mg/liter, respectively) were significantly associated with increased risk of preterm delivery, with crude odds ratios of 1.7–2.0, but no dose-response effect was observed. In the present study, we compared women's CRP levels below the 75th percentile with those whose CRP levels were at or above the 75th, 80th, 85th, 90th, and 95th percentiles to hold the comparison group constant and were able to find a dose-response relation between CRP and preterm delivery for women in the highest quartile.
In another study of women who provided blood at 15–18 weeks' gestation, women who delivered spontaneously before 34 weeks had slightly higher median CRP levels (0.6; range, 0–5.6 mg/dl; n = 10) than those who delivered at term (0.5; range, 0–2.6 mg/dl; n = 280) (11); however, the difference was not statistically significant. A recent, small study also reported a higher median level of serum CRP in women who subsequently delivered at 36 weeks or less (8.26 mg/liter, n = 30) compared with those who delivered at more than 36 weeks (4.4 mg/liter, n = 35, p < 0.05). However, it is not clear at which stage of gestation the blood was collected (18).
CRP plays many roles in the inflammatory process. It binds to the surface of pathogens and opsonizes them for uptake of phagocytes. CRP can also activate the classic complement cascade by binding to C1q (19). Another proinflammatory function of CRP includes the induction of cytokines and tissue factor in monocytes (20). However, its main function is antiinflammatory by decreasing neutrophil migration to the site of inflammation, preventing adhesion of neutrophils to endothelial cells (21), and affecting clearance of nuclear antigens released from apoptotic or necrotic cells (22). Apart from infections, inflammation, and trauma, factors associated with increased levels of CRP include obesity, cigarette smoking, hormone use, metabolic syndrome, and cardiovascular disease (23). Moderate alcohol consumption, increased physical activity, and medication use (particularly statins, fibrates, and niacin) are associated with reduced CRP levels (23).
Recent literature identifies adiposity as a key factor in low-grade chronic inflammation (24). Higher body mass index is associated with elevated CRP concentrations in adult men (25), nonpregnant women (25), and pregnant women (26). Overweight women may thus be more likely to have chronic inflammation, elevated CRP levels, and increased risk of preterm delivery. In our study, the positive association between CRP and preterm delivery persisted after adjusting for prepregnancy body mass index and other known risk factors for preterm delivery including maternal age, race/ethnicity, and smoking.
Our study is considerably larger than other investigations that have evaluated associations between biomarkers and adverse pregnancy outcomes. The matched case-control approach improved efficiency, and the prospective design allowed us to evaluate temporality. The high follow-up rate minimized possible selection bias. Previous studies reported only crude analyses. The rich database of Project Viva enabled us to control for important potential confounders. To reduce errors, we determined gestational age by last menstrual period and ultrasound.
This study has certain limitations. Precision of estimates was affected by the relatively small number of cases who delivered preterm, especially those women with extremely high CRP values. As in other observational studies, we cannot rule out the possibility of residual confounding. We identified the presence of genitourinary infections by using International Classification of Diseases codes in medical records. However, chorioamnionitis that may precipitate preterm delivery is usually asymptomatic and thus might not be detected. Potential confounders not examined in this study include conception by assisted reproduction techniques and other maternal infections. Our analysis did not adjust for history of preterm delivery (albeit a strong risk factor for preterm delivery) because controlling for past events in the study of present events might introduce a bias (27).
In this study, we were unable to evaluate whether CRP levels were elevated before as well as after conception. We also do not know whether the association of CRP with preterm delivery reflects causality; that is, if reducing CRP levels would result in less preterm delivery. Future studies should evaluate whether changes in CRP levels over the course of pregnancy are predictive of gestational duration and confirm whether a dose-response relation between CRP and preterm delivery is restricted to women whose CRP levels are above a certain threshold.
In summary, we found that CRP levels of more than 8 mg/liter in early pregnancy were associated with preterm delivery independent of many other determinants of preterm delivery. The association was apparent primarily for spontaneous preterm delivery. These results are consistent with the hypothesis that chronic low-grade inflammation may raise CRP levels and cause preterm delivery.
This study was funded by National Institutes of Health grants DE14004, HD34568, and HL68041 and by the March of Dimes Birth Defects Foundation.
Dr. Pitiphat was supported by the Royal Thai Government Scholarship.
The authors thank the Project Viva staff for their various forms of assistance: Sheryl Rifas, Stevan DeProsse, Katie Blackburn, Cheryl Foley, Rachel Fournier, Emily Strong, Heather Brymer, Jennifer Dotson, and Jody Senter.
Conflict of interest: none declared.
References
Goldenberg RL, Hauth JC, Andrews WW. Intrauterine infection and preterm delivery.
Romero R, Gomez R, Ghezzi F, et al. A fetal systemic inflammatory response is followed by the spontaneous onset of preterm parturition.
Gomez R, Romero R, Mazor M, et al. The role of infection in preterm labor and delivery. In: Elder MG, Romero R, Lamont RF, eds. Preterm labor. New York, NY: Churchill Livingstone,
Pepys MB, Baltz ML. Acute phase proteins with special reference to C-reactive protein and related proteins (pentaxins) and serum amyloid A protein.
Yoon BH, Jun JK, Park KH, et al. Serum C-reactive protein, white blood cell count, and amniotic fluid white blood cell count in women with preterm premature rupture of membranes.
Wolf M, Kettyle E, Sandler L, et al. Obesity and preeclampsia: the potential role of inflammation.
Tjoa ML, van Vugt JM, Go AT, et al. Elevated C-reactive protein levels during first trimester of pregnancy are indicative of preeclampsia and intrauterine growth restriction.
Hvilsom GB, Thorsen P, Jeune B, et al. C-reactive protein: a serological marker for preterm delivery?
Ghezzi F, Franchi M, Raio L, et al. Elevated amniotic fluid C-reactive protein at the time of genetic amniocentesis is a marker for preterm delivery.
Gillman MW, Rich-Edwards JW, Rifas-Shiman S, et al. Maternal age and other predictors of newborn blood pressure.
Roberts WL, Moulton L, Law TC, et al. Evaluation of nine automated high-sensitivity C-reactive protein methods: implications for clinical and epidemiological applications. Part 2.
Mazor M, Kassis A, Horowitz S, et al. Relationship between C-reactive protein levels and intraamniotic infection in women with preterm labor.
Loukovaara MJ, Alfthan HV, Kurki MT, et al. Serum highly sensitive C-reactive protein in preterm premature rupture of membranes.
Bek KM, Nielsen FR, Qvist I, et al. C-reactive protein (CRP) and pregnancy. An early indicator of chorioamnionitis. A review.
Greenland S. Modeling and variable selection in epidemiologic analysis.
Torbe A, Czajka R. Proinflammatory cytokines and other indications of inflammation in cervico-vaginal secretions and preterm delivery.
Janeway CA, Travers P, Walport M, et al. Immunobiology: the immune system in health and disease. New York, NY: Garland Publishing,
Cermak J, Key NS, Bach RR, et al. C-reactive protein induces human peripheral blood monocytes to synthesize tissue factor.
Ahmed N, Thorley R, Xia D, et al. Transgenic mice expressing rabbit C-reactive protein exhibit diminished chemotactic factor-induced alveolitis.
Burlingame RW, Volzer MA, Harris J, et al. The effect of acute phase proteins on clearance of chromatin from the circulation of normal mice.
Pearson TA, Mensah GA, Alexander RW, et al. Markers of inflammation and cardiovascular disease: application to clinical and public health practice: a statement for healthcare professionals from the Centers for Disease Control and Prevention and the American Heart Association.
Berg AH, Scherer PE. Adipose tissue, inflammation, and cardiovascular disease.
Visser M, Bouter LM, McQuillan GM, et al. Elevated C-reactive protein levels in overweight and obese adults.
Ramsay JE, Ferrell WR, Crawford L, et al. Maternal obesity is associated with dysregulation of metabolic, vascular, and inflammatory pathways.

