


Abstract
The authors conducted a 10-year prospective cohort study of mortality in relation to white blood cell counts of 437,454 Koreans, aged 40–95 years, who received health insurance from the National Health Insurance Corporation and were medically evaluated in 1993 or 1995, with white blood cell measurement. The main outcome measures were mortality from all causes, all cancers, and all atherosclerotic cardiovascular diseases (ASCVD). Hazard ratios and 95% confidence intervals were calculated using Cox proportional hazards models with adjustment for age and potential confounders. During follow-up, 48,757 deaths occurred, with 15,507 deaths from cancer and 11,676 from ASCVD. For men and women, white blood cell count was associated with all-cause mortality and ASCVD mortality but not with cancer mortality. In healthy nonsmokers, a graded association between a higher white blood cell count and a higher risk of ASCVD was observed in men (highest vs. lowest quintile: hazard ratio = 2.10, 95% confidence interval: 1.50, 2.94) and in women (hazard ratio = 1.35, 95% confidence interval: 1.17, 1.56). In healthy smokers, a graded association between a higher white blood cell count and a higher risk of ASCVD was also observed in men (highest vs. lowest quintile: hazard ratio = 1.46, 95% confidence interval: 1.25, 1.72). These findings indicate that the white blood cell count is an independent risk factor for all-cause mortality and for ASCVD mortality.
The white blood cell count is an integrated indicator of inflammatory stimuli on both acute and chronic time frames. It is elevated acutely by infection and other stresses and chronically by irritative or toxic exposures, such as tobacco smoking. Although the white blood cell count is variable from day to day (1), a single measurement has been shown to predict risk for death and for specific diseases, including cancer and cardiovascular diseases (2, 3). Elevation of the white blood cell count may reflect the underlying disease process, and white blood cells may play a role in the pathogenesis of injury; an elevation of the white blood cell count may also be a consequence of the development of disease. Perhaps because of the nonspecificity of the white blood cell count, it has been shown to predict risk for multiple diseases.
Several studies over the last three decades have shown a positive and independent association between white blood cell count and risk for coronary heart disease (3–8), stroke (4, 9–11), and all-cause mortality (7, 12–15). These associations have been found with control for potential confounding by other factors, including smoking and other cardiovascular risk factors. The white blood cell count has also been found to be predictive of mortality from cancer in some, but not all, studies (7, 16–18). The evidence largely comes from studies in Western countries, leaving uncertainty as to the generalizability of the findings. The association of the white blood cell count with mortality or morbidity could be different in Asian people, particularly because Asian men have high smoking rates and women generally have low smoking rates, less than 5 percent (19).
We are conducting a prospective cohort study of the causes of cancer in a cohort of 1.3 million Koreans, the Korean Cancer Prevention Study. The participants were initially identified by their participation in a routine clinical examination carried out by the National Health Insurance Corporation (20). Of the 1.3 million, over 430,000 had a measurement of white blood cells in 1993 and/or 1995. In this paper, we address the relation between the level of white blood cell count and the risk for mortality in this subgroup of the Korean Cancer Prevention Study.
MATERIALS AND METHODS
Study participants
The Korean Cancer Prevention Study is a cohort study designed to assess risk factors for mortality and morbidity from all causes, atherosclerotic cardiovascular diseases (ASCVD), and cancer, as well as medical morbidity. This analysis is based on a subset of Korean Cancer Prevention Study participants having a white blood cell measurement. The development of this cohort from participants in the Korea Medical Insurance Corporation has been described elsewhere (21). In brief, the cohort was selected from government employees, teachers, and their dependents who were members in 1992–1995, had at least one routine medical examination, completed a health and lifestyle questionnaire during that time, and were 30 years of age or older. All insured workers are required to participate in biennial medical examinations, while their dependents participate on a voluntary basis. In 1992, 94 percent of the insured workers completed the biennial examinations; a total of 95 percent completed the biennial examinations in 1994. For dependents, the percentages were 37 percent in 1993 and 24 percent in 1995. In 1993 and 1995 only, a blood sample was obtained from dependents for measurement of white blood cells.
The full Korean Cancer Prevention Study cohort includes 1,329,525 Koreans (846,907 men and 482,618 women) from 30 to 95 years of age who met the above selection criteria. Of the study participants, 784,870 (59.0 percent) were enrolled in 1992, 367,903 (27.7 percent) in 1993, 98,417 (7.4 percent) in 1994, and 78,335 (5.9 percent) in 1995. Of the 1,329,525 participants, 3,719 who reported a history of any form of cancer at enrollment and 1,483 who died from cancer before the start of follow-up were excluded. We further excluded the following numbers of participants because of missing information: 9,619 on alcohol drinking, 17,108 on fasting serum glucose, and 16,920 on weight or height. The final sample size for the full Korean Cancer Prevention Study was 1,283,112. For this analysis, we restricted the sample to the 438,500 (34.1 percent) for whom the white blood cell count had been measured.
Data collection
The biennial examinations followed a standard procedure and were conducted by medical staff at local hospitals. The completed questionnaires were reviewed and edited by trained staff and then entered into a database. The data were edited further before analysis. On the 1992, 1993, 1994, and 1995 questionnaires, participants were asked to describe their smoking habits, along with other health habits including alcohol consumption. Total daily alcohol consumption was expressed as the number of glasses per week, expressed in relation to Korea's most popular alcoholic beverage, “soju.” One glass of soju contains about 12 g of ethanol. Participants were also asked to report if they exercised regularly with the question, “Do you do regular exercise?”.
The white blood cell counts were quantified by automated blood cell counters (Beckman Coulter, Fullerton, California) in hospital laboratories, and cell counts are expressed in Système International d'Unités (× 109cells/liter). Differential white blood cell determinations were not performed. Fasting serum glucose, total serum cholesterol, and liver function tests, including alanine aminotransferase and aspartate aminotransferase, were measured under fasting conditions for routine clinical purposes. Each hospital had internal and external quality control procedures directed by the Korean Association of Laboratory Quality Control.
The follow-up period for the full cohort was up to 11 years from January 1, 1993, to December 31, 2003. For this analysis, follow-up began with the calendar year following the year during which the white blood cell count was measured. This approach was followed because the exact dates of completion of the survey form were not recorded. Consequently, follow-up accrual began on January 1 of the calendar year following the year in which the white blood cell count was measured and the survey form was completed. Persons who completed a survey but died within the calendar year of the survey were excluded.
Outcomes
A principal outcome variable was mortality from all causes from cancer (International Classification of Diseases, Tenth Revision, codes C00–C97) and from ASCVD (International Classification of Diseases, Tenth Revision, codes I10–I15, I20, I21, I25, I44–I51, and I60–I74). Outcomes for mortality were ascertained from the causes of death listed on death certificates. A computerized search of death certificate data from the National Statistical Office in Korea was performed, using the unique identification number assigned at birth. Causes of death were assigned at the hospitals by trained abstractors. The first hospitalization for ASCVD was also considered as an outcome.
Data analysis
The white blood cell count was categorized as follows: <5.0, 5.0–5.9, 6.0–6.9, 7.0–7.9, 8.0–8.9, and ≥9.0 × 10⁹ cells/liter. In all primary analyses, the white blood cell count category of <5.0 × 10⁹ cells/liter was the referent group. Age-adjusted death rates were calculated for each category of white blood cell count level and directly standardized to the age distribution of the 1995 Korean national population. All analyses were stratified by gender and smoking status, which was described as all smokers, healthy smokers, all nonsmokers, or healthy nonsmokers. For this stratification, healthy participants were defined as those without any past history of diseases reported on the baseline questionnaire. We computed the hazard ratio (the hazard for mortality in a specific white blood cell count category divided by the corresponding hazard in the referent category (<5.0 × 10⁹cells/liter)) using Cox proportional hazards modeling (22) to adjust for age and other potential confounding factors. In the Cox model, smoking status was included as a single dummy variable for ever smokers, with three categories of amount smoked (1–9, 10–19, and ≥20 cigarettes per day), and alcohol use as five categories (none, 1–24, 25–49, 50–99, and ≥100 g per day). Effect modification by gender and smoking was assessed in a model that included white blood cell count as a continuous variable, and smoking and gender as indicator variables, along with product terms for white blood cell count with smoking and gender.
RESULTS
Because the white blood cell count was measured only for participants aged 40 or more years, the age distribution of participants included in this analysis was older than that for the Korean Cancer Prevention Study population overall and included a greater proportion of women, as the 1993 and 1995 survey participants were primarily women. The population was mostly middle-aged, with approximately three times as many women as men (table 1). Participants aged 65 years or older comprised 39.1 percent for men and 17.8 percent for women. The population had a low body mass index on average, with 20.1 percent of men and 35.0 percent of women at 25 kg/m2 or above, and only 0.01 percent of men and 0.03 percent of women above 30 kg/m2. Both smoking and alcohol use were substantially more common in men. At baseline, 53.4 percent and 26.4 percent of 113,421 men and 5.8 percent and 2.9 percent of 324,033 women were current smokers and former smokers, respectively.
General characteristics of study participants, Korea, 1993–2003
Characteristic (unit of measure) | Men* | Women* | ||||
|---|---|---|---|---|---|---|
| Nonsmokers (mean (SD†) or %) | Smokers (mean (SD) or %) | Nonsmokers (mean (SD) or %) | Smokers (mean (SD) or %) | |||
| Age (years) | 62.6 (9.1) | 62.3 (8.4) | 53.9 (9.7) | 63.9 (9.8) | ||
| White blood cell count (× 109 cells/liter) | 6.8 (1.7) | 7.3 (1.9) | 6.5 (1.6) | 7.0 (1.8) | ||
| Body mass index (kg/m2) | 23.2 (2.9) | 22.4 (2.9) | 24.0 (3.1) | 23.0 (3.5) | ||
| Total cholesterol (mg/dl) | 190.3 (38.4) | 190.2 (39.0) | 199.2 (39.5) | 205.8 (40.9) | ||
| Systolic blood pressure (mmHg) | 131.2 (21.3) | 129.1 (20.9) | 125.5 (20.8) | 127.0 (22.0) | ||
| Fasting blood sugar (mg/dl) | 98.8 (36.0) | 96.3 (32.3) | 92.9 (26.7) | 95.2 (32.0) | ||
| Obesity‡ | 26.8 | 18.4 | 35.8 | 27.1 | ||
| Hypercholesterolemia‡ | 9.9 | 9.9 | 14.7 | 19.1 | ||
| Hypertension‡ | 50.0 | 45.9 | 38.2 | 41.3 | ||
| Diabetes‡ | 9.2 | 7.8 | 5.0 | 6.8 | ||
| Alcohol drinking | 46.7 | 65.0 | 11.9 | 31.4 | ||
| Exercise | 33.9 | 28.9 | 18.2 | 17.0 | ||
| Cigarette smoking | 91.3 | |||||
| Nonsmokers | 20.2 | |||||
| Former smokers | 26.4 | 2.9 | ||||
| Current smokers | ||||||
| 1–9 cigarettes per day | 15.9 | 3.2 | ||||
| 10–19 cigarettes per day | 21.8 | 1.9 | ||||
| ≥20 cigarettes per day | 15.7 | 0.7 | ||||
Male nonsmokers: n = 22,908; male smokers: n = 90,513; female nonsmokers: n = 295,807; female smokers: n = 28,226.
SD, standard deviation.
Obesity: ≥25 kg/m2; hypercholesterolemia: ≥240 mg/dl; hypertension: systolic blood pressure, ≥140 mmHg, or diastolic blood pressure, ≥90 mmHg, or medication; diabetes: fasting blood sugar, ≥126 mg/dl, or medication.
Characteristics by white blood cell count are presented in table 2. The white blood cell count was positively associated with body mass index; with the prevalences of hypercholesterolemia, hypertension, and diabetes; and with alcohol consumption and smoking. The association of white blood cell count with age differed in men and women.
Characteristics of cohort members by white blood cell count, Korean men and women, 1993–2003
White blood cell count, × 109 cells/liter | |||||||||||
|---|---|---|---|---|---|---|---|---|---|---|---|
| <5.0 | 5.0–5.9 | 6.0–6.9 | 7.0–7.9 | 8.0–8.9 | ≥9.0 | ||||||
| Men (no.) | 8,437 | 20,266 | 27,565 | 24,364 | 15,609 | 17,180 | |||||
| Elderly* (%) | 44.3 | 41.5 | 40.5 | 39.3 | 38.3 | 36.0 | |||||
| Obesity* (%) | 14.0 | 18.5 | 20.0 | 21.5 | 22.0 | 21.4 | |||||
| Hypercholesterolemia* (%) | 6.4 | 8.3 | 9.3 | 10.5 | 10.8 | 12.7 | |||||
| Hypertension* (%) | 42.2 | 45.3 | 46.7 | 48.3 | 47.6 | 47.7 | |||||
| Diabetes* (%) | 7.7 | 7.2 | 8.0 | 8.0 | 8.3 | 9.4 | |||||
| Cigarette smoking (%) | 71.5 | 75.7 | 78.5 | 80.8 | 83.0 | 86.4 | |||||
| Alcohol drinking (%) | 57.3 | 59.5 | 61.2 | 62.1 | 62.6 | 63.1 | |||||
| Exercise (%) | 32.6 | 31.6 | 30.9 | 29.4 | 28.8 | 26.7 | |||||
| Women (no.) | 45,589 | 81,434 | 84,073 | 57,766 | 30,441 | 24,730 | |||||
| Elderly* (%) | 14.1 | 16.1 | 17.5 | 19.1 | 20.6 | 23.9 | |||||
| Obesity* (%) | 26.3 | 31.9 | 35.8 | 38.8 | 40.3 | 42.4 | |||||
| Hypercholesterolemia* (%) | 11.1 | 13.3 | 15.1 | 16.6 | 17.9 | 21.0 | |||||
| Hypertension* (%) | 32.2 | 36.0 | 38.9 | 40.9 | 43.0 | 44.7 | |||||
| Diabetes* (%) | 3.0 | 3.8 | 4.9 | 6.1 | 7.1 | 9.3 | |||||
| Cigarette smoking (%) | 5.6 | 7.1 | 8.5 | 9.9 | 11.3 | 14.8 | |||||
| Alcohol drinking (%) | 11.6 | 13.0 | 13.7 | 14.3 | 15.0 | 15.4 | |||||
| Exercise (%) | 18.9 | 18.5 | 18.2 | 17.7 | 17.2 | 16.3 | |||||
Elderly: ≥65 years; obesity: ≥25 kg/m2; hypercholesterolemia: ≥240 mg/dl; hypertension: systolic blood pressure, ≥140 mmHg, or diastolic blood pressure, ≥90 mmHg, or medication; diabetes: fasting blood sugar, ≥126 mg/dl, or medication.
During 4,045,287 person-years of follow-up, there were 48,757 deaths, with 15,507 from cancer and 11,676 from ASCVD, including 2,114 from ischemic heart disease and 8,160 from stroke.
Table 3 provides the hazard ratios for mortality among men by smoking and reported disease status on entry. The white blood cell count was associated with all-cause mortality only in the two highest strata, and the hazard ratios were greater in nonsmokers than in smokers. The white blood cell count was not associated with risk for death from cancer, but it was positively associated with risk for ASCVD death. There was a progressive rise in the hazard ratios for ASCVD death with increasing white blood cell count. In women, the patterns were similar, but the effect of white blood cell count was lower for ASCVD (table 4).
Hazard ratios* (95% confidence intervals) of white blood cell count for death from all causes, all cancers, and all atherosclerotic cardiovascular diseases in Korean men, 1993–2003
White blood cell count, × 109 cells/liter | |||||||||||
|---|---|---|---|---|---|---|---|---|---|---|---|
| <5.0 | 5.0–5.9 | 6.0–6.9 | 7.0–7.9 | 8.0–8.9 | ≥9.0 | ||||||
| All deaths (no. of cases) | |||||||||||
| All smokers (n = 22,033) | 1.0 | 0.94 (0.89, 1.00) | 0.95 (0.90, 1.00) | 0.99 (0.93, 1.05) | 1.01 (0.95, 1.07) | 1.14 (1.07, 1.21) | |||||
| Healthy smokers (n = 18,169) | 1.0 | 0.96 (0.89, 1.02) | 0.95 (0.89, 1.01) | 1.00 (0.94, 1.07) | 1.01 (0.95, 1.09) | 1.15 (1.08, 1.23) | |||||
| All nonsmokers (n = 4,488) | 1.0 | 0.96 (0.86, 1.07) | 0.97 (0.87, 1.08) | 1.05 (0.94, 1.18) | 1.20 (1.06, 1.36) | 1.38 (1.22, 1.56) | |||||
| Healthy nonsmokers (n = 3,877) | 1.0 | 1.00 (0.88, 1.13) | 1.01 (0.90, 1.14) | 1.10 (0.97, 1.24) | 1.27 (1.12, 1.46) | 1.40 (1.22, 1.60) | |||||
| All cancers (no. of cases) | |||||||||||
| All smokers (n = 8,112) | 1.0 | 0.90 (0.82, 0.99) | 0.87 (0.80, 0.96) | 0.88 (0.80, 0.97) | 0.89 (0.80, 0.98) | 1.00 (0.90, 1.09) | |||||
| Healthy smokers (n = 6,787) | 1.0 | 0.91 (0.82, 1.01) | 0.86 (0.78, 0.96) | 0.92 (0.83, 1.01) | 0.89 (0.80, 1.00) | 1.00 (0.90, 1.11) | |||||
| All nonsmokers (n = 1,280) | 1.0 | 0.80 (0.65, 0.97) | 0.78 (0.65, 0.95) | 0.81 (0.67, 0.99) | 0.97 (0.78, 1.20) | 0.92 (0.74, 1.16) | |||||
| Healthy nonsmokers (n = 1,136) | 1.0 | 0.86 (0.70, 1.07) | 0.86 (0.70, 1.06) | 0.86 (0.69, 1.06) | 1.06 (0.84, 1.33) | 0.94 (0.73, 1.20) | |||||
| All ASCVD† (no. of cases) | |||||||||||
| All smokers (n = 4,301) | 1.0 | 1.13 (0.97, 1.31) | 1.20 (1.04, 1.38) | 1.27 (1.10, 1.46) | 1.35 (1.16, 1.57) | 1.44 (1.25, 1.67) | |||||
| Healthy smokers (n = 3,571) | 1.0 | 1.11 (0.94, 1.30) | 1.19 (1.02, 1.39) | 1.24 (1.06, 1.45) | 1.30 (1.10, 1.53) | 1.46 (1.25, 1.72) | |||||
| All nonsmokers (n = 983) | 1.0 | 1.48 (1.10, 2.00) | 1.76 (1.32, 2.35) | 1.99 (1.49, 2.66) | 2.26 (1.67, 3.07) | 2.33 (1.71, 3.17) | |||||
| Healthy nonsmokers (n = 831) | 1.0 | 1.38 (1.01, 1.90) | 1.65 (1.22, 2.25) | 1.84 (1.35, 2.51) | 2.14 (1.54, 2.97) | 2.10 (1.50, 2.94) | |||||
Adjusted for age, age2, obesity, hypercholesterolemia, hypertension, diabetes, alcohol drinking, exercise, and amount of smoking for smokers only.
ASCVD, atherosclerotic cardiovascular diseases.
Hazard ratios* (95% confidence intervals) of white blood cell count for death from all causes, all cancers, and all atherosclerotic cardiovascular diseases in Korean women, 1993–2003
White blood cell count, × 109 cells/liter | |||||||||||
|---|---|---|---|---|---|---|---|---|---|---|---|
| <5.0 | 5.0–5.9 | 6.0–6.9 | 7.0–7.9 | 8.0–8.9 | ≥9.0 | ||||||
| All deaths (no. of cases) | |||||||||||
| All smokers (n = 5,340) | 1.0 | 0.89 (0.80, 1.01) | 0.98 (0.88, 1.09) | 0.98 (0.88, 1.10) | 1.03 (0.91, 1.16) | 1.26 (1.12, 1.41) | |||||
| Healthy smokers (n = 4,562) | 1.0 | 0.90 (0.80, 1.02) | 0.97 (0.86, 1.09) | 0.98 (0.87, 1.10) | 1.05 (0.92, 1.19) | 1.28 (1.13, 1.46) | |||||
| All nonsmokers (n = 16,896) | 1.0 | 0.89 (0.84, 0.94) | 0.93 (0.89, 0.98) | 0.97 (0.92, 1.03) | 1.00 (0.94, 1.06) | 1.20 (0.94, 1.06) | |||||
| Healthy nonsmokers (n = 14,072) | 1.0 | 0.91 (0.86, 0.97) | 0.97 (0.92, 1.02) | 1.00 (0.94, 1.06) | 1.02 (0.95, 1.10) | 1.21 (1.13, 1.30) | |||||
| All cancers (no. of cases) | |||||||||||
| All smokers (n = 1,139) | 1.0 | 0.85 (0.67, 1.07) | 0.89 (0.72, 1.11) | 0.73 (0.58, 0.92) | 0.80 (0.62, 1.03) | 0.99 (0.78, 1.25) | |||||
| Healthy smokers (n = 976) | 1.0 | 0.87 (0.68, 1.12) | 0.92 (0.73, 1.17) | 0.76 (0.59, 0.98) | 0.87 (0.66, 1.14) | 1.08 (0.83, 1.40) | |||||
| All nonsmokers (n = 4,976) | 1.0 | 0.83 (0.76, 0.91) | 0.81 (0.74, 0.88) | 0.91 (0.83, 1.00) | 0.79 (0.70, 0.89) | 0.95 (0.84, 1.07) | |||||
| Healthy nonsmokers (n = 4,252) | 1.0 | 0.88 (0.80, 1.00) | 0.87 (0.78, 0.95) | 0.96 (0.87, 1.07) | 0.83 (0.73, 0.95) | 0.98 (0.86, 1.12) | |||||
| All ASCVD† (no. of cases) | |||||||||||
| All smokers (n = 1,419) | 1.0 | 0.95 (0.76, 1.19) | 1.06 (0.86, 1.32) | 1.11 (0.89, 1.38) | 1.17 (0.92, 1.48) | 1.20 (0.95, 1.52) | |||||
| Healthy smokers (n = 1,217) | 1.0 | 0.95 (0.76, 1.19) | 1.02 (0.81, 1.28) | 1.11 (0.88, 1.41) | 1.14 (0.88, 1.47) | 1.21 (0.94, 1.56) | |||||
| All nonsmokers (n = 4,284) | 1.0 | 1.04 (0.93, 1.17) | 1.17 (1.05, 1.31) | 1.21 (1.08, 1.36) | 1.30 (1.15, 1.48) | 1.34 (1.17, 1.53) | |||||
| Healthy nonsmokers (n = 3,565) | 1.0 | 1.05 (0.92, 1.19) | 1.20 (1.06, 1.35) | 1.23 (1.09, 1.40) | 1.33 (1.16, 1.53) | 1.35 (1.17, 1.56) | |||||
Adjusted for age, age2, obesity, hypercholesterolemia, hypertension, diabetes, alcohol drinking, exercise, and amount of smoking for smokers only.
ASCVD, atherosclerotic cardiovascular diseases.
We next formally tested for effect modification of the risk of mortality associated with white blood cell count by gender and smoking, using white blood cell count as a continuous variable. For total mortality and for ASCVD, there were significant interactions of white blood cell count with gender, males having greater risk with increasing white blood cell count than females, and with smoking, nonsmokers having greater risk with increasing white blood cell count than smokers. For cancer mortality, these interactions were not significant (data not shown).
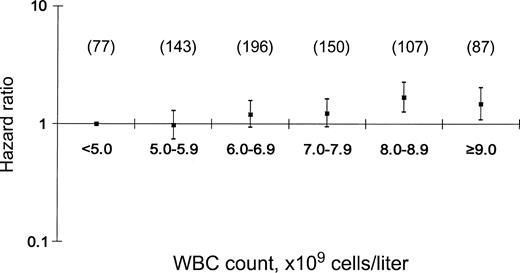
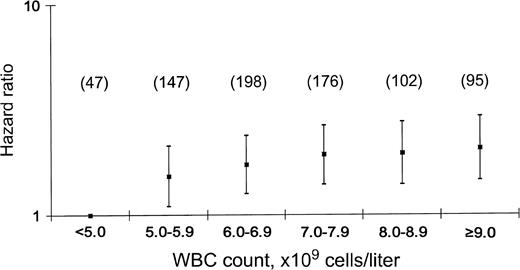
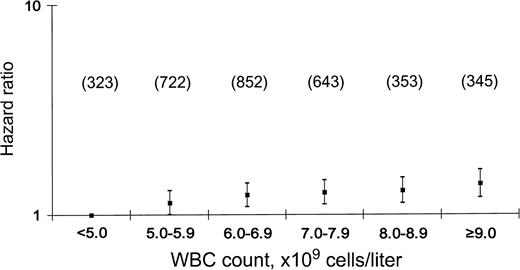
We further explored patterns of association of white blood cell count with ASCVD for the two major categories, coronary heart disease and stroke (figures 1, 2, 3, and 4). Figures 1 through 4 provide hazard ratios for death from coronary heart disease and stroke for men and women by cigarette smoking status. While the risk for death tends to rise with white blood cell count in both sexes, the gradient is much steeper in men. Among the men, the effect of white blood cell count was greater among nonsmokers than smokers.

Hazard ratios and 95% confidence intervals of white blood cell count for coronary heart disease in nonsmoking Korean men, 1993–2003. WBC, white blood cell. Values in parentheses denote numbers of cases.
Hazard ratios and 95% confidence intervals of white blood cell count for coronary heart disease in nonsmoking Korean women, 1993–2003. WBC, white blood cell. Values in parentheses denote numbers of cases.
Hazard ratios and 95% confidence intervals of white blood cell count for stroke in nonsmoking Korean men, 1993–2003. WBC, white blood cell. Values in parentheses denote numbers of cases.
Hazard ratios and 95% confidence intervals of white blood cell count for stroke in nonsmoking Korean women, 1993–2003. WBC, white blood cell. Values in parentheses denote numbers of cases.
DISCUSSION
In this large cohort study of Korean men and women, we documented that the white blood cell count predicts mortality from all causes and from ASCVD in men and women. The white blood cell count was not associated with risk for death from cancer. We found effect modification by smoking status and gender that varied across the major categories of death that we considered.
Perhaps because it is readily and accurately measured, white blood cell count has been examined by many studies as a predictor of all-cause mortality and of mortality from specific diseases. The white blood cell count has also been assessed as a predictor of outcome following disease onset, for example, after myocardial infarction (23, 24). The white blood cell count is plausibly a predictor of mortality risk and disease prognosis, because it broadly indicates the level of host response to stressors and provides an index of acute and chronic inflammatory processes (3, 25). The white blood cell count is highly variable, however, as it is responsive to diverse acute stimuli. Nonetheless, a single white blood cell count has been associated with a variety of long-term health risks (25).
For total mortality, the present study showed that the white blood cell count predicted all-cause mortality, an association previously observed in middle-aged populations (7, 10) and in elderly men (15). Although the association between white blood cell count and all-cause mortality remained after excluding participants with a clinical diagnosis of major chronic diseases on entry, underlying disease on enrollment may have affected the observed association.
Inflammation is currently considered to play a central role in carcinogenesis, a hypothesis that has been addressed by assessing white blood cell count as a predictor of risk for cancer. In a 1985 analysis of data from the Multiple Risk Factor Intervention Trial (MRFIT), Grimm et al. (7) found that the white blood cell count was significantly associated with risk for cancer death. In a study of Kaiser Permanente participants, Friedman and Fireman (18) found that the white blood cell count was associated with mortality from all cancers, cancers caused by smoking, and cancers not caused by smoking, but it was not associated with cancer mortality in nonsmokers. Most recently, Erlinger et al. (16) reported an association of white blood cell count with total cancer mortality using the follow-up of the participants in the Second National Health and Nutrition Examination Survey (NHANES II). By contrast, in a much larger cohort, we did not find evidence supporting an association of white blood cell count with cancer mortality in either smokers or nonsmokers.
For cardiovascular diseases, the white blood cell count has been assessed as both a predictor of risk for incident disease and a prognostic indicator following ischemic events and myocardial infarction (3). Ernst et al. (26) suggest that white blood cells may be involved in vascular injury through 1) pressure-dependent plugging of microvessels, 2) rheologic properties such as altered deformability and the formation of aggregates when provoked by a variety of stimuli, and 3) increased leukocyte adhesiveness and release of substances resulting in cytotoxic injury to endothelial cells. In a recent review, Madjid et al. (3) summarized the results of 15 studies of white blood cell count and risk for coronary heart disease in persons without disease on enrollment. In nearly all studies, the white blood cell count was associated with increased risk. A meta-analysis published in 1998 showed an overall risk ratio of 1.5 (95 percent confidence interval: 1.4, 1.6), comparing the highest with the lowest stratum of white blood cell count in participants in 19 prospective studies. The risks observed in the present study were in the range, that is, up to 2, covered in previous studies (6).
For stroke, the white blood cell count was associated with ischemic stroke in a previous prospective cohort study of atomic bomb survivors, but potential confounding by smoking was not explored (27). In a prospective study of US adults, Gillum et al. (10) found the white blood cell count to be weakly associated with stroke, but not after adjustment for smoking. The risk factors associated with stroke are different in younger and older subjects. In an 8-year follow-up study in southern Italy, the researchers suggested that the white blood cell count may have a relevant role at least in the elderly (28). However, they did not adjust smoking status. In the present study, the white blood cell count was associated with increased risk of stroke in male nonsmokers, but there was only a weak association in women.
Smoking increases the white blood cell count by an average of about 1,000 cells per ml, and the white blood cell count increases with the amount smoked (29). Thus, in smokers, the white blood cell count may be a useful biomarker of inflammation caused by smoking. We found, however, that the white blood cell count tended to be a stronger predictor in nonsmokers, in comparison with smokers (tables 3 and 4; figures 1, 2, 3, and 4). Our finding of strong associations among never smokers suggests that a higher white blood cell count is an independent risk factor for ASCVD, confirming findings from other studies on white blood cell count and ASCVD in nonsmokers (4, 5, 11, 15).
The potential limitations of our study arise primarily from the use of data collected as part of an insurance plan. The questionnaires provide self-reported smoking and alcohol use information without validation, and death certificate attribution of cause of death to cancer and ASCVD is subject to misclassification (7). While we are uncertain if these findings apply to cancer generally and to cardiovascular diseases, a pilot study on coding of lung cancer deaths showed high concordance between death certificate and clinical information (9). While the white blood cell count can be conceptualized as a mixed marker of exposure and response, the validity of using a single white blood cell count as a biomarker is still questionable. The coefficient of variation for the measurement of total white blood cell count in the blood is low, in the 1–2 percent range with established automated methods (30). In the present study, the correlation of white blood cell counts in 1993 and 1995 for participants having repeated measurements was 0.45. Additionally, our study cohort is not broadly representative of Koreans, as it is limited to employed persons and their families. This analysis was limited to a subgroup of the full cohort, but the selection process for having a white blood cell measurement should not have led to any bias.
Cigarette smoking produces substantial, chronic elevations in the white blood cell count (7) and is a cause of cardiovascular disease. Therefore, confounding by smoking is a concern. To address this issue, we performed analyses stratified by smoking status. The association between white blood cell count and death from cardiovascular disease strengthened when the analysis was restricted to men who had never smoked. The hazard ratio of all cardiovascular disease death, when comparing the highest versus the lowest quintile, was higher in healthy nonsmokers than in healthy smokers. In conclusion, our results indicate an association of white blood cell count with all-cause mortality and ASCVD mortality, independent of smoking.
This study was funded by the National Cancer Institute of the National Institutes of Health, US Department of Health and Human Services (1RO3 CA94771-02).
The authors thank the staff of the Korean National Health Insurance Corporation.
Conflict of interest: none declared.
References
Pocock SJ, Ashby D, Shaper AG, et al. Diurnal variations in serum biochemical and hematological measurements.
Hoffman M, Blum A, Baruch R, et al. Leukocytes and coronary heart disease.
Madjid M, Awan I, Willerson JT, et al. Leukocyte count and coronary heart disease: implications for risk assessment.
Lee CD, Folsom AR, Nieto FJ, et al. White blood cell count and incidence of coronary heart disease and ischemic stroke and mortality from cardiovascular disease in African-American and White men and women: Atherosclerosis Risk in Communities Study.
Brown DW, Giles WH, Croft JB. White blood cell count: an independent predictor of coronary heart disease mortality among a national cohort.
Danesh J, Collins R, Appleby P, et al. Association of fibrinogen, C-reactive protein, albumin, or leukocyte count with coronary heart disease: meta-analyses of prospective studies.
Grimm RH, Neaton JD, Ludwig W. Prognostic importance of the white blood cell count for coronary, cancer, and all-cause mortality.
Friedman GD, Klatsky AL, Siegelaub AB. The leukocyte count as a predictor of myocardial infarction.
Folsom AR, Rosamond WD, Shahar E, et al. Prospective study of markers of hemostatic function with risk of ischemic stroke. The Atherosclerosis Risk in Communities (ARIC) Study Investigators.
Gillum RF, Ingram DD, Makuc DM. White blood cell count and stroke incidence and death. The NHANES I Epidemiologic Follow-up Study.
Kannel WB, Anderson K, Wilson PWF. White blood cell count and cardiovascular disease. Insights from the Framingham Study.
Izaks GJ, Remarque EJ, Becker SV, et al. Lymphocyte count and mortality risk in older persons. The Leiden 85-Plus Study.
James AL, Knuiman MW, Divitini ML, et al. Associations between white blood cell count, lung function, respiratory illness and mortality: the Busselton Health Study.
de Labry LO, Campion EW, Glynn RJ, et al. White blood cell count as a predictor of mortality: results over 18 years from the Normative Aging Study.
Weijenberg MP, Feskens EJ, Kromhout D. White blood cell count and the risk of coronary heart disease and all-cause mortality in elderly men.
Erlinger TP, Muntner P, Helzlsouer KJ. WBC count and the risk of cancer mortality in a national sample of U.S. adults: results from the Second National Health and Nutrition Examination Survey Mortality Study.
Phillips AN, Neaton JD, Cook DG, et al. The leukocyte count and risk of lung cancer.
Friedman GD, Fireman BH. The leukocyte count and cancer mortality.
Gallup Korea. Cigarette smoking survey among adults. Seoul, South Korea: The Korea Gallup Report,
Jee SH, Ohrr H, Sull JW, et al. Fasting serum glucose level and cancer risk in Korean men and women.
Jee SH, Samet JM, Ohrr H, et al. Smoking and cancer risk in Korean men and women.
Hung MJ, Cherng WJ. Comparison of white blood cell counts in acute myocardial infarction patients with significant versus insignificant coronary artery disease.
Cannon CP, McCabe CH, Wilcox RG, et al. Association of white blood cell count with increased mortality in acute myocardial infarction and unstable angina pectoris. OPUS-TIMI 16 Investigators.
Crowell RJ, Samet JM. Invited commentary: why does the white blood cell count predict mortality?
Ernst E, Hammerschmidt DE, Bagge U, et al. Leukocytes and the risk of ischemic diseases.
Prentice RL, Szatrowski TP, Kato H, et al. Leukocyte counts and cerebrovascular disease.
Noto D, Barbagallo CM, Cavera G, et al. Leukocyte count, diabetes mellitus and age are strong predictors of stroke in a rural population in southern Italy: an 8-year follow-up.
US Department of Health and Human Services. The health effects of active smoking: a report of the Surgeon General. Washington, DC: US Government Printing Office,

