


Abstract
The authors modeled the possible consequences for US cataract incidence of increases in ultraviolet B radiation due to ozone depletion. Data on the dose-response relation between ocular exposure to ultraviolet B radiation and cortical cataract were derived from a population-based study (the Salisbury Eye Evaluation Project, Salisbury, Maryland) in which extensive data on cataract and ultraviolet radiation were collected in persons aged 65–84 years. Exposure estimates for the US population were derived using estimated ultraviolet radiation fluxes as a function of wavelength. US Census data were used to obtain the age, ethnicity, and sex distribution of the population. Predicted probabilities of cataract were derived from the age-, sex-, and ethnicity-specific ocular ultraviolet exposure data and were modeled under conditions of 5–20% ozone depletion. The analysis indicated that by 2050, the prevalence of cortical cataract will increase above expected levels by 1.3–6.9%. The authors estimate that with 5–20% ozone depletion, there will be 167,000–830,000 additional cases of cortical cataract by 2050. Because of the high prevalence of cataract in older persons, at a 2003 cost of $3,370 per cataract operation, this increase could represent an excess cost of $563 million to $2.8 billion.
Although progress is being made in reducing the degree of stratospheric ozone depletion, the human health effects of ozone depletion in terms of additional exposure to ultraviolet B (UVB) radiation are likely to be observed for a century or more. In part, this is because most of the potential health effects have long latency periods or require continuous exposure (on the order of 30–50 years) and because ozone-depleting substances continue to degrade the stratosphere. Indeed, in the latter case, there is reason to believe that this will remain true for several decades (or even longer if the troposphere warms substantially due to global climate change, as has been predicted) (1, 2).
Cataract is one health effect of particular concern in this scenario of increased UVB levels throughout the period 1980–2050. Numerous epidemiologic studies have found that exposure to ultraviolet radiation is an important risk factor for cortical (but not for nuclear or posterior subcapsular) cataract (3–6). Furthermore, unlike skin cancer, which shows a 10- to 100-fold greater incidence in persons with light skin, cortical cataract affects African Americans at a higher rate than Caucasians and is relatively common worldwide (7–11).
Although some risk estimates have been made with regard to the likely impact of ozone depletion on cataract incidence (12–14), these studies developed their initial dose-response relations with cross-sectional survey data that neither discriminated between forms of cataract nor had solid data on ocular UVB exposure. We had a unique opportunity to use risk estimates based on a population-based study of cataract that specifically evaluated the relation between average annual ocular exposure and the various forms of cataract (15). In the Salisbury Eye Evaluation (SEE) Project, exposure to ultraviolet radiation was assessed using detailed measurements of ambient radiation and the likely lifetime ocular dose based on a highly detailed questionnaire (16–18). Moreover, we had an opportunity to meld these data with a model of ultraviolet radiation flux across the United States to create predictors of changes in cataract risk. The purpose of these analyses was to estimate the effect on the prevalence of cortical opacity in the United States under various scenarios of increasing ambient UVB radiation resulting from ozone depletion.
MATERIALS AND METHODS
Satellite-based model of ultraviolet radiation flux across the United States
Exposure figures for US populations in this analysis were based on estimated ultraviolet radiation fluxes as a function of wavelength that were produced by a computer model (hereafter referred to as the ultraviolet model) developed by Serafino and Frederick (19). The ultraviolet model uses global-scale ozone measurements obtained by the solar backscatter ultraviolet spectral radiometer carried on the Nimbus-7 satellite.
The ultraviolet model estimates ultraviolet fluxes on the basis of one of two atmospheric states: clear skies or cloudy skies. In the case of clear skies, the lower boundary of the model (the ground) is considered to be a surface of specified albedo, and the algorithm produces estimates of ultraviolet radiation at the ground as a function of wavelength, solar zenith angle (local time), and ozone amount. In the case of cloudy skies, the clear-sky case is merged with a cloudy-sky model that divides the atmosphere into layers of known reflectivity and transmission. Clouds occupy the uppermost layers, while the bottom layer is the ground with a transmission of zero.
The data used as the basis for the ultraviolet estimates are total column ozone and vertical ozone profiles derived from the solar backscatter ultraviolet measurements averaged over 1-month time intervals and over all longitudes in 10°-wide latitude bands. These month-by-10° means are associated with the middle of each month and latitude “bin.” Interpolation in latitude and time then provides the amount of ozone for a specific location and time of year. Information on the extraterrestrial solar irradiance, ozone absorption cross-sections, and the Rayleigh scattering cross-section (20) is then entered into the algorithm, along with the ozone amount for the specific location, time, and day of the year; ground-level instantaneous flux by waveband is then generated. Alternatively, output may be generated as mean fluxes over the daylight portion of a 24-hour period or as cumulative fluxes over specified time periods, such as an hour, a month, or a year.
The model as described by Serafino and Frederick (19) has default fractional cloud cover as a function of latitude and month (21). In this report, those defaults were replaced with weather data acquired from a weather station in each location. Details on how these data were gathered and used are presented in an earlier report (22).
The ultraviolet model uses a quadrature process to estimate daily average radiation per second and then corrects this for ozone levels and cloud cover. This corrected value is multiplied by the number of daylight seconds in the month to estimate daily radiation for each of 23 1-nm radiation bands. These values are then interpolated to 1-nm intervals over the bandwidth 290–400 nm. These radiation levels are then multiplied by the action spectrum for the instrument or biologic effect of concern to obtain monthly total effective radiation and summed across the months to obtain the yearly total radiation. The model uses a standard two-stream code to estimate the effects of clouds and a data set based on the use of a total ozone mapping spectrophotometer (23) to estimate ozone levels.
Initial validation of the ultraviolet model was conducted with Robertson-Berger and Brewer spectroradiometer data for Tallahassee, Florida. This validation accounted for the absolute error of the Robertson-Berger meter. Additional validations were done for El Paso, Texas, San Francisco, California, and Minneapolis, Minnesota (24), which showed increasing disparity between measurement and model. These validations were not corrected for the known zenith angle response errors of the Robertson-Berger meter. When these response errors (of the Robertson-Berger meter) were accounted for, the differences between model and measurement were found to be nonsignificant.
For this study, we used the meter data from a 1997 study by Duncan et al. (16) and the model results by hour and month to validate the model. The validation process indicated the presence of an absolute calibration error (model:meter ratio of 110.35–75.94 percent), but since all data were expressed relative to the Easton meter and the error was multiplicative in nature, this absolute calibration error will have canceled out. The concern then became whether there was a cosine response difference between the model and the meter. Available data on the cosine response function for the Solar Light 501 (Solar Light Company, Inc., Glenside, Pennsylvania) suggested that the problem should be insignificant. We verified this by plotting the monthly cumulative meter data by hour and the same data for the model simulation against the zenith angle estimates from the model simulation, corrected for longitude and solar noon. There was no discernible zenith angle pattern in the data. The same data were plotted against the cosine of the zenith angle and two quadratic curves fitted to the respective data sets. The curves lay nearly on top of each other and had R2 values of approximately 0.98, verifying that the meter had very little cosine response error. It also validated the assumption of multiplicative calibration error; otherwise one would have expected a systematic error pattern to be visible in the plots.
UVB-cataract dose-response relation
To investigate the dose-response relation between cataract and UVB exposure, we used data from the SEE Project, a population-based study of 2,520 residents of Salisbury, Maryland, aged 65–84 years (15). The selection of the sample, which included both Caucasians and African Americans, the recruitment (conducted in 1993–1995), and the characteristics of the participants relative to persons who refused participation have been described in detail in previous publications (15, 25).
We used an empirical model to estimate ocular exposure for this population in the ultraviolet A and UVB wavelength bands that has been extensively described in previous publications (16–18, 26). We have used this approach to determine the association of cortical opacity with UVB exposure in males and females and in Caucasians and African Americans within our population-based sample of 65- to 84-year-olds (3).
The model produces estimated annual ultraviolet exposure in Maryland sun-years or, for UVB, the equivalent of 75.9 J/cm2 effective integrated energy density (erythemal spectral weighting). A Maryland sun-year is a measure of the ultraviolet energy that falls on a horizontal surface in Maryland in 1 year, erythemically weighted. Exposure for each person is summed for each year of life since age 30 years, and cumulative lifetime ocular exposure is derived. Persons reporting spending less than 1 hour per day outside in job-related or leisure activities are assigned an exposure of zero. (Although this group probably has a very low finite amount of exposure, our model categorizes it as no exposure.)
Ambient exposure levels were obtained from 2 years of measurements made on Maryland's Eastern Shore using a UVB pyranometer (16). The single geographic correction factor multiplier for job/leisure time spent outside Maryland was developed as the result of a semi-empirical model developed by the National Aeronautics and Space Administration and is described in detail in an earlier publication (16). The model corrects for cloud cover in various locations around the globe. Ocular ambient exposure ratios were determined through a series of measurements made in residents of Salisbury as they carried out their usual daily activities; the ratios were allowed to vary by season. Diminution factors for hat use were also based on measurements made in the Salisbury population (16). Diminution factors for use of eyeglasses were based on previous experiments on UVB attenuation for plastic and glass sunglasses and eyeglasses (26). Information on the fraction of time spent outdoors and the use of glasses, sunglasses, and hats was derived from a job and leisure history questionnaire administered to participants. This questionnaire asked about job history since age 30 years, amount of time spent outside on the job and during leisure time, geographic location of job/leisure activity, and use of glasses and hats while outside. In our pilot studies, we were unable to obtain reliable data from this age group on time spent outside and job history prior to age 30, so our job history questionnaire began at age 30 years (16). Based on data obtained from optometrists in Salisbury, plastic eyeglass lenses were introduced there in 1970, and currently approximately 85 percent of the sample who use any eyewear use plastic lenses; the remaining 15 percent use glass lenses. Therefore, we presumed that prior to 1970, all spectacles in the area had glass lenses, and that between 1970 and the present, the use of plastic lenses increased in yearly linear increments.
Cataract assessment was based on grading of lens photographs (25). Photographs for cortical opacity were taken with a Neitz retro-illumination camera (Neitz Instrument Company, Tokyo, Japan), focused just posterior to the pupillary margin. The focus was then placed at the posterior subcapsular region, and posterior subcapsular photographs were taken. All photographs were processed at the Wilmer Eye Institute (Baltimore, Maryland) using standard processing techniques. Photographs for each eye were graded independently of knowledge of the status of the fellow eye.
Photographs were graded for type and severity of opacity using the Wilmer grading scheme (27, 28). Posterior subcapsular opacities were graded as present or absent, and, if opacities were present, the maximum height and width were recorded. Of particular interest to this project, cortical opacification was estimated by dividing the pupillary area into 16 sectors and estimating the amount obscured by opacity in 16ths (28). None of the grades involved a visual acuity criterion. All grading was carried out independently by two trained photograph graders, with adjudication by a third grader if the cortical grades differed by more than 1/16th or there was any disagreement about the presence or absence of posterior subcapsular opacities.
The prevalence rates of cortical opacity are presented by ethnic group, as we have shown that pronounced differences occur by ethnicity (25). Cortical opacity was defined as the presence of grade 4/16 or higher in the photographs of at least one eye. If a participant had undergone unilateral surgery in one eye or had ungradable photographs for one eye, the companion eye was used to determine the opacity grade, a procedure consistent with other studies (4, 29).
Data on exposure were converted from actual measurements in Maryland sun-years to their equivalent doses of ultraviolet radiation using outputs from the ultraviolet model, and the resulting ultraviolet radiation doses were related to the prevalence of cataract. An extensive effort to validate the ultraviolet model using ground-based measurements of ultraviolet radiation by Robertson-Berger meters found the ultraviolet model to slightly overpredict incident energy as the sun approaches the horizon—possibly because it fails to account for attenuation due to aerosols (30). Since energy levels are low for large zenith angles, especially in the part of the spectrum strongly affected by changes in ozone, the error introduced into the exposure estimates by this problem was small. For example, for El Paso, the relative error for the cumulative annual Robertson-Berger measure was 0.4 percent.
Ultraviolet exposure assumptions extending data to US populations
Our data provide specific average annual and cumulative exposures for each member of the study population, which represents the age and ethnicity groups of our sample on Maryland's Eastern Shore. To our knowledge, there are no data on ocular ultraviolet exposure from other ethnic groups in the United States. The “other” ethnic group was heterogeneous and included Asian Americans, Latinos, Pacific Islanders, etc. We assumed that rates of cortical cataract for the other ethnic groups in the United States are intermediate between those of Caucasians and African Americans. The rates of cortical opacity (using a different grading scheme) are higher in Latinos (31) than are reported for Caucasians, as we assumed. However, no data on ultraviolet exposure are available for this ethnic population (31). We also assumed that the relation of UVB to cortical cataract is the same for all ethnic groups. This assumption is reasonable, as we have shown similar risks of cataract with UVB exposure for Caucasians and African Americans (3). We then used the data to create a model for the predicted probability of having cortical opacity by ethnicity and sex, including interactions of ethnicity and sex with age, to determine the probability for persons aged 85 years or older.
In order to predict changes in cataract prevalence for the United States under varying levels of ozone depletion, we had to assume that populations across the United States had ocular exposure behaviors (hat wearing, use of glasses, percentage of time spent outside, etc.) similar to those of our sample in Maryland. Moreover, for our predictions relative to the year 2050, we also assumed that these behaviors would not change over time. To our knowledge, there are no other data in the United States with this level of detail that could be used to validate our assumptions.
Since the basis for the dose-response function is cumulative exposure over the year and there is little empirical basis on which to estimate the spatial pattern of ozone depletion at middle or low latitudes, where estimates of current ozone depletion are low, we chose to assume that ozone depletion would occur at the same percentage rate from baseline levels for all locations for which estimates were made. This assumption is consistent with a well-mixed increase in stratospheric halogens and has the advantage of clearly illustrating the nonlinear relation between ozone levels and annual ultraviolet exposure levels. Furthermore, we assumed that depletion was constant for the population, starting at the present, so that by the year 2050, all members of the population had been exposed to ozone depletion since the age of 30 or younger.
Data analyses
US Census Bureau estimates (middle series) of the population structure by age, ethnic group, and sex for 2001 and 2050 (32) were used to derive the base populations for calculation of the numbers of cataract cases under different ozone depletion scenarios. The population-based sample in the SEE Project was used to derive the model for risk factors for cortical opacity, using age, sex, ethnicity, and exposure to various wavelengths of ultraviolet radiation as predictors. (There were no significant interactions among these variables.)
Exposure to various wavelengths of ultraviolet radiation is highly correlated, so we could not determine the contribution of each independent of the other. However, previous animal data and our own research in another population suggest that the cataractogenic wavelength is UVB (4, 33). Moreover, ambient UVB is most affected by ozone depletion; therefore, all of the calculations were predicated on exposure to UVB, represented by the 305-nm band, as the causative wavelength. This model was the basis for the calculations of predicted probability of cortical cataract by age, sex, and ethnicity, under different assumptions regarding ambient UVB.
The predicted probabilities were calculated for each ethnicity and sex group. We also show the changes in predicted probabilities, by sex and ethnic group, that would occur if we assumed that the population resided in Texas (high ambient exposure relative to Maryland; geographic factor = 1.64) or New Hampshire (low ambient exposure relative to Maryland; geographic factor = 0.73). Overall, the population-weighted mean geographic factor for the US population aged 65 years or more is 1.11, suggesting slightly higher ambient UVB exposure than was seen in our population in Maryland.
RESULTS
The age, ethnicity, and sex distributions of the estimated population of the United States in 2050 suggested that, in the age groups of interest, Caucasians and African Americans would continue to comprise the majority of the population (figure 1). These data provided assurances that our imputation for the other ethnic group would have a small effect on the overall estimates.
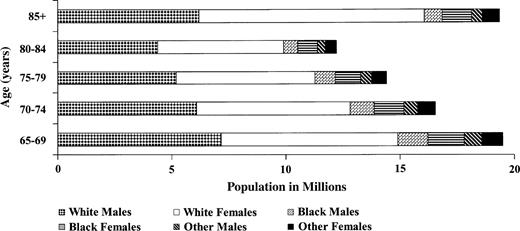
Projections of the US population in the year 2050, by age, sex, and ethnicity. Source: Bureau of the Census, US Department of Commerce (36).
The predictors of cortical cataract are shown in table 1. There was an increase associated with age, African-American ethnicity, and female sex. Independent of these risk factors, average annual ocular exposure to ultraviolet radiation was also a significant risk factor. Each wavelength was modeled separately by age, ethnicity, and sex for the association with cortical opacity, although the correlation between wavelengths was high. Results for all wavelength bands were statistically significant, but the correlation did not permit any inferences as to precisely which band was more important or any potential interaction among them. As described above, other data informed the choice of the UVB component. Nevertheless, it is interesting that the estimates of association were so similar; approximately a 0.01 increase in a Maryland sun-year was associated with a 9–10 percent increase in the odds of cortical opacity.
Risk factors for cortical cataract* among persons aged 65–84 years in the Salisbury Eye Evaluation Project, Salisbury, Maryland
Factor | Odds ratio | Confidence interval | p value |
|---|---|---|---|
| Age group (years) | |||
| 65–69 | 1.00 | ||
| 70–74 | 2.07 | 1.44, 2.97 | <0.0001 |
| 75–79 | 2.69 | 1.83, 3.97 | <0.0001 |
| 80–84 | 4.08 | 2.66, 6.26 | <0.0001 |
| African-American ethnicity | 4.83 | 3.70, 6.30 | <0.0001 |
| Female sex | 1.68 | 1.22, 2.30 | <0.001 |
| Average yearly exposure to ultraviolet radiation† | |||
| Ultraviolet meter | 1.10 | 1.01, 1.19 | 0.029 |
| Wavelength (nm)‡ | |||
| 305 | 1.09 | 1.01, 1.19 | 0.031 |
| 320 | 1.10 | 1.01, 1.20 | 0.028 |
| 340 | 1.10 | 1.01, 1.21 | 0.034 |
| 380 | 1.12 | 1.01, 1.23 | 0.037 |
Defined as cortical opacity greater than 3/16 in at least one eye.
Separate models for overall average annual exposure and each wavelength.
Per 0.01 increase in Maryland sun-years, specific for each wavelength (see text for details).
The predicted probabilities of cortical cataract for each sex group under assumptions of residence in Maryland (average ground exposure), Texas (high ground exposure), or New Hampshire (low ground exposure) showed minor differences (figure 2). In fact, only African-American males were affected by the assumption of primary residence because of their relatively higher level of average annual exposure, a result of more time spent outdoors with less protection.
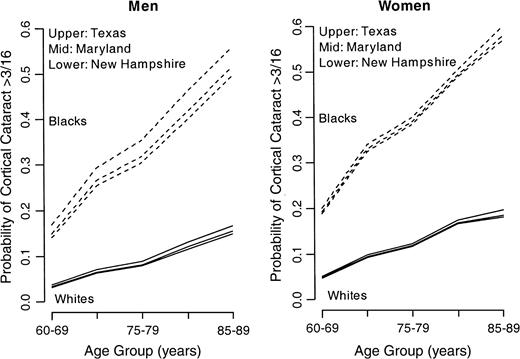
Predicted probability of cortical cataract by age, within ethnicity and sex groups. The lines demonstrate assumed probabilities for residence in Texas, Maryland, and New Hampshire. Source: Bureau of the Census, US Department of Commerce (32).
Ozone depletion results in an estimated change in ambient ultraviolet exposure, and we modeled these changes for 5–20 percent depletion of ozone with the assumption that people would have lived from age 30 years onward under these continuous levels of ozone depletion. These increases were factored into the average annual ocular exposure to the 305-nm wavelength band for the US population by 2050. Figure 3 shows the variability in average annual ocular ultraviolet exposure (in Maryland sun-years) under various scenarios of ozone depletion. There is considerable variation and an increase in exposure with ozone depletion.
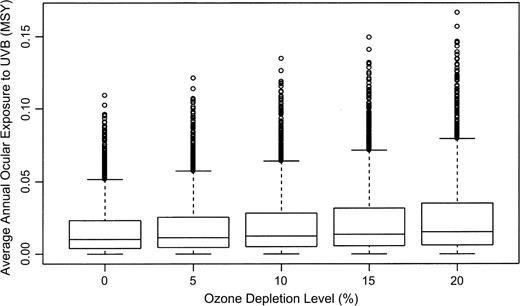
Average annual ocular exposure to ultraviolet B (UVB) radiation under variable levels of ozone depletion. The box plots show the median (line) and interquartile range (edges); whiskers (T-shaped bars) are drawn to the nearest value beyond 1.5 × the interquartile range. Circles represent outliers. MSY, Maryland sun-years. (A Maryland sun-year is a measure of the ultraviolet energy that falls on a horizontal surface in Maryland in 1 year, erythemically weighted.)
The average predicted probability of developing cortical cataract changed under different assumptions of ozone depletion (and increasing levels of UVB at the 305-nm wavelength) (table 2). Caucasians had an estimated absolute increase in the probability of cortical cataract of ½–1 percent across the age groups as ozone depletion increased from 0 percent to 20 percent. There was greater variability in the African-American population—from ½ percent to 4 percent—as depletion increased. The predicted probability did not increase as greatly for females as for males in either ethnic group, since their ocular exposure was lower than that of males.
Predicted probability of cortical cataract,* by age group, ethnicity, and sex, under different levels of ozone depletion, using the average annual ocular dose of ultraviolet B radiation for a cohort of persons living most of their lives in Maryland, Salisbury Eye Evaluation Project, Salisbury, Maryland
Age group (years) | Ozone depletion (%) | Males | Females | ||||||||
|---|---|---|---|---|---|---|---|---|---|---|---|
| Caucasians | African Americans | Others† | Caucasians | African Americans | Others† | ||||||
| 65–69 | 0 | 0.0328 | 0.1480 | 0.0904 | 0.0478 | 0.1915 | 0.1196 | ||||
| 5 | 0.0338 | 0.1524 | 0.0931 | 0.0484 | 0.1930 | 0.1207 | |||||
| 10 | 0.0349 | 0.1575 | 0.0962 | 0.0491 | 0.1948 | 0.1219 | |||||
| 15 | 0.0362 | 0.1635 | 0.0998 | 0.0499 | 0.1969 | 0.1234 | |||||
| 20 | 0.0377 | 0.1704 | 0.1041 | 0.0508 | 0.1992 | 0.1250 | |||||
| 70–74 | 0 | 0.0642 | 0.2635 | 0.1639 | 0.0931 | 0.3282 | 0.2107 | ||||
| 5 | 0.0657 | 0.2700 | 0.1679 | 0.0941 | 0.3304 | 0.2123 | |||||
| 10 | 0.0675 | 0.2775 | 0.1725 | 0.0952 | 0.3329 | 0.2141 | |||||
| 15 | 0.0696 | 0.2860 | 0.1778 | 0.0981 | 0.3356 | 0.2161 | |||||
| 20 | 0.0721 | 0.2957 | 0.1839 | 0.0981 | 0.3387 | 0.2184 | |||||
| 75–79 | 0 | 0.0800 | 0.3170 | 0.1985 | 0.1165 | 0.3868 | 0.2517 | ||||
| 5 | 0.0816 | 0.3241 | 0.2029 | 0.1176 | 0.3889 | 0.2123 | |||||
| 10 | 0.0835 | 0.3322 | 0.2079 | 0.1188 | 0.3913 | 0.2141 | |||||
| 15 | 0.0857 | 0.3414 | 0.2136 | 0.1202 | 0.3939 | 0.2161 | |||||
| 20 | 0.0883 | 0.3519 | 0.2928 | 0.1218 | 0.3969 | 0.2184 | |||||
| 80–84 | 0 | 0.1183 | 0.4155 | 0.2669 | 0.1669 | 0.4901 | 0.3285 | ||||
| 5 | 0.1208 | 0.4236 | 0.2722 | 0.1684 | 0.4924 | 0.3304 | |||||
| 10 | 0.1238 | 0.4327 | 0.2783 | 0.1700 | 0.4950 | 0.3325 | |||||
| 15 | 0.1272 | 0.4430 | 0.2851 | 0.1719 | 0.4978 | 0.3348 | |||||
| 20 | 0.1312 | 0.4544 | 0.2928 | 0.1740 | 0.5010 | 0.3375 | |||||
| 85–98‡ | 0 | 0.1521 | 0.5124 | 0.3322 | 0.1821 | 0.5755 | 0.3778 | ||||
| 5 | 0.1550 | 0.5206 | 0.3378 | 0.1846 | 0.5792 | 0.3819 | |||||
| 10 | 0.1584 | 0.5299 | 0.3442 | 0.1875 | 0.5834 | 0.3855 | |||||
| 15 | 0.1624 | 0.5404 | 0.3514 | 0.1908 | 0.5880 | 0.3894 | |||||
| 20 | 0.1669 | 0.5521 | 0.3595 | 0.1946 | 0.5929 | 0.3938 | |||||
Defined as cortical opacity greater than 3/16 in at least one eye.
Assumed to be intermediate between Caucasians' and African Americans' values.
Data on cortical cataract and ultraviolet B exposure were not available for modeling. Results were predicted with a linear regression model using the data from the previous age categories.
The predicted number of persons affected by cortical opacity in 2050 increased as ozone was depleted (table 3). Our model suggests that without ozone depletion, there will be approximately 12 million cases of cortical cataract in the United States by 2050. Under a scenario of 5 percent depletion of ozone, this number increases to 12.23 million, while with 20 percent depletion of ozone, the number approaches 13 million. At a cost of $3,370 per cataract operation (34, 35), this represents an additional cost of $563 million to $2.8 billion.
Numbers of cases of cortical cataract* predicted for 2050 in the US population under different levels of ozone depletion
Ozone depletion (%) | No. of cases predicted | Additional no. of cases | Percentage increase |
|---|---|---|---|
| 0 (base) | 12,057,900 | ||
| 5 | 12,225,100 | 167,200 | 1.3 |
| 10 | 12,416,400 | 358,500 | 3.0 |
| 15 | 12,636,700 | 578,800 | 4.8 |
| 20 | 12,888,400 | 830,500 | 6.9 |
Ozone depletion (%) | No. of cases predicted | Additional no. of cases | Percentage increase |
|---|---|---|---|
| 0 (base) | 12,057,900 | ||
| 5 | 12,225,100 | 167,200 | 1.3 |
| 10 | 12,416,400 | 358,500 | 3.0 |
| 15 | 12,636,700 | 578,800 | 4.8 |
| 20 | 12,888,400 | 830,500 | 6.9 |
Defined as cortical opacity greater than 3/16 in at least one eye.
DISCUSSION
Because of stratospheric ozone depletion, ambient levels of UVB radiation have been increasing and may persist at elevated levels in the future. We evaluated the possible consequences of such increases in UVB for the future prevalence of cortical cataract in US populations (assuming that other factors would remain the same). We used a dose-response relation between cortical cataract and UVB and derived the prevalence of cortical cataract across the United States in the absence of ozone depletion (since our original exposures occurred before substantial ozone depletion had occurred).
The estimates of increased prevalences of cortical cataract—between 1.3 percent and 6.9 percent—may appear low, partly because of the multifactorial nature of cataractogenesis. However, the frequency of cortical cataract in the population is high, so the absolute increase in the number of cases is large; we estimate that the effect will be 167,000–830,000 additional cases of cataract. Our estimation is more specific than estimates based on increases in cataract surgery, which are presumably associated with UVB because of changes in latitude (13). Cataract surgery is a relatively poor surrogate for cortical cataract, since surgery depends on such factors as perceived need and access to health care. Other investigators have proposed an increased risk of cataract, but there is no model of the link between a measure of cortical cataract and a measure of ocular ultraviolet exposure (14).
Note that there are uncertainties in our estimates; they assume that the behaviors influencing sun exposure will be similar across the United States to those observed in our Maryland population and will remain the same in the future. To our knowledge, there are no other population-based data with such detail, and certainly no national data, from which to estimate variability in exposure behaviors. Our estimate of cataract is conservative, since it was based on a population aged 65 years or more, an age when the majority of significant cataracts develop. Although there are opacities in younger persons, most are observed in older age groups (11). Finally, our exposures were calculated on the basis of data from age 30 onwards, but considerable exposure to ultraviolet radiation occurs in childhood, and this could not be calculated. Our model assumes that persons with higher exposure at ages 30 and older are also those most likely to have been outdoors as children as well, or at least no less likely than persons with lower exposure. To the extent that this is not the case, the predicted probabilities may be overestimates.
We used an approximation of the rate of cataract in other ethnic groups, since there are no data on cortical cataract available for them with gradings that can be used for modeling. We assumed the same relation of cortical cataract with UVB exposure, since this was true for the Caucasians and African Americans in the SEE Project; only the predicted probabilities of cortical cataract were different, because of differences in exposure.
While there is clearly geographic variability in ambient UVB, the contribution to exposure from serious ozone depletion crosses all states and is the greater risk factor. These estimates were based on the assumption of stable changes in ozone depletion—that is, that people will live for 40 or more years under the same amount of ultraviolet radiation—while in actuality ultraviolet radiation is likely to fluctuate (although the degree is uncertain). Despite their limitations, we believe that our estimates represent the most reasonable model to date of an ocular health effect and the consequences of ozone depletion.
Ozone-depleting substances continue to degrade the stratosphere. This model demonstrates the magnitude of the increase in cortical opacity that might result and the importance of vigilance in adopting sun avoidance behaviors.
This work was supported by grant EY13419 from the National Eye Institute.
Conflict of interest: none declared.
References
Madronich S, McKenzie RL, Bjorn LO, et al. Changes in biologically active ultraviolet radiation reaching the Earth's surface.
Houghton JT, Meiro Filho LG, Callander BA, et al, eds. Climate change 1995: the science of climate change. Summary for policy makers. Geneva, Switzerland: World Meteorological Organization/United Nations Environment Programme,
West SK, Duncan DD, Munoz B, et al. Sunlight exposure and risk of lens opacities in a population-based study: The Salisbury Eye Evaluation Project.
Taylor HR, West SK, Rosenthal F, et al. Effect of ultraviolet radiation on cataract formation.
Cruickshanks KJ, Klein BEK, Klein R. Ultraviolet light exposure and lens opacities: The Beaver Dam Eye Study.
Rosmini F, Stazi MA, Milton RC, et al. A dose-response effect between a sunlight index and age-related cataracts. Italian-American Cataract Study Group.
Congdon N, West SK, Buhrmann R, et al. Prevalence of the different types of age-related cataract in an African population.
Sasaki K, Sasaki H, Kojima M, et al. Epidemiological studies on UV-related cataract in climatically different countries.
Sasaki H, Shui YB, Kojima M, et al. Characteristics of cataracts in the Chinese Singaporean.
Sasaki H, Jonasson F, Kojima M, et al. The Reykjavik Eye Study—prevalence of lens opacification with reference to identical Japanese studies.
Congdon N, Vingerling JR, Klein BE, et al. Eye Diseases Research Group. Prevalence of cataract and pseudoaphakia/aphakia among adults in the United States.
Hoffman JS. Cataracts and other eye disorders. (Chapter 10). In: Assessing the risks of trace gases that can modify the stratosphere. Vol 2. Washington, DC: Office of Air and Radiation, Environmental Protection Agency,
West SK, Munoz B, Rubin GS, et al. Function and visual impairment in a population-based study of older adults. The SEE Project. Salisbury Eye Evaluation.
Duncan DD, Munoz B, Bandeen-Roche K, et al. Assessment of ocular exposure to ultraviolet B for population studies. Salisbury Eye Evaluation Project Team.
Duncan DD, Munoz B, Bandeen-Roche K, et al. Visible and ultraviolet B ocular-ambient exposure ratios for a general population. Salisbury Eye Evaluation Project Team.
Duncan DD, Schneider W, West KJ, et al. The development of personal dosimeters for use in the visible and ultraviolet wavelengths regions. The Salisbury Eye Evaluation Team.
Serafino GN, Frederick JE. Global modeling of the ultraviolet solar flux incident on the biosphere. In: Hoffman J, ed. Assessing the risks of trace gases that can modify the stratosphere. Vol 7. Washington, DC: Environmental Protection Agency,
World Meteorological Organization and US National Aeronautics and Space Administration. Atmospheric ozone. Geneva, Switzerland: World Meteorological Organization,
Hughes NA. Global cloud cover climatologies: a historical review.
Pitcher HM, Longstreth J. Melanoma mortality and exposure to ultraviolet radiation: an empirical relationship.
Bhartia PK, Kerr JB. Satellite estimation of spectral UVB irradiance using TOMS derived total ozone and UV reflectivity.
Scotto J, Cotton G, Urbach F, et al. Biologically effective ultraviolet radiation: surface measurements in the United States, 1974 to 1985.
West SK, Munoz B, Schein OD, et al. Racial differences in lens opacities: The Salisbury Eye Evaluation (SEE) Project.
Rosenthal F, West SK, Munoz B, et al. Ocular and facial skin exposure to UV radiation in sunlight: a personal exposure model with application to a worker population.
West SK, Rosenthal F, Newland HS, et al. Use of photographic techniques to grade nuclear cataracts.
West SK, Munoz B, Wang F, et al. Measuring progression of lens opacities for longitudinal studies.
Leske MC, Connell AM, Wu SY, et al. Prevalence of lens opacities in the Barbados Eye Study.
Green AES, Sawada T, Shettle EP. The middle ultraviolet reaching the ground.
Varma R, Torres M, Los Angeles Eye Study Group. Prevalence of lens opacities in Latinos: The Los Angeles Latino Eye Study.
Population Division, Bureau of the Census, US Department of Commerce. National population projections. II. Detailed files. Total population by age, sex, race, Hispanic origin, and nativity. (Middle series data, 2041–2050). Washington, DC: Bureau of the Census,
Pitts DG, Cullen AP, Hacker PD. Ocular effects of ultraviolet radiation from 295 to 365 nm.
Centers for Medicare and Medicaid Services, US Department of Health and Human Services. Table 70. Hospital outpatient procedures, covered charges, and program payments for Medicare beneficiaries, by the leading principal HCPHS surgical procedures: calendar year 1999. In: Health care financing review: Medicare and Medicaid statistical supplement, 2001. Baltimore, MD: Centers for Medicare and Medicaid Services,
Centers for Medicare and Medicaid Services, US Department of Health and Human Services. Leading Medicare physician and supplier BETOS procedures, based on allowed charges: calendar years 1999 and 2000. In: 2002 data compendium. Baltimore, MD: Centers for Medicare and Medicaid Services,
Population Division, Bureau of the Census, US Department of Commerce. Population projections of the United States by age, sex, race, Hispanic origin, and nativity: 1999 to 2100. Washington, DC: Bureau of the Census,

