


Abstract
The authors investigated the association of body mass index (BMI) with suicide in a record linkage study based on the Swedish Military Service Conscription Register, the Population and Housing Censuses, and the Cause of Death Register. The cohort studied consisted of 1,299,177 Swedish men who were conscripted in 1968–1999, had their BMI measured at age 18–19 years, and were followed up for as long as 31 years. A strong inverse association was found between BMI and suicide. For each 5-kg/m2 increase in BMI, the risk of suicide decreased by 15% (95% confidence interval: 9, 21). The association was similar when subjects with mental disorder at baseline were excluded from the analysis. BMI-suicide associations were similar in relation to suicide deaths occurring in the first 5 years of follow-up (hazard ratio for each 5-kg/m2 increase in BMI = 0.84, 95% confidence interval: 0.73, 0.96) compared with associations ≥10 years after baseline (hazard ratio = 0.87, 95% confidence interval: 0.79, 0.96), indicating that weight loss as a consequence of mental illness does not explain the BMI-suicide association and that factors influencing BMI may be causally implicated in the etiology of mental disorders leading to suicide.
Levels of overweight and obesity have increased worldwide over the last decades. The consequences of these trends on all aspects of population health require clarification. The association of overweight and obesity with future mental health, in particular, is unclear. Several studies have examined the relation between overweight and obesity and depression and have found conflicting results (1–4). Several possibilities might explain these conflicting results.
First, studies showing an association in either a positive or inverse direction might be influenced by reverse causality. Most studies in this area have been cross-sectional, and, since depression is associated with changes in appetite (both an increase and a decrease), it is possible that these associations are due to reverse causation, that is, the depressive illness resulting in changed appetite and hence changes in body mass index (BMI) rather than BMI being causally related to depression. Second, a recent review concluded that, among women, obesity is positively related to major depression and that this relation is greater among women from the highest socioeconomic groups, while, among men, there is an inverse association between obesity and depression that is unaffected by socioeconomic position (4). Thus, if there really is a sex difference in the relation, conflicting results may reflect the relative proportions of each sex in a particular study. Finally, studies have used different, and often nonclinical, outcome measurements, which may contribute to conflicting results. A further limitation of research in this area is that most studies have reported associations with obesity only and have not examined the association across the distribution of BMI (2, 4, 5). A recent review emphasized the need for further large prospective studies with clinical endpoints (4).
The suggestion of positive associations between obesity and depression in women only suggests that, at least in part, any positive association between obesity and depression is related to cultural pressures and the stigma associated with being obese in Western societies, among women. In contrast, a growing body of evidence suggests that obesity may be inversely related to depression through biologic pathways. It has recently been reported that people with insulin resistance, a condition associated with raised BMI (6), may have a reduced risk of suicidal behavior (7). This report is in keeping with the finding from a cross-sectional study of an inverse association between insulin resistance and depression, the main psychiatric disorder preceding suicide (8). Insulin resistance is a determinant of free fatty acids in the blood, which are in turn important in tryptophan metabolism and brain serotonin levels (6, 9), and this mechanism may explain an inverse association between insulin resistance and depression. If there are biologic pathways that would result in a tendency to an inverse association between obesity and depression, then one might expect this relation to be demonstrable among men, for whom the social stigma to be slim is less, and also that the association would be linear across the BMI distribution since the proposed biologic mechanism does not suggest a threshold effect. To date, two studies of men that have investigated the association of obesity with suicidal behavior have found no evidence of an association (10, 11).
Here, we present results from a third, very large, prospective cohort study of men in which we examine the association of BMI with suicide risk across the whole distribution.
MATERIALS AND METHODS
Data set examined
All nonadopted males born in Sweden between 1950 and 1981, for whom information on their mother and father was available, were identified in the register of the Swedish total population by using their unique personal identification number (N = 1,654,668). Of these men, 1,442,923 (87.2 percent) had a record in the Military Service Conscription Register (MSCR) between 1968 and 1999. After removal of outliers (inclusion criteria: weight = 40–250 kg, height = 1.3–2.25 m) and men for whom data were missing (on weight, height, date of conscription examination, or conscription center), the total number of included men was 1,409,066. The Swedish military service conscription examination is required by law. Foreign citizenship or a severe, chronic medical condition or a handicap documented in a medical certificate are the only reasons accepted for nonparticipation. It should be noted that the conscription examination is a test of suitability for military service; thus, the MSCR includes individuals who were subsequently exempted from military service.
Linkage of registers
Information on the study sample was obtained by linking the Swedish Multi Generation Register; the MSCR; the Population and Housing Censuses of 1970, 1980, 1985, and 1990; the Longitudinal Database on Education, Income and Employment of 2000; the Swedish Cause of Death Register (up to December 31, 1999); the Swedish Emigration and Immigration Register; and the Swedish Medical Birth Registry. This birth registry is available for only those births occurring since 1973. All record linkage was performed by using the identification number unique to each Swedish citizen. Before we handled that data, all personal identification numbers were replaced with numbers that could not be traced back to personal information.
Disease outcomes
Suicide deaths were identified by using International Classification of Diseases (ICD), Eighth Revision (ICD-8), Ninth Revision (ICD-9), and Tenth Revision (ICD-10): ICD-8 and -9 codes E950–9; ICD-10 codes X60–84. Associations were also investigated with undetermined deaths (deaths where it is uncertain whether the cause was suicide: ICD-8 and -9 codes E980–9; ICD-10 codes Y10–34).
Risk factors investigated
Height and weight measurements at age 18–19 years were obtained from the MSCR for the years 1968–1999. We used BMI (weight (in kilograms)/height (in meters) squared) as our index of adiposity. The MSCR also contains a record of any health problems, including mental illness, identified at the conscription medical examination by the examining physicians. These disorders were coded according to ICD-8 (1968–1991), ICD-9 (1987–1997), and ICD-10 (1997–1999). To assess the relative prevalence of the main psychiatric diagnoses at baseline, we categorized them into four groups: 1) psychosis (ICD-8 and -9 codes 290–299, ICD-10 codes F20–29); 2) depression/neurosis (ICD-8 code 300; ICD-9 codes 300, 311; ICD-10 codes F31–34 and 40–43); 3) drug/alcohol misuse (ICD-8 codes 303–304, ICD-9 codes 303–305; relevant ICD-10 diagnoses were unavailable in this linkage); and 4) other (ICD-8 codes 301, 302, 305–319; ICD-9 codes 301, 302, 306–310; 312–319; ICD-10: all other F codes). The validity of these diagnoses is not clear, but the changing prevalence of recorded psychiatric diagnoses over the study years (from 9 percent in 1968–1979 to 4 percent in 1980–1989 and 3 percent in 1990–1999) indicates changes in diagnostic practices or eligibility criteria for conscription or the recording/reporting of psychiatric illness. Reductions in prevalence were seen for all four of our diagnostic groups (see above).
Parental socioeconomic position, conscription center (six centers), date of birth (to allow for birth cohort effects), and psychiatric diagnosis at conscription were considered as confounding factors. Because height is weakly correlated with BMI and is associated with suicide mortality (12, 13), we additionally assessed the effect of controlling for height on the BMI-suicide associations. We used two measures of socioeconomic position: 1) the highest socioeconomic index of either parent by the time of the conscription (four categories: blue-collar worker, white-collar worker, self-employed, and other); and 2) maternal and paternal education (six categories: <9 years of primary school, 9 years of primary school, <3 years of secondary school, 3 years of secondary school, <3 years of higher education, and ≥3 years of higher education). The highest recorded level from the Swedish Population and Housing Censuses (1970–1990) and the Longitudinal Database on Education, Income and Employment (2000) were used for each parent. The Ethics Committee of the Karolinska Institute, Stockholm, Sweden, approved this record-linkage study.
Altogether, information on all of these confounding factors was complete for 1,299,177 (92 percent) subjects (the remaining 8 percent lacked information on the educational level of either the mother or the father or the socioeconomic index of at least one parent). Our analyses are based on the group of men for whom information on confounding factors was complete. The 109,858 men excluded because of incomplete information on confounding factors were born earlier (median birth year, 1959 vs. 1967; p < 0.0001), were leaner (mean BMI, 21.6 kg/m2 vs. 21.8 kg/m2; p < 0.0001), and had a higher suicide rate (age- and birth-year-adjusted hazard ratio = 1.15, p < 0.01). Excluded men were more likely to have a psychiatric diagnosis at baseline (10.2 percent vs. 5.3 percent, p < 0.0001) and had less-well-educated mothers (fraction of mothers having higher education, 8.2 percent vs. 19.7 percent; p < 0.0001) and fathers (fraction of fathers having higher education, 8.7 percent vs. 18.8 percent; p < 0.0001) than those included in the main analyses.
For men born between 1973 and 1981, we examined the possible confounding effects of birth weight and gestational age at birth by using data from the Swedish Medical Birth Registry.
Statistical methods
All analyses were carried out by using SAS software, version 8.2 (SAS Institute, Inc., Cary, North Carolina). We used Cox proportional hazards models to assess the influence of the factors listed above on the incidence of suicide. We used age as the time axis, which means that all analyses were adjusted for age. In our fully adjusted models, we also controlled for year of birth, conscription test center, psychiatric diagnosis at conscription, parental socioeconomic index, and education. To assess effects of secular changes in BMI and suicide rates over calendar time, adjustment for birth years was performed by stratifying the Cox model on birth year (using birth year in the strata statement of the PHREG procedure in SAS). We carried out graphical tests of the proportionality assumption, which was found to hold. Subjects were censored at the time of death from causes other than suicide, upon emigration, or at the end of the follow-up period (December 31, 1999), whichever was soonest. Tests for linear trend were based on the continuous term for the factor examined. The influence of BMI was examined by using the four World Health Organization categories: 1) underweight (BMI <18.5 kg/m2), 2) normal weight (BMI 18.5–24.9 kg/m2), 3) overweight (BMI 25–30 kg/m2), and 4) obese (BMI >30 kg/m2). For graphical display of the association of BMI with suicide, we also used nine z-score intervals (−<2.00, −2.00 to −1.50, −1.49 to −1.00, −0.99 to −0.50, −0.49 to 0.49, 0.50 to 0.99, 1.00 to 1.49, 1.50 to 2.00, and >2.00).
To assess possible reverse causation—depression leading to weight change and thence suicide rather than BMI being directly associated with suicide risk—we examined associations of BMI with suicide in the first 5 years of follow-up, 5–10 years, and 10 or more years of follow-up separately.
Over the period of our analysis (1968–1999), BMI increased and suicide decreased in Swedish males. To assess the effect of these contrasting secular trends on observed patterns of association, we repeated our analysis by using calendar period as the time axis, and we carried out a stratified analysis examining BMI-suicide associations in those conscripted in 1968–1979 and 1990–1999 separately.
RESULTS
Altogether, 1,299,177 men who contributed 18,965,356 person-years of follow-up were included in this analysis. Up to the end of 1999, a total of 3,075 (0.24 percent) died by suicide—the suicide rate measured from conscription was 16.2 per 100,000 per year. The mean age at death was 30 years (range, 18–48 years). The mean BMI of study members was 21.8 kg/m2; 24,590 (1.9 percent) were obese (BMI >30 kg/m2). The prevalence of obesity increased over time from 1.0 percent among men born in the 1950s, to 1.6 percent among those born in the 1960s, to 2.8 percent among men born between 1970 and 1981. The characteristics of cohort members are given in table 1.
Characteristics of Swedish male conscripts studied to determine the association between body mass index and suicide mortality, 1968–1999*
Characteristic | No. | % | ||
|---|---|---|---|---|
| Continuous variables† | ||||
| Height (m) | 1.79 (0.065) | |||
| Body mass index (weight (kg)/height (m)2) | 21.8 (2.93) | |||
| Categorical variables | ||||
| Year of birth | ||||
| 1950–1955 | 186,000 | 14.3 | ||
| 1956–1960 | 176,904 | 13.6 | ||
| 1961–1965 | 229,548 | 17.7 | ||
| 1966–1970 | 235,582 | 18.1 | ||
| 1971–1975 | 238,185 | 18.3 | ||
| 1976–1981 | 232,958 | 17.9 | ||
| Conscription center | ||||
| Kristianstad | 303,847 | 23.4 | ||
| Göteborg | 265,557 | 20.4 | ||
| Stockholm | 295,784 | 22.8 | ||
| Karlstad | 244,718 | 18.8 | ||
| Östersund | 121,687 | 9.4 | ||
| Boden | 67,584 | 5.2 | ||
| Psychiatric morbidity at conscription | ||||
| Psychosis | 283 | 0.02 | ||
| Depression/neurosis | 28,685 | 2.2 | ||
| Drug/alcohol misuse | 5,419 | 0.42 | ||
| Other | 35,200 | 2.7 | ||
| Maternal education | ||||
| <9 years of primary school | 385,338 | 29.7 | ||
| 9 years of primary school | 134,612 | 10.4 | ||
| <3 years of secondary school | 183,055 | 14.1 | ||
| 3 years of secondary school | 340,784 | 26.2 | ||
| <3 years of higher education | 117,575 | 9.0 | ||
| ≥3 years of higher education | 137,813 | 10.6 | ||
| Paternal education | ||||
| <9 years of primary school | 472,435 | 36.4 | ||
| 9 years of primary school | 94,878 | 7.3 | ||
| <3 years of secondary school | 76,887 | 5.9 | ||
| 3 years of secondary school | 411,185 | 31.6 | ||
| <3 years of higher education | 96,592 | 7.4 | ||
| ≥3 years of higher education | 147,200 | 11.3 | ||
| Highest parental socioeconomic index | ||||
| White collar | 712,007 | 54.8 | ||
| Blue collar | 408,572 | 31.4 | ||
| Self-employed | 122,277 | 9.4 | ||
| Other | 56,321 | 4.3 | ||
Some percentages do not total 100 because of rounding.
Values are expressed as mean (standard deviation).
Men whose BMI was higher were at lower risk of suicide (figure 1, table 2). For each 5-kg/m2 increase in BMI, the risk of suicide decreased by 13 percent (95 percent confidence interval (CI): 7, 18). To assess possible selection bias arising from the exclusion of men for whom confounder information was missing, we repeated the age-adjusted analysis based on all 1,409,066 men with plausible measures of height and weight at conscription. We found that the association was slightly weakened—a 5-kg/m2 increase in BMI was associated with a 10 percent (95 percent CI: 5, 16) decrease in risk.
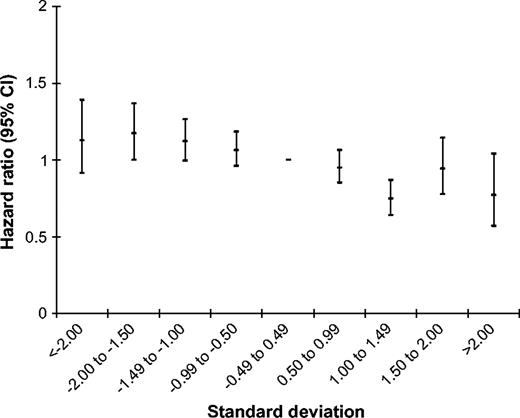
Association of body mass index with suicide in Swedish male conscripts who were born in 1950–1981 and were followed from January 1, 1968, to December 31, 1999. Shown are fully adjusted hazard ratios with 95% confidence intervals (CIs) and body mass index in standard-deviation categories; reference: −0.49 to 0.49. Hazard ratios were adjusted for year of birth, conscription test center, psychiatric diagnosis at conscription examination, and parental socioeconomic index and education.
BMI | Conscripts/suicides (no.) | Age-adjusted hazard ratio | 95% CI† | Fully adjusted hazard ratio | 95% CI |
|---|---|---|---|---|---|
| Underweight (BMI <18.5) | 106,839/344 | 1.18 | 1.05, 1.32 | 1.17 | 1.04, 1.31 |
| Normal weight (BMI 18.5–24.9) | 1,047,329/2,477 | 1.00 | 1.00 | ||
| Overweight (BMI 25–30) | 120,415/216 | 0.90 | 0.79, 1.04 | 0.85 | 0.74, 0.98 |
| Obese (BMI >30) | 24,594/38 | 0.91 | 0.66, 1.26 | 0.81 | 0.59, 1.11 |
| Change in hazard ratio per 5-kg/m2 change in BMI | 1,299,177/3,075 | 0.87 | 0.82, 0.93 | 0.85 | 0.79, 0.91 |
Model controlling for covariates: year of birth, conscription test center, psychiatric diagnosis at conscription examination, and parental socioeconomic index and education.
BMI, body mass index (weight (kg)/height (m)2); CI, confidence interval.
BMI | Conscripts/suicides (no.) | Age-adjusted hazard ratio | 95% CI† | Fully adjusted hazard ratio | 95% CI |
|---|---|---|---|---|---|
| Underweight (BMI <18.5) | 106,839/344 | 1.18 | 1.05, 1.32 | 1.17 | 1.04, 1.31 |
| Normal weight (BMI 18.5–24.9) | 1,047,329/2,477 | 1.00 | 1.00 | ||
| Overweight (BMI 25–30) | 120,415/216 | 0.90 | 0.79, 1.04 | 0.85 | 0.74, 0.98 |
| Obese (BMI >30) | 24,594/38 | 0.91 | 0.66, 1.26 | 0.81 | 0.59, 1.11 |
| Change in hazard ratio per 5-kg/m2 change in BMI | 1,299,177/3,075 | 0.87 | 0.82, 0.93 | 0.85 | 0.79, 0.91 |
Model controlling for covariates: year of birth, conscription test center, psychiatric diagnosis at conscription examination, and parental socioeconomic index and education.
BMI, body mass index (weight (kg)/height (m)2); CI, confidence interval.
In models controlling for conscription center, year of birth, psychiatric diagnosis, parental education, and socioeconomic index, the strength of the association of BMI with suicide increased: For every 5-kg/m2 increase in BMI, there was a 15 percent (95 percent CI: 9, 21) diminution in risk. We assessed the effect on the BMI-suicide associations of additionally controlling for height. We found the association to be practically unchanged (the hazard ratio declined from 0.85 (95 percent CI: 0.79, 0.91) to 0.84 (95 percent CI: 0.79, 0.90)) and so did not include height in subsequent models.
We repeated our analysis by using calendar period as the time axis; the associations were similar to those reported in table 2 (the hazard ratio per 5-kg/m2 increase in BMI in the fully adjusted model was 0.85 (95 percent CI: 0.80, 0.91)). Likewise, associations were similar when we restricted our analysis to men conscripted in 1968–1979 (hazard ratio per 5-kg/m2 increase in BMI in the fully adjusted model = 0.83, 95 percent CI: 0.76, 0.92) and men conscripted in 1990–1999 (hazard ratio = 0.84, 95 percent CI: 0.69, 1.02).
Association of BMI with suicide deaths occurring 5 or more years after conscription
To assess whether BMI-suicide associations diminished over the follow-up period, separate analyses were performed for suicides occurring less than 5 years, 5–10 years, and more than 10 years after measurement. The BMI association was of similar magnitude in all three periods (table 3). In the first 5 years of follow-up, the age-adjusted hazard ratio per five-unit increase in BMI was 0.84 (95 percent CI: 0.73, 0.96) in the fully adjusted analysis. In the 5–10-year period, the hazard ratio was 0.79 (95 percent CI: 0.69, 0.90); for subjects followed up for more than 10 years, the fully adjusted hazard ratio was 0.87 (95 percent CI: 0.79, 0.96). In the group followed up for more than 10 years, no evidence of decreased risk was found for those who were obese (BMI ≥30 kg/m2) at conscription (hazard ratio = 1.08, 95 percent CI: 0.71, 1.65). There were only 22 suicides in this group.
Conscripts/suicides (no.) | Age-adjusted hazard ratio | 95% CI† | Fully adjusted hazard ratio | 95% CI | |
|---|---|---|---|---|---|
| 0–5 years of follow-up | |||||
| Underweight (BMI <18.5) | 106,839/61 | 1.07 | 0.82, 1.39 | 1.09 | 0.83, 1.42 |
| Normal weight (BMI 18.5–24.9) | 1,047,329/553 | 1.00 | 1.00 | ||
| Overweight (BMI 25–30) | 120,415/62 | 1.02 | 0.78, 1.32 | 0.94 | 0.72, 1.23 |
| Obese (BMI >30) | 24,594/9 | 0.76 | 0.40, 1.48 | 0.66 | 0.34, 1.27 |
| Change in hazard ratio per 5-kg/m2 change in BMI | 1,299,177/685 | 0.89 | 0.78, 1.02 | 0.84 | 0.73, 0.96 |
| 5–10 years of follow-up | |||||
| Underweight (BMI <18.5) | 93,310/79 | 1.14 | 0.90, 1.44 | 1.15 | 0.91, 1.46 |
| Normal weight (BMI 18.5–24.9) | 884,397/637 | 1.00 | 1.00 | ||
| Overweight (BMI 25–30) | 93,039/49 | 0.76 | 0.56, 1.01 | 0.71 | 0.53, 0.95 |
| Obese (BMI >30) | 17,360/7 | 0.60 | 0.28, 1.26 | 0.54 | 0.25, 1.13 |
| Change in hazard ratio per 5-kg/m2 change in BMI | 1,088,106/772 | 0.82 | 0.71, 0.94 | 0.79 | 0.69, 0.90 |
| ≥10 years of follow-up | |||||
| Underweight (BMI <18.5) | 77,710/204 | 1.24 | 1.07, 1.44 | 1.22 | 1.05, 1.41 |
| Normal weight (BMI 18.5–24.9) | 692,012/1,287 | 1.00 | 1.00 | ||
| Overweight (BMI 25–30) | 67,857/105 | 0.92 | 0.75, 1.12 | 0.87 | 0.71, 1.06 |
| Obese (BMI >30) | 11,802/22 | 1.21 | 0.79, 1.84 | 1.08 | 0.71, 1.65 |
| Change in hazard ratio per 5-kg/m2 change in BMI | 849,381/1,618 | 0.89 | 0.81, 0.98 | 0.87 | 0.79, 0.96 |
Model controlling for covariates: year of birth, conscription test center, psychiatric diagnosis at conscription examination, and parental socioeconomic index and education.
BMI, body mass index (weight (kg)/height (m)2); CI, confidence interval.
Conscripts/suicides (no.) | Age-adjusted hazard ratio | 95% CI† | Fully adjusted hazard ratio | 95% CI | |
|---|---|---|---|---|---|
| 0–5 years of follow-up | |||||
| Underweight (BMI <18.5) | 106,839/61 | 1.07 | 0.82, 1.39 | 1.09 | 0.83, 1.42 |
| Normal weight (BMI 18.5–24.9) | 1,047,329/553 | 1.00 | 1.00 | ||
| Overweight (BMI 25–30) | 120,415/62 | 1.02 | 0.78, 1.32 | 0.94 | 0.72, 1.23 |
| Obese (BMI >30) | 24,594/9 | 0.76 | 0.40, 1.48 | 0.66 | 0.34, 1.27 |
| Change in hazard ratio per 5-kg/m2 change in BMI | 1,299,177/685 | 0.89 | 0.78, 1.02 | 0.84 | 0.73, 0.96 |
| 5–10 years of follow-up | |||||
| Underweight (BMI <18.5) | 93,310/79 | 1.14 | 0.90, 1.44 | 1.15 | 0.91, 1.46 |
| Normal weight (BMI 18.5–24.9) | 884,397/637 | 1.00 | 1.00 | ||
| Overweight (BMI 25–30) | 93,039/49 | 0.76 | 0.56, 1.01 | 0.71 | 0.53, 0.95 |
| Obese (BMI >30) | 17,360/7 | 0.60 | 0.28, 1.26 | 0.54 | 0.25, 1.13 |
| Change in hazard ratio per 5-kg/m2 change in BMI | 1,088,106/772 | 0.82 | 0.71, 0.94 | 0.79 | 0.69, 0.90 |
| ≥10 years of follow-up | |||||
| Underweight (BMI <18.5) | 77,710/204 | 1.24 | 1.07, 1.44 | 1.22 | 1.05, 1.41 |
| Normal weight (BMI 18.5–24.9) | 692,012/1,287 | 1.00 | 1.00 | ||
| Overweight (BMI 25–30) | 67,857/105 | 0.92 | 0.75, 1.12 | 0.87 | 0.71, 1.06 |
| Obese (BMI >30) | 11,802/22 | 1.21 | 0.79, 1.84 | 1.08 | 0.71, 1.65 |
| Change in hazard ratio per 5-kg/m2 change in BMI | 849,381/1,618 | 0.89 | 0.81, 0.98 | 0.87 | 0.79, 0.96 |
Model controlling for covariates: year of birth, conscription test center, psychiatric diagnosis at conscription examination, and parental socioeconomic index and education.
BMI, body mass index (weight (kg)/height (m)2); CI, confidence interval.
Effects of preexisting psychiatric morbidity and birth weight on BMI-suicide associations
Conscripts with mental illness recorded at conscription tended to be slightly lighter than their colleagues (mean difference in model controlling for year of birth = 0.10 kg/m2, 95 percent CI: 0.08, 0.12; p < 0.0001). The risk of suicide for those with mental illness at baseline was twofold higher than for those without psychiatric illness (hazard ratio = 2.2, 95 percent CI: 1.9, 2.4). When conscripts with psychiatric diagnoses at conscription (n = 67,417 (5.5 percent)) were excluded from the analyses, the association with BMI was essentially unchanged (hazard ratio per five-unit increase in BMI = 0.84, 95 percent CI: 0.78, 0.91). In an analysis restricted to conscripts with mental illness at baseline, the association of BMI with suicide was similar to that seen in the full cohort (hazard ratio per five-unit increase in BMI = 0.86, 95 percent CI: 0.74, 1.02; p = 0.07). We repeated these analyses with the subset of subjects conscripted between 1968 and 1979 because the prevalence of recorded psychiatric disorder was highest in this group (9 percent). For those conscripted between 1968 and 1979, the association among those who had no mental illness diagnosis (hazard ratio = 0.84, 95 percent CI: 0.76, 0.94) was similar to that for those who had such a diagnosis (hazard ratio = 0.79, 95 percent CI: 0.64, 0.98).
In the subgroup of 368,185 men for whom birth-weight data were available, the hazard ratio for suicide associated with a 5-kg/m2 increase in BMI was 0.86 (95 percent CI: 0.68, 1.08) in the fully adjusted model. The association was unchanged after controlling for birth weight (hazard ratio = 0.87, 95 percent CI: 0.69, 1.09) or birth weight plus gestational age (hazard ratio = 0.87, 95 percent CI: 0.69, 1.09).
Association between “undetermined” deaths and BMI
Over the follow-up period, 862 deaths were coded as “undetermined,” whether inflicted accidentally or purposively. BMI was less strongly associated with these deaths (age, year of birth, conscription center, psychiatric diagnosis, parental education, and socioeconomic-index-adjusted hazard ratio per 5-kg/m2 increase in BMI = 0.96, 95 percent CI: 0.85, 1.08).
DISCUSSION
In this large prospective study, we have shown that, among males, risk of suicide decreased with increasing BMI in early adulthood. The strength of this association was unchanged when deaths occurring in the first 5 years of follow-up were excluded, suggesting that weight loss occurring as a result of severe mental disorder (reverse causality) is an unlikely explanation for this association. Previous studies have largely tended to examine the association with BMI dichotomized as obese or not. It is noteworthy that, in our study, the inverse association we found for men was seen across the range of BMI categories (figure 1).
Adult BMI is positively associated with birth weight; our finding is therefore consistent with that from a recent study reporting an inverse association between suicide and birth weight (14). Of note, in our study, controlling for birth weight in the subgroup of study members with records of both birth weight and adult BMI did not materially affect the strength of the association of suicide with BMI. This finding suggests that different causal pathways may be important in the associations of birth weight and BMI with suicide. Low birth weight is also associated with an increased risk of schizophrenia (15) and depression (16). Low weight gain in infancy is associated with increased suicide risk (17), and low BMI in childhood is associated with increased risk of schizophrenia (18), which in turn accounts for about 10 percent of suicides (19). Mechanisms underlying these patterns of risk could therefore contribute to the associations with suicide observed in our study.
Study strengths and limitations
The large sample size and prospective nature of this study are important strengths. These benefits also enabled us to examine the association by excluding events occurring in the first 5 years, which, as discussed above, is important for making causal inferences. Furthermore, we were able to adjust for socioeconomic factors that may be important confounders in this association. Death by suicide is an objective, but extreme endpoint, and we cannot necessarily assume that our results can be generalized to milder expressions of mental illness.
There are five main limitations of our study. First, we had only a single measure of BMI recorded at age 18–19 years. BMI changes over time, which may lead to exposure misclassification and possibly underestimation of BMI-suicide associations. Second, our analyses were restricted to young males only, and our findings may not be generalizable to women or older people. Third, BMI is a relatively crude indicator of adiposity because it does not distinguish between subjects of higher weights due to increased fat mass as opposed to greater muscle bulk. Measures of skinfold thickness, waist circumference, and fat mass are better in this regard but were not available for study members. Nevertheless, the correlation between BMI and alternative measures of adiposity is relatively high (20), so we believe that such misclassification is unlikely to have influenced our conclusions. Fourth, the lack of complete information on any incident psychiatric disorders suffered by study members meant we were unable to fully explore the role of mental disorder in the BMI-suicide associations. Furthermore, the changing prevalence of mental disorder recorded at conscription suggests that there may be changes in the completeness of this variable. Nevertheless, there was no clear indication that the presence of such disorders at baseline greatly influenced any of our assessments of BMI-suicide associations. Lastly, few subjects had measures of birth weight, and we had no measurements of potential mediating factors such as insulin resistance or dietary patterns throughout the life course; therefore, we were unable to fully explore possible pathways underlying our findings (see below).
Possible explanations for BMI-suicide association
Rather than directly causing suicide, low BMI is likely to act as a marker for some other exposure that may be relevant to understanding the etiology of suicide. As described above, it is possible that the associations reflect the association of serious mental disorder with weight loss in early adulthood (reverse causality). In sensitivity analyses, we excluded men with mental disorders identified at conscription and suicides occurring soon after conscription, but it is possible that some cases were missed by the examining physicians. However, it is of note that, even for those with psychiatric disorder identified at conscription, BMI-suicide associations were similar to those seen in the full cohort.
Raised BMI is strongly associated with insulin resistance, which in turn influences free fatty acids in the blood, tryptophan metabolism, and brain serotonin levels (6, 9, 19). Low BMI is associated with low serum cholesterol levels, which may lead to reduced brain serotonin and increased risk of suicide (19, 21). The possible importance of this pathway is suggested by a number of epidemiologic studies demonstrating associations between low cholesterol and suicide (22). Findings from meta-analyses of cholesterol-lowering trials in humans are inconclusive (23, 24), although there is some evidence of an increased risk of suicide and violence for people receiving dietary interventions and nonstatin drugs to reduce cholesterol (24).
Finally, the associations may arise as the result of aspects of diet that affect both mood and weight. Some aspects of diet are thought to affect circulating tryptophan levels—an amino acid important in the synthesis of neurotransmitters such as serotonin, which influence mood. Recent research (25) suggests that carbohydrate-rich breakfasts, which stimulate greater insulin release (and hence weight gain) than high-protein breakfasts, have little impact on tryptophan bioavailability, whereas protein-rich breakfasts promote weight loss but diminish the bioavailability of tryptophan.
Evidence that depression causes type 2 diabetes
In contrast to our findings, a number of prospective studies have found that subjects with depression are at increased risk of developing type 2 diabetes, a condition associated with raised BMI (1, 26, 27). Findings from these latter studies, and possible mechanisms underlying the associations they report, do not necessarily conflict with ours. We have studied the association of BMI in early adulthood with suicide—a cause of death associated not only with depression but also with impulsivity and a range of psychiatric and nonpsychiatric disorders as well as adverse life events. Impulsivity may be particularly important in suicides among young males. Furthermore, some evidence suggests that mental illness is less important in the etiology of suicide in younger than in older people (28). Studies by Eaton et al. (26) and others (1, 27) are based mainly on older cohorts and investigate the association of depression (but not other psychiatric disorders or personality traits) with subsequent development of diabetes.
Main conclusion
BMI is inversely associated with suicide. Since BMI is positively associated with cardiovascular disease, cancer, diabetes, and other important causes of morbidity and mortality, we would not recommend interventions to increase BMI to prevent suicide. However, these findings provide insights into the biology of depression and suicide that may result in a greater understanding of its etiology, treatment, and prevention.
Conflict of interest: none declared.
References
Golden SH, Williams JE, Ford DE, et al. Depressive symptoms and the risk of type 2 diabetes: the Atherosclerosis Risk in Communities study.
Onyike CU, Crum RM, Lee HB, et al. Is obesity associated with major depression? Results from the Third National Health and Nutrition Examination Survey.
Roberts RE, Deleger S, Strawbridge WJ, et al. Prospective association between obesity and depression: evidence from the Alameda County Study.
Erickson SJ, Robinson TN, Haydel KF, et al. Are overweight children unhappy? Body mass index, depressive symptoms, and overweight concerns in elementary school children.
Frayn KN, Kingman SM. Dietary sugars and lipid metabolism in humans.
Golomb BA, Tenkanen L, Alikoski T, et al. Insulin sensitivity markers: predictors of accidents and suicides in Helsinki Heart Study screenees.
Lawlor DA, Smith GD, Ebrahim S. Association of insulin resistance with depression: cross sectional findings from the British Women's Heart and Health Study.
Lipsett D, Madras BK, Wurtman RJ, et al. Serum tryptophan level after carbohydrate ingestion: selective decline in non-albumin-bound tryptophan coincident with reduction in serum free fatty acids.
Allebeck P, Bergh C. Height, body mass index and mortality: do social factors explain the association?
Jiang GX, Rasmussen F, Wasserman D. Short stature and poor psychological performance: risk factors for attempted suicide among Swedish male conscripts.
Song YM, Davey Smith G, Sung J. Adult height and cause-specific mortality: a large prospective study of South Korean men.
Magnusson PKE, Gunnell D, Tynelius P, et al. Strong inverse association between height and suicide in a large cohort of Swedish men: evidence of early life origins of suicidal behavior?
Mittendorfer-Rutz E, Rasmussen F, Wasserman D. Restricted fetal growth and adverse maternal psychosocial and socioeconomic conditions as risk factors for suicidal behaviour of offspring: a cohort study.
Cannon M, Jones PB, Murray RM. Obstetric complications and schizophrenia: historical and meta-analytic review.
Thompson C, Syddall H, Rodin I, et al. Birth weight and the risk of depressive disorder in late life.
Barker DJ, Osmond C, Rodin I, et al. Low weight gain in infancy and suicide in adult life.
Wahlbeck K, Forsen T, Osmond C, et al. Association of schizophrenia with low maternal body mass index, small size at birth, and thinness during childhood.
Lean ME, Han TS, Morrison CE. Waist circumference as a measure for indicating need for weight management.
Wardle J, Armitage J, Collins R, et al. Randomised placebo controlled trial of effect on mood of lowering cholesterol concentration. Oxford Cholesterol Study Group.
Muldoon MF, Manuck SB, Mendelsohn AB, et al. Cholesterol reduction and non-illness mortality: meta-analysis of randomised clinical trials.
Wurtman RJ, Wurtman JJ, Regan MM, et al. Effects of normal meals rich in carbohydrates or proteins on plasma tryptophan and tyrosine ratios.
Eaton WW, Armenian H, Gallo J, et al. Depression and risk for onset of type II diabetes. A prospective population-based study.
Kawakami N, Takatsuka N, Shimizu H, et al. Depressive symptoms and occurrence of type 2 diabetes among Japanese men.

