


Abstract
Prior research has demonstrated that shortly after the 1991 Gulf War (Gulf War I), chronic multisymptom illness (CMI) was more common among deployed veterans than among nondeployed veterans. The aims of the current study were to determine the prevalence of CMI among deployed and nondeployed veterans 10 years after Gulf War I, compare the distribution of comorbid conditions, and identify prewar factors associated with CMI. Cross-sectional data collected from 1,061 deployed veterans and 1,128 nondeployed veterans examined between 1999 and 2001 were analyzed. CMI prevalence was 28.9% among deployed veterans and 15.8% among nondeployed veterans (odds ratio = 2.16, 95% confidence interval: 1.61, 2.90). Deployed and nondeployed veterans with CMI had similarly poorer quality-of-life measures and higher prevalences of symptom-based medical conditions, metabolic syndrome, and psychiatric disorders. Diagnoses of prewar anxiety disorders (not related to post-traumatic stress disorder) and depression were associated with CMI among both deployed and nondeployed veterans. Nicotine dependence and veteran-reported physician-diagnosed infectious mononucleosis were associated with CMI among deployed veterans, and migraine headaches and gastritis were associated with CMI among nondeployed veterans. CMI continues to be substantially more prevalent among deployed veterans than among nondeployed veterans 10 years after Gulf War I, but it manifests similarly in both groups. It is likely to be a common, persistent problem among veterans returning from the current Gulf War.
After their return to the United States, many veterans of the 1991 Gulf War reported fatigue, musculoskeletal pain, sleep disturbances, cognitive dysfunction, moodiness, and other symptoms (1). These initial self-reports were supported by subsequent surveys of American, British, and Canadian cohorts (2–7). In the absence of an identifiable disorder accounting for these complaints, in 1994 the Centers for Disease Control and Prevention used factor analysis to define a symptom complex termed “chronic multisymptom illness” (CMI). CMI was defined as the presence, for 6 months or longer, of one or more symptoms from at least two of the following clusters: general fatigue, mood and cognitive abnormalities, and musculoskeletal pain (8). Shortly after the 1991 Gulf War, CMI was noted to be quite common in all veterans but more prevalent in deployed veterans than in nondeployed veterans (9–11).
Although CMI prevalence may be higher in deployed veterans than in nondeployed veterans, whether the associated comorbidities and risk factors differ is unknown. We evaluated data collected from 2,189 veterans who participated in the examination phase of the National Health Survey of Gulf War Era Veterans and Their Families (12) 10 years after the 1991 Gulf War to determine whether the prevalence of CMI remained higher in deployed veterans than in nondeployed veterans. We compared prevalences, associated comorbid medical and psychiatric conditions, and possible prewar CMI risk factors in deployed and nondeployed veterans with CMI.
MATERIALS AND METHODS
Study population
Recruitment for the National Health Survey of Gulf War Era Veterans and Their Families, performed in 1995–1996, has been described elsewhere (13) and is summarized in figure 1. Briefly, the US Department of Defense identified the entire cohort of 693,826 soldiers who were deployed to the Persian Gulf during the first Gulf War and approximately half (n = 800,680) of the nondeployed soldiers who were in military service concurrently. A total of 15,000 deployed veterans and 15,000 nondeployed veterans were solicited to participate in the study. To ensure adequate statistical representation of subgroups, we applied stratified random sampling so that 3,000 participants were women, 5,000 were Reservists, and 4,000 were members of the National Guard.
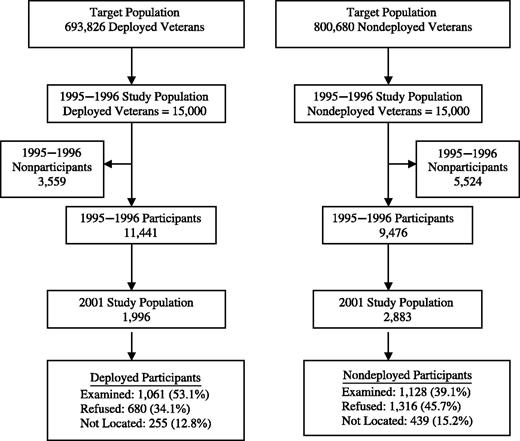
Flow diagram showing participation in the 1995–1996 and 2001 phases of the National Health Survey of Gulf War Era Veterans and Their Families, United States, 1999–2001. Participants were deployed and nondeployed US veterans of the 1991 Gulf War who were examined at 16 Veterans Affairs medical centers.
For our study, we created a list of potential participants by randomly selecting people from the 11,441 deployed and 9,476 nondeployed Gulf War veterans who participated in the 1995–1996 study, stratified by deployment status and last-known residence. We assigned potential participants to one of 16 Veterans Affairs medical centers closest to their home (Albuquerque, New Mexico; Baltimore, Maryland; Birmingham, Alabama; Boston, Massachusetts; Cincinnati, Ohio; Hines, Illinois; Houston, Texas; Miami, Florida; Minneapolis, Minnesota; New Orleans, Louisiana; New York, New York; Portland, Oregon; Richmond, Virginia; Salt Lake City, Utah; San Diego, California; and St. Louis, Missouri).
Recruitment was performed in three waves. Veterans received a mailed recruitment package that described the study and included a “Letter of Intent to Participate.” Potential participants were asked to sign and return the letter. Nonresponders received a newsletter, a 12-minute videotape that presented a typical clinical examination day and testimonies of veterans who had completed the study, and a reminder telephone call. Because of lower participation rates among nondeployed veterans, additional nondeployed veterans were solicited to attain examination groups of equal size.
Participants in the study were reimbursed for travel and per-diem costs and received an honorarium of $200. Institutional review boards at all research sites approved the study protocol and the consent form. All participants gave signed informed consent. Comprehensive examinations were performed (1999–2001), including: medical and psychiatric histories; general physical, neurologic, pulmonary function, and nerve conduction studies; clinical laboratory tests; and neuropsychological tests. The mean examination time was 12 hours over a period of 2 days (12).
Disease diagnostic and exposure criteria
CMI complex.
CMI was defined by the Centers for Disease Control and Prevention as the presence, for 6 months or longer, of one or more symptoms from at least two of the following symptom clusters: general fatigue (cluster A), mood and cognitive abnormalities (cluster B), and musculoskeletal pain (cluster C) (8). This symptom complex was further subclassified as either “mild–moderate” or “severe.” For classification as severe, at least one symptom in each case-defining cluster was required to be severe (figure 2).
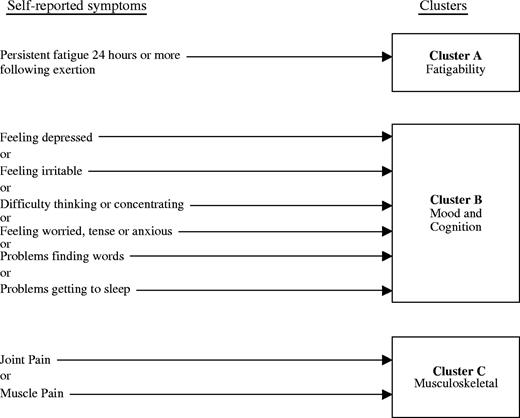
Method used to identify cases of chronic multisymptom illness among deployed and nondeployed US veterans of the 1991 Gulf War who were examined at 16 Veterans Affairs medical centers, United States, 1999–2001. To be defined as cases, participants were required to have one or more symptoms from at least two separate clusters for 6 months or more. Cases were classified as severe if at least one symptom in each case-defining cluster was rated as severe.
To identify cases, we assessed responses to symptom-specific questions pertinent to each cluster as follows: cluster A: “unusual fatigue following exertion that lasts for at least 24 hours”; cluster B: “feeling depressed,” “having difficulty thinking or concentrating,” “irritability,” “being worried, tense, or anxious,” and “having problems getting to sleep”; cluster C: “pain in joints” and “muscle aches/muscle pain.” Data on duration of symptoms were available for all factors except “irritability.” The four subjects who endorsed this as their only cluster B symptom were excluded from the analysis. Data on severity were available for all questions except “feeling anxious.” In response to the question on “being worried, tense, or anxious,” subjects rated the severity of their anxiety as follows: 1) “excessive … much stronger than other people”; 2) “worry … most days”; 3) “find it difficult to stop worrying.” Subjects who endorsed at least two of those three responses were classified as having severe anxiety.
Health-related quality of life.
The Medical Outcomes Study Short Form 36 (SF-36) was used to measure self-reported mental and physical health (14, 15). Items included in the physical component score and the mental component score of the SF-36 focus on current perceptions of health and normal daily functioning. These items are rated on a Likert scale and summed so that a healthy population has a mean score of 50 and a standard deviation of 10.
Medical history.
Participants were interviewed about 91 physician-diagnosed medical conditions covering all body systems. They were asked, “Have you ever been told by a physician that you had [condition]…?” Data on the onset and recency of these conditions were also elicited.
Medical conditions.
The presence of obstructive lung disease, symptomatic arthralgias, diabetes mellitus, hypothyroidism, hyperthyroidism, dyspepsia, hepatitis, peripheral neuropathy, chronic fatigue syndrome, and fibromyalgia syndrome were assessed according to definitions described previously (12). Other diagnoses were based on the following criteria: hypertension—blood pressure ≥160/100 mmHg or history of hypertension and either use of antihypertensive medication or blood pressure ≥140/90 mmHg; renal insufficiency—serum creatinine level >1.5 mg/100 ml; anemia—hemoglobin level <13 g/100 ml in males and <12 g/100 ml in females; leukopenia—white blood cell count <3,500 cells/mm3; leukocytosis—white blood cell count >11,000 cells/mm3; and waist:hip ratio—waist circumference at the umbilicus divided by circumference at the widest portion of the hips. Metabolic syndrome was defined according to the criteria of the National Cholesterol Education Program (16) by the presence of three or more of the following: fasting blood glucose level >110 mg/100 ml, waist circumference >40 inches (>102 cm) in men or >35 inches (>89 cm) in women, serum triglyceride level >150 mg/100 ml, high density lipoprotein cholesterol level <40 mg/100 ml, and hypertension.
Psychiatric disorders.
Psychiatric disorders (major depression, post-traumatic stress disorder (PTSD), nicotine dependence, alcohol dependence, non-PTSD anxiety disorders) were assessed using the Composite International Diagnostic Interview (17), a computerized structured interview yielding diagnoses for clinical disorders according to the criteria of the Diagnostic and Statistical Manual of Mental Disorders, Fourth Edition (18). The interview inquired about age of onset of any disorders and when the disorders may have remitted.
Combat exposure.
A combat exposure score was derived from the 33-item Expanded Combat Exposure Scale, a scale quantifying war-zone stress (19).
Khamisiyah exposure.
In March 1991, US demolition experts destroyed a munitions storage facility in Khamisiyah, Iraq, that was subsequently shown to have contained the nerve agents sarin and cyclosarin. Risks of individual exposure were estimated by the Department of Defense by overlaying troop location data with meteorologic and dispersion modeling; exposure was dichotomized as yes/no (20).
Data quality assurance
To ensure consistency of data collection, a training meeting was conducted prior to the start of data collection; a detailed instruction manual was provided; and regular conference calls for study staff were held. All data underwent quality review by staff at the Hines Cooperative Studies Program Coordinating Center (12).
Statistical analyses
The target sample of 1,000 deployed veterans and 1,000 nondeployed veterans was determined a priori to provide 80 percent power to address each of the original study's seven primary outcome measures (which did not include CMI). The achieved sample provided 80 percent power to detect prevalence differences for CMI of 4.8 percent (assuming a rate of 16 percent among nondeployed veterans).
Population prevalence estimates for the unadjusted and adjusted analyses were obtained from SUDAAN (21), assigning a weight to each observation based on the sampling probabilities of deployment status, gender, and duty type in the 1995–1996 study and the examination rate of the groups in the present study. Odds ratios and 95 percent confidence intervals are reported for dichotomous outcomes. For continuous outcomes, p values shown were based on t tests. Logistic regression models for the dichotomous outcome of CMI were developed for multiple-covariate analysis. The covariates considered in the adjusted analyses were age, gender, race (White vs. other), education (≤12 years vs. >12 years), duty type (active duty vs. Reserve/National Guard), service branch (Army/Marines vs. Navy/Air Force), rank (enlisted vs. officer), income, combat exposure score, Khamisiyah exposure, psychiatric conditions with onset prior to January 1, 1991 (depression, non-PTSD anxiety disorders, nicotine dependence, PTSD, and alcohol dependence), and participant-reported medical conditions diagnosed by a physician prior to January 1, 1991. To determine which medical conditions to include in the multiple regression analysis, we conducted univariate analyses evaluating the association of 91 prewar medical conditions (self-reported) with CMI. Conditions with p values less than 0.25 and a prevalence greater than 0.02, sufficient to avoid model instability (migraine headaches, infectious mononucleosis, gastritis, peptic ulcer disease, asthma, chronic bronchitis), were included. Statistical comparisons were based on the Wald F statistic.
RESULTS
Of the veterans solicited to participate in the study, 53 percent of deployed veterans and 39 percent of nondeployed veterans were examined (figure 1). Because of incomplete data, 38 participants (26 deployed, 12 nondeployed) were excluded from the CMI analyses.
An analysis of nonparticipation bias using data collected in 1995–1996 from all veterans solicited for participation in the study demonstrated that both deployed and nondeployed veterans who participated were likely to report more symptoms and illnesses than veterans who did not participate. Detailed analyses, described elsewhere (12), showed that there were some differences between participants and nonparticipants. However, these differences were independent of deployment status; that is, differences between participants and nonparticipants regarding demographic, military, and self-reported medical characteristics were similar in magnitude for deployed and nondeployed veterans.
CMI was significantly more prevalent among deployed veterans and was more likely to be severe (table 1).
Population prevalence of current chronic multisymptom illness among deployed veterans versus nondeployed veterans of the first Gulf War, United States, 1999–2001
Chronic multisymptom illness status*,† | Deployed veterans (n = 1,035)‡ | Nondeployed veterans (n = 1,116 )§ | Odds ratio | 95% confidence interval | ||||
|---|---|---|---|---|---|---|---|---|
| No. | %¶ | No. | %¶ | |||||
| All cases | 327 | 28.9 | 165 | 15.8 | 2.16 | 1.61, 2.90 | ||
| Mild–moderate cases | 257 | 24.8 | 142 | 14.7 | 1.92 | 1.41, 2.63 | ||
| Severe cases | 70 | 7.0 | 23 | 1.6 | 4.65 | 2.27, 9.52 | ||
Population prevalences were calculated using SUDAAN software (21).
Reference group: noncases (n = 1,659).
Mild–moderate cases: n = 965; severe cases: n = 778.
Mild–moderate cases: n = 1,093; severe cases: n = 974.
Percentages for mild–moderate cases and severe cases do not add up to those for all cases because of weighting.
In univariate analyses (table 2), higher combat exposure was associated with CMI among deployed veterans, while active-duty status (full-time military service) conferred increased risk among nondeployed veterans. Reports of combat exposure among the nondeployed may reflect deployment to combat areas other than the Persian Gulf region. According to Department of Defense modeling (20), 236 of the deployed veterans in our sample may have been exposed to the Khamisiyah munitions explosion, of whom 92 had CMI. While there was no statistically significant difference in Khamisiyah exposure among deployed veterans with and without CMI (table 2), those with severe CMI were more likely to have been exposed.
Comparison of sociodemographic and military service characteristics among deployed and nondeployed veterans of the first Gulf War with and without current chronic multisymptom illness, United States, 1999–2001
Sociodemographic or military service characteristic* | Deployed veterans (CMI† vs. no CMI) | Nondeployed veterans (CMI vs. no CMI) | p value for all CMI cases (deployed vs. nondeployed) | ||||||||||||
|---|---|---|---|---|---|---|---|---|---|---|---|---|---|---|---|
| CMI (%) (n = 327) | No CMI (%) (n = 708) | OR† | 95% CI† | CMI (%) (n = 165) | No CMI (%) (n = 951) | OR | 95% CI | ||||||||
| Female sex | 8.4 | 6.1 | 1.41 | 0.94, 2.13 | 15.6 | 12.6 | 1.29 | 0.81, 2.04 | 0.004 | ||||||
| White race | 78.1 | 76.2 | 1.11 | 0.69, 1.80 | 84.8 | 80.1 | 1.39 | 0.82, 2.36 | 0.16 | ||||||
| Age ≥25 years on January 1, 1991 | 63.8 | 54.1 | 1.49 | 0.99, 2.26 | 70.8 | 68.3 | 1.13 | 0.70, 1.82 | 0.27 | ||||||
| Less than college education‡ | 45.3 | 38.2 | 1.34 | 0.89, 2.01 | 31.8 | 31.5 | 1.02 | 0.64, 1.62 | 0.04 | ||||||
| Married | 69.2 | 70.0 | 0.96 | 0.63, 1.48 | 74.0 | 72.1 | 1.10 | 0.68, 1.77 | 0.41 | ||||||
| Family income less than median§ | 57.7 | 55.8 | 1.08 | 0.71, 1.65 | 56.0 | 47.7 | 1.39 | 0.89, 2.19 | 0.80 | ||||||
| Rank: enlisted¶ | 88.3 | 83.7 | 1.47 | 0.82, 2.65 | 82.3 | 78.4 | 1.28 | 0.73, 2.24 | 0.19 | ||||||
| Branch of service# | 65.6 | 63.4 | 1.10 | 0.71, 1.69 | 64.4 | 68.1 | 0.85 | 0.53, 1.35 | 0.86 | ||||||
| Unit** | 80.9 | 82.8 | 0.88 | 0.65, 1.18 | 79.1 | 72.4 | 1.44 | 1.01, 2.04 | 0.56 | ||||||
| Exposure to munitions explosion in Khamisiyah, Iraq | 19.7 | 13.3 | 1.60 | 0.97, 2.64 | NA† | NA | NA | NA | |||||||
| Mean score on combat exposure scale†† | 8.77 (0.49)‡‡ | 6.54 (0.31) | p < 0.001 | 2.83§§ (0.54) | 2.32§§ (0.21) | p = 0.38 | <0.001 | ||||||||
Population estimates were calculated using SUDAAN software (21).
CMI, chronic multisymptom illness; OR, odds ratio; CI, confidence interval; NA, not applicable.
≤12 years of education vs. >12 years.
<$42,000/year vs. ≥$42,000/year.
Enlisted vs. officer/warrant.
Army/Marines vs. Air Force/Navy.
Active duty vs. Reserve/National Guard.
Derived from the Expanded Combat Exposure Scale, a scale quantifying war-zone stress (19).
Mean value. Numbers in parentheses, standard error.
A few nondeployed veterans were exposed to combat in non-Gulf-related military conflict situations.
Both deployed and nondeployed veterans with CMI had significantly poorer SF-36 summary scores, more clinic visits, and more prescription medication use (table 3). Nondeployed veterans with CMI reported an increased rate of hospitalization in the preceding 12 months, but deployed veterans did not.
Comparison of general health measures among deployed and nondeployed veterans of the first Gulf War with and without current chronic multisymptom illness, United States, 1999–2001
Health measure* | Deployed veterans (CMI† vs. no CMI) | Nondeployed veterans (CMI vs. no CMI) | p value for all CMI cases (deployed vs. nondeployed) | ||||||||||||
|---|---|---|---|---|---|---|---|---|---|---|---|---|---|---|---|
| CMI (n = 327) | No CMI (n = 708) | OR† | 95% CI† | CMI (n = 165) | No CMI (n = 951) | OR | 95% CI | ||||||||
| Mean SF-36† score‡ | |||||||||||||||
| Physical component | 42.9 (1.0)§ | 51.9 (0.4) | p < 0.001 | 44.2 (0.9) | 51.9 (0.3) | p < 0.001 | 0.30 | ||||||||
| Mental component | 42.5 (1.0) | 51.4 (0.5) | p < 0.001 | 45.6 (1.0) | 54.0 (0.3) | p < 0.001 | 0.04 | ||||||||
| ≥1 nonroutine clinic visit in previous 12 months (%) | 71.0 | 52.2 | 2.25 | 1.44, 3.51 | 73.8 | 54.0 | 2.39 | 1.48, 3.87 | 0.65 | ||||||
| ≥1 hospitalization in previous 12 months (%) | 5.1 | 3.3 | 1.60 | 0.63, 3.97 | 9.6 | 4.5 | 2.28 | 1.02, 5.08 | 0.17 | ||||||
| Mean no. of prescription medications | 1.16 (0.18) | 0.57 (0.07) | p = 0.002 | 1.32 (0.16) | 0.81 (0.06) | p = 0.004 | 0.52 | ||||||||
| Use of ≥1 psychotropic medication (%) | 10.4 | 3.0 | 3.78 | 1.74, 8.22 | 17.4 | 3.7 | 5.48 | 2.81, 10.68 | 0.11 | ||||||
Population estimates were calculated using SUDAAN software (21).
CMI, chronic multisymptom illness; OR, odds ratio; CI, confidence interval; SF-36, Medical Outcomes Study Short Form 36.
Items are rated on a Likert scale and summed so that a healthy population has a mean score of 50 and a standard deviation of 10 (14, 15).
Numbers in parentheses, standard error.
CMI in both deployed and nondeployed veterans was significantly associated with fibromyalgia syndrome, chronic fatigue syndrome, symptomatic arthralgias, dyspepsia, and metabolic syndrome (table 4). The patterns of physical health problems in deployed and nondeployed veterans with CMI were very similar, except that deployed veterans with CMI had a higher prevalence of chronic fatigue syndrome that was statistically significant. There was no association with diabetes mellitus, hepatitis, hyperthyroidism, hypothyroidism, renal insufficiency, peripheral neuropathy, obstructive lung disease, anemia, leukopenia, or leukocytosis (data on some conditions are not presented in the tables).
Population prevalence of current medical conditions found on examination among deployed and nondeployed veterans of the first Gulf War with and without current chronic multisymptom illness, United States, 1999–2001
Medical condition* | Deployed veterans (CMI† vs. no CMI) | Nondeployed veterans (CMI vs. no CMI) | p value for all CMI cases (deployed vs. nondeployed) | ||||||||||||
|---|---|---|---|---|---|---|---|---|---|---|---|---|---|---|---|
| CMI (%) (n = 327) | No CMI (%) (n = 708) | OR† | 95% CI† | CMI (%) (n = 165) | No CMI (%) (n = 951) | OR | 95% CI | ||||||||
| Fibromyalgia syndrome | 5.2 | 0.7 | 7.40 | 2.00, 27.43 | 3.0 | 0.8 | 3.86 | 1.19, 12.52 | 0.28 | ||||||
| Chronic fatigue syndrome | 5.7 | 0.0 | NA† | 0.6 | 0.0 | NA | 0.001 | ||||||||
| Symptomatic arthralgias | 9.8 | 3.5 | 3.03 | 1.37, 6.71 | 13.4 | 5.4 | 2.71 | 1.42, 5.16 | 0.36 | ||||||
| Diabetes | 3.7 | 4.5 | 0.81 | 0.29, 2.29 | 5.2 | 3.0 | 1.78 | 0.63, 5.06 | 0.58 | ||||||
| Dyspepsia | 16.3 | 5.8 | 3.15 | 1.63, 6.09 | 11.6 | 4.8 | 2.60 | 1.25, 5.38 | 0.31 | ||||||
| Obstructive lung disease | 4.4 | 4.5 | 0.99 | 0.39, 2.54 | 7.8 | 5.6 | 1.43 | 0.65, 3.14 | 0.26 | ||||||
| Hypertension | 14.1 | 9.1 | 1.63 | 0.91, 2.92 | 19.6 | 14.5 | 1.44 | 0.83, 2.50 | 0.25 | ||||||
| Metabolic syndrome | 25.1 | 13.1 | 2.23 | 1.33, 3.72 | 30.2 | 18.5 | 1.90 | 1.15, 3.14 | 0.42 | ||||||
| Mean waist:hip ratio | |||||||||||||||
| Males | 0.93 (0.01)‡ | 0.91 (0.004) | p = 0.004 | 0.95 (0.01) | 0.92 (0.004) | p = 0.001 | 0.049 | ||||||||
| Females | 0.83 (0.01) | 0.81 (0.01) | p = 0.14 | 0.81 (0.01) | 0.80 (0.01) | p = 0.31 | 0.29 | ||||||||
Population estimates were calculated using SUDAAN software (21).
CMI, chronic multisymptom illness; OR, odds ratio; CI, confidence interval; NA, not applicable.
Mean value. Numbers in parentheses, standard error.
Both deployed and nondeployed veterans with CMI reported higher prevalences of non-PTSD anxiety disorders, major depression, nicotine dependence, alcohol dependence (deployed only), anxiety disorders, and more than one psychiatric disorder during the year preceding the examination (table 5).
Population prevalence of past-year psychiatric disorders found on examination among deployed and nondeployed veterans of the first Gulf War with and without current chronic multisymptom illness, United States, 1999–2001
Past-year psychiatric disorder* | Deployed veterans (CMI† vs. no CMI) | Nondeployed veterans (CMI vs. no CMI) | p value for all CMI cases (deployed vs. nondeployed) | ||||||||||||
|---|---|---|---|---|---|---|---|---|---|---|---|---|---|---|---|
| CMI (%) (n = 327) | No CMI (%) (n = 708) | OR† | 95% CI† | CMI (%) (n = 165) | No CMI (%) (n = 951) | OR | 95% CI | ||||||||
| Post-traumatic stress disorder | 6.1 | 2.0 | 3.24 | 1.21, 8.71 | 7.5 | 1.1 | 7.13 | 2.31, 22.00 | 0.66 | ||||||
| Major depression | 16.1 | 4.2 | 4.44 | 2.26, 8.75 | 14.4 | 3.1 | 5.34 | 2.57, 11.09 | 0.71 | ||||||
| Nicotine dependence | 18.5 | 8.1 | 2.59 | 1.40, 4.80 | 16.2 | 5.6 | 3.25 | 1.67, 6.31 | 0.65 | ||||||
| Alcohol dependence | 3.3 | 0.7 | 4.84 | 1.09, 21.49 | 0.5 | 0.4 | 1.28 | 0.22, 7.36 | 0.02 | ||||||
| Anxiety disorder | 22.1 | 6.1 | 4.34 | 2.42, 7.78 | 21.9 | 5.5 | 4.83 | 2.67, 8.74 | 0.97 | ||||||
| ≥1 mental disorder‡ | 38.7 | 12.7 | 4.35 | 2.74, 6.91 | 38.1 | 10.8 | 5.11 | 3.15, 8.31 | 0.93 | ||||||
Population estimates were calculated using SUDAAN software (21).
CMI, chronic multisymptom illness; OR, odds ratio; CI, confidence interval.
Excluding nicotine dependence.
We identified prewar factors associated with CMI by performing logistic regression analyses for deployed and nondeployed veterans separately (table 6). Sociodemographic and military characteristics, self-reported prewar medical conditions, and prewar psychiatric conditions determined at the time of the examination were evaluated. After adjustment for covariates, prewar non-PTSD anxiety disorders and depression remained strongly associated with CMI regardless of deployment status.
Prewar factors found to be associated with current chronic multisymptom illness among deployed and nondeployed veterans of the first Gulf War, United States, 1999–2001
Predictor | Deployed veterans | Nondeployed veterans | ||||
|---|---|---|---|---|---|---|
| OR†,‡ | 95% CI† | OR‡ | 95% CI | |||
| Anxiety disorders§ | 2.87** | 1.50, 5.50 | 3.89*** | 2.10, 7.20 | ||
| Major depression§ | 3.20** | 1.36, 7.54 | 2.91** | 1.48, 5.72 | ||
| Nicotine dependence§ | 1.96* | 1.01, 3.80 | 1.71 | 0.86, 3.39 | ||
| Migraine headaches¶ | 1.96 | 0.96, 4.00 | 3.01* | 1.23, 7.41 | ||
| Gastritis¶ | 0.51 | 0.18, 1.44 | 4.20* | 1.56, 11.31 | ||
| Infectious mononucleosis¶ | 2.87* | 1.20, 6.85 | 0.43 | 0.17, 1.09 | ||
p < 0.05;
p < 0.01;
p < 0.001.
OR, odds ratio; CI, confidence interval.
Adjusted for differences in age, sex, race (White vs. other), years of education (<12 vs. ≥12), duty type (active duty vs. Reserve/National Guard), service branch (Army/Marines vs. Navy/Air Force), and rank (enlisted vs. officer).
Based on the diagnoses of the Diagnostic and Statistical Manual of Mental Disorders, Fourth Edition (18), using the Composite International Diagnostic Interview (17).
Based on self-report of physician-diagnosed conditions prior to the first Gulf War.
DISCUSSION
Ten years after the 1991 Gulf War, CMI is twice as prevalent in deployed veterans but still affects 15 percent of nondeployed veterans. Despite a greater prevalence of CMI among the deployed, both groups have a similarly poorer quality of life and have substantially more comorbid symptom-based medical conditions and psychiatric disorders than veterans without CMI. The only prewar factors that were independently associated with CMI were mood and mood-related medical conditions, and these too were similar among the deployed and the nondeployed.
CMI prevalence in nondeployed veterans 10 years after the first Gulf War (15.8 percent) was similar to that found by other investigators 4 years (14.7 percent) (8) and 7 years (20 percent) (9) after the war. However, among deployed veterans, the prevalence after 10 years (28.9 percent) was lower than that after 4 years and 7 years (44.7 percent and 47 percent, respectively). Thus, the prevalence of CMI has remained relatively unchanged among the nondeployed but has decreased among deployed veterans. The declining prevalence in deployed veterans is consistent with other observations (22, 23) that CMI symptoms in deployed veterans decrease slowly over time, but the persistence of CMI in nondeployed veterans infers a baseline prevalence of approximately 15 percent that does not remit. We could not determine whether some cases improved and were replenished by new cases.
The medical and psychiatric comorbidities of CMI were primarily symptom-based conditions (chronic fatigue syndrome, fibromyalgia syndrome, symptomatic arthralgias, dyspepsia) and mood-related psychiatric disorders (major depressive disorder, PTSD, non-PTSD anxiety disorders, alcohol and nicotine dependence). In addition, we observed clinically significant poorer quality of life, greater use of prescription medications, and more frequent recent clinic visits among CMI cases. Some of these findings were also noted in veteran populations in the immediate post-Gulf War period (8). Additionally, we found a strong association of CMI with metabolic syndrome, a non-symptom-based medical condition that is a potent risk factor for diabetes mellitus, cardiovascular disease, and liver disease (24, 25). Weight gain (8, 22) has been reported in Gulf War veterans, but not metabolic syndrome. These symptom-based and non-symptom-based findings were remarkably comparable in CMI cases regardless of deployment.
Our observation that CMI is prevalent in the nondeployed and has comorbidity similar to that of CMI in deployed veterans suggests that exposure to the Gulf War may have increased the risk for CMI in susceptible veterans but is not required for its development. We evaluated sociodemographic and military characteristics, self-reported prewar medical conditions, and prewar psychiatric conditions (established at the time of the examination) to determine which factors might confer vulnerability to CMI. Predeployment non-PTSD anxiety disorders and depression were found to have strong independent associations. Other conditions were uniquely associated with CMI in deployed veterans (nicotine dependence and infectious mononucleosis) and nondeployed veterans (migraine headaches and gastritis). Except for infectious mononucleosis, which may cause a fatigue syndrome following infection (26) and is of unclear significance, all of the potential CMI predictors are associated with stress. Possible exposure to the Khamisiyah explosion, estimated by Department of Defense modeling (20), was not associated with CMI. While studies based on self-reported exposures have raised concerns (7, 27–29), many others have failed to document objective evidence of neurotoxic (30, 31) or infectious (8, 32–35) etiologic agents in symptomatic Gulf War veterans. Thus, psychological distress, as suggested by others (10, 27), repeatedly emerges as the preeminent predictor of CMI. Consistent with these findings, cognitive behavior therapy has been found to relieve some CMI symptoms (36).
The mechanisms for CMI symptoms may be suggested by those of other symptom-based conditions. In this study and other studies (8, 37), CMI has been strongly associated with chronic fatigue syndrome and fibromyalgia. These conditions are part of a group of “multisymptom illnesses,” including irritable bowel syndrome, multiple chemical sensitivity, and chronic headaches, which have similar symptoms that are unexplained by physical and laboratory examinations (38). Lower sensation thresholds, symptom augmentation (39, 40), and stress mediation by the autonomic nervous system and the hypothalamic-pituitary-adrenal axis (41, 42) appear to be important in the pathology of these conditions. Interestingly, veterans with CMI had higher combat exposure than noncases, higher waist:hip ratios, and a higher prevalence of metabolic syndrome. This is consistent with the understanding that psychological distress, mediated by the hypothalamic-pituitary-adrenal axis, redistributes body fat centripetally and increases food-seeking behavior, obesity, and the risk of metabolic syndrome (43, 44).
Although the participation rate in this study was low, the levels of participation bias among deployed and nondeployed veterans were similar (12), minimizing but not eliminating the impact of this bias on our results. Recall bias may have influenced the prewar psychiatric diagnoses. The major strengths of this study include 1) collection of data using standardized in-person medical and psychiatric evaluations performed in a national, nonclinical cohort of male and female veterans representing all military services and 2) the application of standardized disease definitions by researchers who were blinded to deployment status.
Ten years after the 1991 Gulf War, CMI is twice as prevalent in deployed veterans as in nondeployed veterans, yet it affects 15 percent of the nondeployed. However, because the associated comorbidities are very similar, distinguishing Gulf War CMI from non-Gulf-War CMI is impossible using general medical and psychiatric data. This observation suggests that war exposure increases the risk of CMI, which is very common in the general population. Poor mental and physical functioning and metabolic syndrome in veterans with CMI portend a substantial future health-care burden (24, 25, 45, 46). Physicians should be aware of this symptom complex so that comorbidities can be identified and managed early to minimize long-term effects.
This study was supported by the Cooperative Studies Program of the Department of Veterans Affairs Office of Research and Development.
Gulf War Study participating investigators:Albuquerque, New Mexico—Drs. Larry Davis and Donald Salisbury; Baltimore, Maryland—Dr. Mohamed S. Al-Ibrahim; Birmingham, Alabama—Drs. Warren Blackburn and Mike Everson; Boston, Massachusetts—Drs. Joel Karlinsky, Robin Travers, and Jessica Wolfe; Cincinnati, Ohio—Drs. Dewleen Baker and Charles Mendenhall; Hines, Illinois—Drs. John Crayton (Co-Principal Investigator) and Robert Tentler; Houston, Texas—Dr. Arnold Bernard Gorin; Miami, Florida—Drs. Nancy Klimas and Patricia Major; Minneapolis, Minnesota—Dr. Maureen Murdoch; New Orleans, Louisiana—Drs. Jennifer Vasterling, Vidyullatha Reddy, and Sarala Palliyath; New York, New York (Manhattan)—Dr. Joseph Leung; Portland, Oregon—Dr. Dennis Bourdette; Richmond, Virginia—Drs. James K. Schmitt and Deborah Panebianco; Salt Lake City, Utah—Dr. Michael J. Battistone; San Diego, California—Dr. Arnold Gass; St. Louis, Missouri—Drs. Melvin Blanchard, Francis A. Mithen, Salvador Cruz-Flores, and Steven R. Brenner.
Hines Cooperative Studies Program Coordinating Center, Hines, Illinois: Dr. William G. Henderson, Dr. Domenic J. Reda, David J. Semlow, Tammy Nydam, Renee Alpern, Colleen Hall, Dr. Weichun Xu, Ken Bukowski, Mike Kerr, Rosemarie DeNicolo, Barbara Christine, Tom Sindowski, Sheldena Heard, Victoria Barillas, and Joyce Jimenez.
Brockton Psychometrics Laboratory, Brockton, Massachusetts: Dr. Rosemary Toomey, Lisa James, and Zachary Warren.
Chairpersons' Offices:St. Louis, Missouri—Dr. Seth Eisen and Joyce Hunter; Washington, DC—Drs. Han Kang, Leila Jackson, and Frances Murphy.
Department of Veterans Affairs Cooperative Studies Program, Washington, DC: Dr. John Feussner, Dr. Stephen Berkowitz, and Joseph Gough.
Executive Committee:St. Louis VAMC—Drs. Seth A. Eisen and Melvin Blanchard; Environmental Epidemiology Service, Office of Public Health and Environmental Hazards, Veterans Health Administration—Dr. Han Kang; Department of Veterans Affairs Central Office—Dr. Frances Murphy; Brockton VAMC—Drs. Michael Lyons and Rosemary Toomey; Cooperative Studies Program Coordinating Center—Drs. William G. Henderson and Domenic J. Reda; Naval Health Research Center—Captain Dr. Gregory Gray; Salt Lake City VAMC—Dr. Michael J. Battistone.
Dr. Melvin Blanchard is a staff physician at a Veterans Affairs medical center; the Department of Veterans Affairs provided funding for this study.
References
Unexplained illness among Persian Gulf veterans in an Air National Guard unit: preliminary report—August 1990–March 1995.
Persian Gulf Coordinating Board. Unexplained illnesses among Desert Storm veterans: a search for causes, treatment and cooperation.
The Iowa Persian Gulf Study Group. Self-reported illness and health status among Gulf War veterans: a population-based study.
Kipen HM, Hallman W, Kang H, et al. Prevalence of chronic fatigue and chemical sensitivities in Gulf War Registry veterans.
Coker WJ, Bhatt BM, Blatchley NF, et al. Clinical findings for the first 1000 Gulf War veterans in the Ministry of Defense's medical assessment programme.
Robinson A. Veterans worry that unexplained medical problems a legacy of service during Gulf War.
Proctor SP, Heeren T, White RF, et al. Health status of Persian Gulf War veterans: self-reported symptoms, environmental exposures and effect of stress.
Fukuda K, Nisenbaum R, Stewart G, et al. Chronic multisymptom illness affecting Air Force veterans of the Gulf War.
Steele L. Prevalence and patterns of Gulf War illness in Kansas veterans: association of symptoms with characteristics of person, place, and time of military service.
Wolfe J, Proctor S, Erickson D, et al. Risk factors for multisymptom illness in US Army veterans of the Gulf War.
Unwin C, Blatchley N, Coker W, et al. Health of UK servicemen who served in Persian Gulf War.
Eisen SA, Kang HK, Murphy FM, et al. Gulf War veterans' health: medical evaluation of a U.S. cohort.
Kang HK, Mahan CM, Lee KY, et al. Illnesses among United States veterans of the Gulf War: a population-based survey of 30,000 veterans.
Ware JE Jr. SF-36 health survey: manual and interpretation guide. Boston, MA: The Health Institute, New England Medical Center,
Ware JE Jr. SF-36 physical and mental health summary scales: a user's manual. Boston, MA: The Health Institute, New England Medical Center,
National Cholesterol Education Program (NCEP) Expert Panel on Detection, Evaluation, and Treatment of High Blood Cholesterol in Adults (Adult Treatment Panel III). Third report of the National Cholesterol Education Program Expert Panel on Detection, Evaluation, and Treatment of High Blood Cholesterol in Adults (Adult Treatment Panel III)—final report.
Andrews G, Pefers L. The psychometric properties of the Composite International Diagnostic Interview.
American Psychiatric Association. Diagnostic and statistical manual of mental disorders (DSM-IV). Fourth Edition. Washington, DC: American Psychiatric Association,
Wolfe J, Proctor S, Duncan J, et al. Health symptoms reported by Persian Gulf war veterans two years after return.
Winkenwerder W. US demolition operations at Khamisiyah. Final report. Washington, DC: Department of Defense,
Research Triangle Institute. SUDAAN, release 8.0. Research Triangle Park, NC: Research Triangle Institute,
Stuart JA, Murray KM, Ursano RJ, et al. The Department of Defense's Persian Gulf War registry year 2000: an examination of veterans' health status.
Hotopf M, David AS, Hull L, et al. Gulf War illness—better, worse, or just the same? A cohort study.
Lakka HM, Laaksonen DE, Lakka TA, et al. The metabolic syndrome and total and cardiovascular disease mortality in middle-aged men.
Jousilahti P, Tuomilehto J, Vartiainen E, et al. Body weight, cardiovascular risk factors, and coronary mortality: 15-year follow-up of middle-aged men and women in eastern Finland.
White PD, Thomas JM, Kangro HO, et al. Predictions and associations of fatigue syndromes and mood disorders that occur after infectious mononucleosis.
Nisenbaum R, Barrett DH, Reyes M, et al. Deployment stressors and a chronic multisymptom illness among Gulf War veterans.
Haley RW, Kurt TL. Self-reported exposure to neurotoxic chemical combinations in the Gulf War: a cross-sectional epidemiologic study.
White RF, Proctor SP, Heeren T, et al. Neuropsychological function in Gulf War veterans: relationships to self-reported toxicant exposures.
Amato AA, McVey A, Cha C, et al. Evaluation of neuromuscular symptoms in veterans of the Persian Gulf War.
Sharief MK, Priddin J, Delamont RS, et al. Neurophysiologic analysis of neuromuscular symptoms in UK Gulf War veterans.
Davis L, Eisen ES, Murphy F, et al. Clinical and laboratory assessment of distal peripheral nerves in Gulf War veterans and spouses.
Donta ST, Engel CC Jr, Collins JF, et al. Benefits and harms of doxycycline treatment for Gulf War veterans' illnesses: a randomized, double-blind, placebo-controlled trial.
Gray GC, Kaiser KS, Hawksworth AW, et al. No serologic evidence of an association found between Gulf War service and Mycoplasma fermentans infection.
Lo SC, Levin L, Ribas J, et al. Lack of serological evidence for Mycoplasma fermentans infection in Army Gulf War veterans: a large scale case-control study.
Donta ST, Clauw DJ, Engel CC Jr, et al. Cognitive behavioral therapy and aerobic exercise for Gulf War veterans' illnesses: a randomized controlled trial.
Baker DG, McQuarrie IG, Murray MG, et al. Diagnostic status and treatment recommendations for Persian Gulf War veterans with multiple nonspecific symptoms.
Aaron LA, Buchwald D. A review of the evidence for overlap among unexplained clinical conditions.
Mense S. Neurobiological concepts of fibromyalgia—the possible role of descending spinal tracts.
Dunphy R, Bridgewater L, Price D, et al. Visceral and cutaneous hypersensitivity in Persian Gulf War veterans with chronic gastrointestinal symptoms.
Clauw DJ, Williams DA. Relationship between stress and pain in work-related upper extremity disorders: the hidden role of chronic multisymptom illness.
Haley RW, Vongpatanasin W, Wolfe GI, et al. Blunted circadian variation in autonomic regulation of sinus node function in veterans with Gulf War syndrome.
Bjorntorp P. Do stress reactions cause abdominal obesity and comorbidities?
Whooley MA, Kiefe CI, Chesney MA, et al. Depressive symptoms, unemployment, and loss of income. CARDIA Study.

