


Abstract
The authors examined whether a serum pepsinogen test (SPT) based on the combination of the serum pepsinogen I level and pepsinogen I/II ratio is a good predictor of gastric cancer occurrence in a general Japanese population. A total of 2,446 subjects aged ≥40 years were classified into negative, positive, and strong-positive SPT groups and were followed prospectively for 14 years (1988–2002). Compared with that for the negative SPT group (26 men, 10 women), gastric cancer incidence increased significantly for both men (n = 17; age-adjusted hazard ratio = 4.56, 95% confidence interval: 2.42, 8.60) and women (n = 6; age-adjusted hazard ratio = 5.84, 95% confidence interval: 2.00, 17.11) in the strong-positive SPT group. It was also significantly higher in the positive SPT group for men (n = 23; age-adjusted hazard ratio = 3.91, 95% confidence interval: 2.23, 6.86). These associations did not attenuate even after adjustment for other comprehensive risk factors. Stratified analysis revealed significant associations between the SPT and development of intestinal-type gastric cancer as well as of cancer in both Helicobacter pylori–negative and –positive subjects. These findings suggest that the SPT can serve as a predictor of intestinal-type gastric cancer, irrespective of H. pylori infection.
Human pepsinogens are proenzymes for the digestive enzyme pepsin originating in the gastric mucosa and are classified biochemically and immunochemically into two groups, pepsinogen I and pepsinogen II (1, 2). They are secreted into the gastric lumen, and 1 percent of them are also leaked into circulating blood (3). Serum pepsinogen levels reflect the morphologic and functional status of the stomach mucosa, so they serve as a marker of chronic atrophic gastritis (4, 5). Chronic atrophic gastritis has been considered a precursor of gastric cancer, especially the intestinal type (6, 7). Several case-control and cross-sectional studies have revealed a clear association between serum pepsinogen levels and the presence of gastric cancer (8–14). Four nested case-control (15–18) and two cohort (19, 20) studies have demonstrated the predictive association of serum pepsinogen levels with gastric carcinogenesis. However, to our knowledge, there has been no population-based cohort study assessing the association between serum pepsinogen levels and development of gastric cancer that has taken account of other confounding factors, including lifestyle factors and Helicobacter pylori infection.
In Japan, where the morbidity and mortality from gastric cancer are considerably high, a serum pepsinogen test based on the combination of the serum pepsinogen I level and the pepsinogen I/II ratio has recently been implemented to screen for gastric cancer (10, 21–23). Meanwhile, H. pylori infection of the gastric mucosa is closely related to the level of serum pepsinogen (24) and has been shown to increase the risk of gastric cancer (25, 26). In the present study, we examined whether serum pepsinogen test levels could be an independent predictor of gastric cancer in a general population of Japanese men and women, even when taking into account the effect of other risk factors including H. pylori infection.
MATERIALS AND METHODS
Study population
The town of Hisayama is located in a suburban area adjacent to Fukuoka City, a large urban center on Kyushu Island in the southern part of Japan. The population of the town is approximately 7,500 and has been stable for the past 30 years. According to the 1985 census, the age and occupational distributions of the Hisayama population are almost identical to those of Japan as a whole (27). The dietary pattern of the residents is also similar to that of participants in the National Nutrition Survey, which selected its subjects from 300 areas throughout Japan (28).
In 1988, a total of 2,742 Hisayama residents aged 40 years or older (80.1 percent of the total population in that age group) underwent a health checkup. After exclusion of 132 persons with histories of gastrectomy or gastric cancer, five who died during the examination, and 159 whose quantities of stored serum were insufficient for measurement of serum pepsinogen I and II, 2,446 subjects (1,016 men; mean age, 57 years and 1,430 women; mean age, 59 years) were enrolled in the study.
Follow-up survey
The study population was followed for 14 years, from December 1988 through November 2002. The subjects underwent annual health checkups. For all those who did not undergo regular checkups or who moved out of town, health status was checked every year by mail or telephone. In addition, a daily monitoring system was established by the study team and local physicians or members of the Division of Health and Welfare of the town. During the follow-up period, only one subject was lost to follow-up. To identify new occurrences of gastric cancer in the cohort, we monitored the records of barium meal examinations, upper endoscopic examinations, and biopsy diagnoses at local clinics or general hospitals in and around the town. We also checked all records from the annual mass screenings for gastric cancer that used barium examinations. Furthermore, to find any concealed gastric cancer, autopsies were performed on 361 (75.4 percent) of the 479 subjects who died during the follow-up period. The diagnosis of gastric cancer was confirmed by histologic examination of the specimens obtained by gastrectomy, endoscopic mucosal resection, or autopsy in all cases. The tumors were categorized as either intestinal or diffuse, according to the classification of Lauren (29). The location of the tumor within the stomach was determined through a combined evaluation of clinical and histopathologic records.
Risk factor measurement
At baseline, a serum sample was collected from each participant that was stored at −20°C until assay for pepsinogen I and II. The measurement of serum pepsinogen concentrations was carried out by immunoradiometric assay (PG I/II RIA BEAD; Dainabot Co. Ltd., Tokyo, Japan), a modified method of radioimmunoassay (30), in 2002. On the basis of the serum pepsinogen test proposed by Miki et al. (23), the study subjects were placed in two groups, a positive pepsinogen test (serum pepsinogen I levels of ≤70 ng/ml and pepsinogen I/II ratios of ≤3.0) and a negative test (the rest). The positive test group was further subdivided into two groups, a strong-positive test (serum pepsinogen I levels of ≤30 ng/ml and pepsinogen I/II ratios of ≤2.0) and a positive test (the rest). Overall, then, the subjects were divided into three pepsinogen test groups: for men, 735 cases (72.4 percent) in the negative group, 175 (17.2 percent) in the positive group, and 106 (10.4 percent) in the strong-positive group; for women, 997 (69.7 percent), 328 (22.9 percent), and 105 (7.4 percent), respectively.
To isolate the effect of serum pepsinogen test levels on gastric cancer occurrence, several baseline factors in addition to age and sex were examined as potential confounders. Information about smoking habits, alcohol intake, and medical history—including a history of peptic ulcer disease—was obtained by means of a questionnaire administered to each subject. Subjects were divided into two groups by smoking status: nonsmokers and smokers; former smokers were classified as smokers. Alcohol intake was categorized as either current habitual use or not. Data on dietary factors were obtained by a semiquantitative food frequency method (31), and the nutritional elements were adjusted for energy intake by using the method of Willett and Stampfer (32). Serum immunoglobulin G antibodies to H. pylori were assayed by means of quantitative enzyme immunoassay using a commercial kit (HM-CAP; Enteric Products Inc., Westbury, New York). Assay values were interpreted as negative or positive according to the manufacturer's instructions. Diabetes was revealed by medical history, glucose levels (fasting plasma glucose levels of ≥7.8 mmol/liter or casual glucose levels of ≥11.1 mmol/liter), or a 75-g oral glucose tolerance test given to most of the subjects aged 40–79 years (27), with plasma glucose measured by the glucose-oxidase method with a glucose autoanalyzer (Glucorode-MK2; A&T Inc., Tokyo, Japan). Serum cholesterol level was determined enzymatically by using an autoanalyzer (TBA-80S; Toshiba Inc., Tokyo, Japan). Body mass index (weight (kg)/height (m)2) was used as an indicator of obesity.
Statistical analysis
Mean values of the possible risk factors were adjusted for age by using the covariance method and were tested for trends across pepsinogen test levels with multiple regression analysis. The frequencies of risk factors were adjusted for age by the direct method and were tested for trends with the Cochran-Mantel-Haenszel chi-square test. The incidence of gastric cancer was age adjusted by using an indirect standardization method, and its differences by pepsinogen test level were analyzed by means of the Cox proportional hazards model (33). To estimate the risk-factor-adjusted hazard ratios and their 95 percent confidence intervals, we first performed a stepwise method of the Cox proportional hazards model, with p < 0.2 being required for entry into the model and for remaining there, using the possible confounding factors indicated in table 1. As a result, age, H. pylori infection, serum cholesterol, smoking habits, and dietary factors (intake of total energy, salt, and vitamin B1) remained significant risk factors for gastric cancer; these factors were included in the final Cox model as confounding factors. In analysis by histologic type and location of cancer, each of the double cancers was stratified into its respective categories. All tests were two sided, and a p value of <0.05 was considered statistically significant. We used the SAS statistical package for all statistical analyses (34).
Age-adjusted mean values or frequencies of baseline risk factors for gastric cancer according to serum pepsinogen test levels, by sex: the Hisayama study, Japan, 1988
Risk factor | Men | Women | ||||||||||||
|---|---|---|---|---|---|---|---|---|---|---|---|---|---|---|
| Negative (n = 735) | Positive (n = 175) | Strong positive (n = 106) | p for trend | Negative (n = 997) | Positive (n = 328) | Strong positive (n = 105) | p for trend | |||||||
| Age (years)* | 56 | 59 | 64 | <0.01 | 57 | 61 | 67 | <0.01 | ||||||
| Pepsinogen I (ng/ml) | 71.0 | 44.8 | 16.7 | <0.01 | 64.0 | 48.0 | 16.7 | <0.01 | ||||||
| Pepsinogen II (ng/ml) | 16.7 | 19.1 | 13.0 | n.s.† | 16.3 | 21.5 | 14.7 | <0.01 | ||||||
| Pepsinogen I/II ratio‡ | 5.1 | 2.4 | 1.3 | <0.01 | 5.1 | 2.3 | 1.2 | <0.01 | ||||||
| Helicobacter pylori infection (%) | 71.6 | 93.7 | 84.7 | <0.01 | 59.8 | 90.5 | 68.5 | <0.01 | ||||||
| Body mass index (kg/m2) | 23.1 | 22.8 | 22.7 | n.s. | 23.1 | 22.7 | 23.0 | n.s. | ||||||
| Total cholesterol (mmol/liter) | 5.16 | 4.99 | 4.94 | <0.05 | 5.58 | 5.52 | 5.20 | <0.01 | ||||||
| Diabetes (%) | 18.3 | 6.6 | 21.4 | n.s. | 11.1 | 7.6 | 7.8 | n.s. | ||||||
| Smoking (%) | 81.4 | 73.5 | 83.1 | n.s. | 7.9 | 7.7 | 12.8 | n.s. | ||||||
| Alcohol intake (%) | 61.9 | 67.9 | 56.9 | n.s. | 9.3 | 9.7 | 12.9 | n.s. | ||||||
| History of peptic ulcer disease (%) | 26.3 | 18.6 | 19.0 | <0.01 | 8.9 | 11.1 | 5.6 | n.s. | ||||||
| Total energy intake (kcal/day) | 1,904 | 1,972 | 1,875 | n.s. | 1,559 | 1,571 | 1,568 | n.s. | ||||||
| Total fat intake (g/day) | 51.8 | 51.0 | 47.8 | <0.05 | 48.5 | 47.7 | 47.9 | n.s. | ||||||
| Salt intake (g/day) | 13.7 | 14.6 | 14.0 | n.s. | 12.8 | 12.6 | 12.1 | n.s. | ||||||
| Vitamin A intake (IU/day) | 2,784 | 2,991 | 2,753 | n.s. | 3,015 | 2,946 | 2,892 | n.s. | ||||||
| Vitamin B1 intake (mg/day) | 0.85 | 0.89 | 0.88 | n.s. | 0.80 | 0.79 | 0.80 | n.s. | ||||||
| Vitamin B2 intake (mg/day) | 1.27 | 1.26 | 1.17 | n.s. | 1.16 | 1.14 | 1.10 | n.s. | ||||||
| Vitamin C intake (mg/day) | 71.8 | 77.0 | 72.4 | n.s. | 81.3 | 81.5 | 78.7 | n.s. | ||||||
| Dietary fiber intake (g/day) | 11.0 | 10.6 | 10.3 | n.s. | 11.3 | 10.9 | 10.8 | n.s. | ||||||
Not adjusted for age.
n.s., not significant.
Pepsinogen I/pepsinogen II.
Ethical considerations
The study protocol was approved by the Human Ethics Review Committee of the Kyushu University Graduate School of Medical Sciences.
RESULTS
During the follow-up period, gastric cancer developed in 89 subjects (66 men and 23 women); among them, eight (9.0 percent) had two synchronous gastric cancers. Thus, a total of 97 gastric cancer lesions were found. Three cases (3.4 percent) of concealed cancer were not found until autopsy.
Table 1 shows baseline clinical and demographic characteristics of the study subjects according to serum pepsinogen test levels, by sex. For both sexes, mean age significantly increased from the negative to the strong-positive test levels. Thus, the mean values or frequencies of other variables were adjusted for age. For both sexes, the mean values of pepsinogen I, the I/II ratio, and total cholesterol decreased significantly with increasing pepsinogen test levels, while the frequency of positive H. pylori infection was highest in the positive pepsinogen test level group. In addition, for men, the frequency of history of peptic ulcer disease and the total amount of fat intake decreased from the negative to the strong-positive pepsinogen test levels.
Table 2 describes the distribution of person-years and gastric cancer patients according to levels of confounding factors, by sex. Continuous variables were expressed as quartile distributions.
Distribution of gastric cancer patients according to confounding factors: the Hisayama study, Japan, 1988–2002
Confounding factor | Men | Women | ||||
|---|---|---|---|---|---|---|
| Person- years (no.) | Cases (no.) | Person- years (no.) | Cases (no.) | |||
| Age (years) | ||||||
| 40–49 | 1,581 | 5 | 1,774 | 0 | ||
| 50–59 | 3,837 | 10 | 5,328 | 5 | ||
| 60–69 | 3,769 | 23 | 5,487 | 11 | ||
| 70–79 | 2,381 | 20 | 3,980 | 5 | ||
| ≥80 | 866 | 8 | 2,023 | 2 | ||
| Helicobacter pylori infection | ||||||
| Negative | 2,920 | 7 | 5,837 | 4 | ||
| Positive | 9,514 | 59 | 12,755 | 19 | ||
| Total cholesterol (mmol/liter)* | ||||||
| ≤4.59 | 4,068 | 26 | 3,620 | 5 | ||
| 4.60–5.31 | 3,268 | 19 | 4,546 | 5 | ||
| 5.32–6.03 | 2,892 | 13 | 4,895 | 6 | ||
| ≥6.04 | 2,206 | 8 | 5,531 | 7 | ||
| Smoking habits | ||||||
| Never smoker | 2,546 | 11 | 17,123 | 21 | ||
| Smoker | 9,888 | 55 | 1,469 | 2 | ||
| Salt intake (g/day)* | ||||||
| ≤9.5 | 2,630 | 6 | 5,018 | 3 | ||
| 9.6–12.2 | 2,657 | 18 | 4,944 | 6 | ||
| 12.3–15.9 | 3,147 | 16 | 4,587 | 7 | ||
| ≥16.0 | 3,836 | 26 | 3,768 | 7 | ||
| Total energy intake (kcal/day)* | ||||||
| ≤1,421 | 1,231 | 5 | 6,414 | 6 | ||
| 1,422–1,654 | 2,269 | 15 | 5,367 | 8 | ||
| 1,655–1,941 | 3,326 | 17 | 4,305 | 6 | ||
| ≥1,942 | 5,444 | 29 | 2,231 | 3 | ||
| Vitamin B1 intake (mg/day)* | ||||||
| ≤0.57 | 2,688 | 11 | 5,091 | 7 | ||
| 0.58–0.69 | 2,954 | 19 | 4,841 | 4 | ||
| 0.70–0.87 | 3,188 | 17 | 4,108 | 5 | ||
| ≥0.88 | 3,440 | 19 | 4,277 | 7 | ||
Continuous variable, expressed as quartile distributions.
The age-adjusted standardized incidence ratios for gastric cancer were 1.8 for men and 0.4 for women. For both sexes, the age-adjusted standardized incidence ratio significantly increased from the negative to the strong-positive pepsinogen test levels; the difference was statistically significant between the negative and the strong-positive test levels for both sexes, and between the negative and the positive test levels for men (figure 1). As shown in table 3, the associations between serum pepsinogen test level and occurrence of gastric cancer did not attenuate even after adjustment for other confounding factors; the adjusted hazard ratios were 3.42 (95 percent confidence interval: 1.92, 6.11) for men in the positive pepsinogen test level and were 4.13 (95 percent confidence interval: 2.18, 7.82) for men and 5.77 (95 percent confidence interval: 1.91, 17.39) for women in the strong-positive pepsinogen test level.
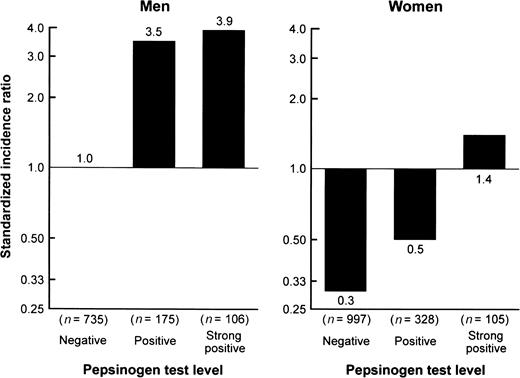
Age-adjusted standardized incidence ratios for gastric cancer according to serum pepsinogen test levels, by sex: the Hisayama study, Japan, 1988–2002. For positive and strong positive, p < 0.01 vs. negative for men; for strong positive, p < 0.01 vs. negative for women.
Age- and multivariate-adjusted hazard ratios and 95% confidence intervals for gastric cancer according to serum pepsinogen test levels, by sex: the Hisayama study, Japan, 1988–2002
Serum pepsinogen test level | Men | Women | ||||||||||||||||||||
|---|---|---|---|---|---|---|---|---|---|---|---|---|---|---|---|---|---|---|---|---|---|---|
| Population at risk (no.) | No. of cases | Age adjusted | Multivariate adjusted† | Population at risk (no.) | No. of cases | Age adjusted | Multivariate adjusted | |||||||||||||||
| HR‡ | 95% CI‡ | HR | 95% CI | HR | 95% CI | HR | 95% CI | |||||||||||||||
| Negative | 735 | 26 | 1.00 | 1.00 | 997 | 10 | 1.00 | 1.00 | ||||||||||||||
| Positive | 175 | 23 | 3.91 | 2.23, 6.86* | 3.42 | 1.92, 6.11* | 328 | 7 | 2.12 | 0.80, 5.63 | 1.88 | 0.69, 5.16 | ||||||||||
| Strong positive | 106 | 17 | 4.56 | 2.42, 8.60* | 4.13 | 2.18, 7.82* | 105 | 6 | 5.84 | 2.00, 17.11* | 5.77 | 1.91, 17.39* | ||||||||||
p < 0.01 vs. negative.
In multivariate analysis, age, Helicobacter pylori infection, serum cholesterol, smoking habits, and dietary factors (intake of total energy, salt, and vitamin B1) were adjusted by means of the Cox proportional hazards model.
HR, hazard ratio; CI, confidence interval.
H. pylori infection is a risk factor for gastric cancer (age- and sex-adjusted hazard ratio = 2.84, 95 percent confidence interval: 1.51, 5.33 for our subjects) and is associated with low serum pepsinogen level. Thus, we examined the association of serum pepsinogen test levels with development of gastric cancer by H. pylori infection status (figure 2). Regardless of H. pylori status, the age-adjusted standardized incidence ratio increased significantly even in the positive pepsinogen test level compared with the negative one.
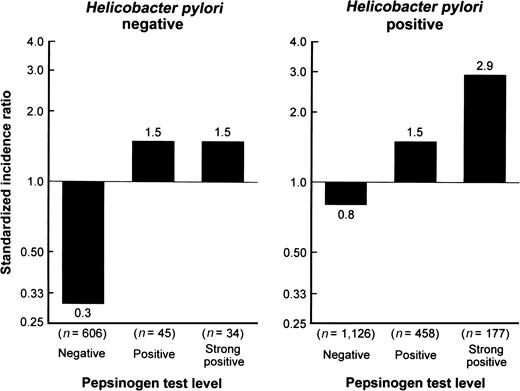
Age-adjusted standardized incidence ratios for gastric cancer according to serum pepsinogen test levels, by Helicobacter pylori infection status: the Hisayama study, Japan, 1988–2002. For positive and strong positive, p < 0.05 vs. negative for both H. pylori–negative and –positive subjects.
Table 4 shows the age-adjusted standardized incidence ratios and multivariate-adjusted hazard ratios for gastric cancer by serum pepsinogen test levels according to histologic type, location of cancer in the stomach, depth of invasion of cancer, and follow-up period. With regard to histologic type, the incidence of intestinal-type cancer increased significantly in a stepwise manner with increasing pepsinogen test levels, but such an association was not found for diffuse-type cancer. The incidence of gastric cancer located in the proximal one third of the stomach significantly increased in the strong-positive pepsinogen test level compared with the negative one, whereas the incidence of cancer located in the distal two thirds significantly increased in the positive and strong-positive pepsinogen test levels. When cancer data were separated according to depth of invasion, the incidence of both early and advanced cancers increased significantly even in the positive pepsinogen test level. The incidence of gastric cancer also increased significantly in the positive and strong-positive pepsinogen test levels in both the early (1–7 years) and the late (8–14 years) periods of follow-up. These associations remained substantially unchanged even after multivariate adjustment for other risk factors, such as age, sex, H. pylori infection, serum cholesterol, smoking habits, and dietary factors.
Age-adjusted standardized incidence ratios and multivariate-adjusted hazard ratios and 95% confidence intervals for gastric cancer, by serum pepsinogen test levels, according to histologic type, location in the stomach, depth of invasion of cancer, and follow-up period: the Hisayama study, Japan, 1988–2002
Characteristic | No. of cases | SIR† | Multivariate- adjusted HR†,‡ | 95% CI† |
|---|---|---|---|---|
| Histologic type | ||||
| Intestinal | ||||
| Negative | 25 | 0.4 | 1.0 | |
| Positive | 25 | 1.2* | 3.75* | 2.07, 6.80 |
| Strong positive | 23 | 2.4* | 5.85* | 3.14, 10.93 |
| Diffuse | ||||
| Negative | 14 | 0.2 | 1.0 | |
| Positive | 7 | 0.4 | 1.69 | 0.66, 4.30 |
| Strong positive | 3 | 0.3 | 1.85 | 0.51, 6.72 |
| Location of cancer | ||||
| Proximal one third | ||||
| Negative | 10 | 0.2 | 1.0 | |
| Positive | 7 | 0.3 | 1.91 | 0.68, 5.35 |
| Strong positive | 6 | 0.7* | 4.11* | 1.42, 11.94 |
| Distal two thirds | ||||
| Negative | 29 | 0.5 | 1.0 | |
| Positive | 25 | 1.2* | 2.98* | 1.69, 5.23 |
| Strong positive | 20 | 2.2* | 4.71* | 2.55, 8.70 |
| Depth of invasion | ||||
| Early | ||||
| Negative | 27 | 0.4 | 1.0 | |
| Positive | 21 | 1.1* | 2.70* | 1.50, 4.87 |
| Strong positive | 14 | 1.6* | 3.64* | 1.85, 7.16 |
| Advanced | ||||
| Negative | 8 | 0.1 | 1.0 | |
| Positive | 10 | 0.5* | 4.42* | 1.68, 11.64 |
| Strong positive | 9 | 1.0* | 7.76* | 2.84, 21.20 |
| Follow-up period | ||||
| 1–7 years | ||||
| Negative | 17 | 0.3 | 1.0 | |
| Positive | 15 | 0.8* | 3.13* | 1.52, 6.46 |
| Strong positive | 12 | 1.4* | 5.26* | 2.41, 11.50 |
| 8–14 years | ||||
| Negative | 19 | 0.3 | 1.0 | |
| Positive | 15 | 0.9* | 2.65* | 1.32, 5.31 |
| Strong positive | 11 | 1.6* | 3.79* | 1.73, 8.31 |
p < 0.01 vs. negative.
SIR, standardized incidence ratio; HR, hazard ratio; CI, confidence interval.
In multivariate analysis, age, sex, Helicobacter pylori infection, serum cholesterol, smoking habits, and dietary factors (intake of total energy, salt, and vitamin B1) were adjusted by means of the Cox proportional hazards model.
DISCUSSION
Study strengths
The present study showed that the risk of gastric cancer clearly increased at the positive pepsinogen test level in men as well as at the strong-positive pepsinogen test level in both men and women, even after adjustment for other confounding factors, such as age, H. pylori infection, serum cholesterol, smoking habits, and dietary factors (intake of total energy, salt, and vitamin B1). This association was found regardless of the status of H. pylori infection as well as of cancer location, depth of invasion, and follow-up period. It was true for intestinal-type cancer but not for diffuse type. Among the studies on this topic, ours has two unique strengths. First, it was a population-based cohort study that eliminated the case selection bias encountered in clinical series of hospital cases and, because of highly accurate methods of case ascertainment, included almost all cases of gastric cancer that developed in the cohort. Second, the association of serum pepsinogen test levels with development of gastric cancer was assessed after considering other confounding factors, including H. pylori infection.
In previous nested case-control and cohort studies, which revealed significant associations of serum pepsinogen levels with the risk of gastric cancer, relative risks ranged from 2.8 to 9.7, although cutoff values of serum pepsinogen levels were different among the studies (15–20). These results are similar to those of our study (hazard ratios = 2.65–7.76).
H. pylori infection
We found a clear association between serum pepsinogen test levels and development of gastric cancer in both H. pylori–negative and –positive subjects. Similar results were obtained in other studies of subjects with H. pylori infection (15, 19), but results were controversial for subjects without H. pylori infection. Parsonnet et al. (15) reported no significant difference in gastric cancer risk between H. pylori–negative subjects with a low pepsinogen level (pepsinogen I <50 ng/ml) and subjects with a normal pepsinogen level (pepsinogen I ≥50 ng/ml). On the other hand, Ohata et al. (19) assessed H. pylori–negative subjects and found an increased risk of gastric cancer for those with a positive pepsinogen test level (pepsinogen I ≤70 ng/ml and pepsinogen I/II ratio ≤3.0) compared with subjects with a negative level. We performed an analysis similar to that of Parsonnet et al.; namely, we divided our H. pylori–negative subjects into two groups using the pepsinogen I cutoff level of 50 ng/ml and compared the risk of gastric cancer between them. As a result, we found no significant difference between the two groups. This finding suggests that Parsonnet's method is not adequate for evaluating the association between serum pepsinogen levels and risk of gastric cancer.
In our study, a group of H. pylori–negative and pepsinogen test–positive or strong-positive subjects might include H. pylori–false-negative persons who had been previously infected by H. pylori and true negative persons who suffer from atrophic gastritis caused by various factors other than H. pylori infection, such as a smoking habit and a high salt intake (35–38). Regardless of what the H. pylori–negative state reflects, the pepsinogen test–positive or strong-positive state indicates a high risk of developing gastric cancer. Thus, the serum pepsinogen test is considered more useful for screening groups at high risk of developing gastric cancer than for measuring H. pylori seropositivity.
Histologic type
When cancer was separated into two groups by histologic type, intestinal and diffuse, the significant association between serum pepsinogen test levels and gastric cancer held true for intestinal-type cancer only. It is generally accepted that intestinal-type gastric adenocarcinoma arises through a multistep process originating with chronic gastritis; progressing through stages of atrophy, intestinal metaplasia, and dysplasia; and finally resulting in intestinal-type cancer (7). Thus, it is reasonable that pepsinogen test positivity, a marker of chronic atrophic gastritis, is closely associated with this type of gastric cancer. On the other hand, diffuse-type gastric cancer is thought to be genetically determined, at least in part, and to be less associated with environmental factors. This type of cancer does not progress through severe atrophic gastritis (39); hence, no clear association with the serum pepsinogen test was seen. Similar findings have been reported in other clinical and epidemiologic studies (18, 19).
Location of cancer
In the analysis by location, cancer found in both the proximal one third and the distal two thirds of the stomach showed a significant association with serum pepsinogen test levels; however, the magnitude of the association was stronger for distal cancer. Atrophic change in gastric mucosa spreads from the anal end to the oral end. Thus, the association between serum pepsinogen test levels and development of gastric cancer is considered stronger for distal cancer. This finding was in accord with those from previous case-control studies (15, 18).
Depth of invasion
With regard to depth of invasion, both early and advanced cancers were clearly associated with serum pepsinogen test levels. The difference between early and advanced cancers is no better than the difference in when cancer is detected. Our findings confirm that the serum pepsinogen test is able to predict not only advanced cancer but also early cancer.
Follow-up period
In the stratified analysis by follow-up period, we observed clear associations between positive as well as strong-positive serum pepsinogen test levels and gastric cancer in both the early and late periods. The serum pepsinogen test could predict not only the short-term but also the long-term occurrence of gastric cancer. In our previous study, however, the association of H. pylori seropositivity with gastric cancer was significant in the late period of follow-up but not in the early period (25). H. pylori carriage declines with progression of gastric conditions from gastritis to cancer (40). Thus, the risk of gastric cancer during short-term follow-up may be selectively biased toward the null. These findings suggest that the serum pepsinogen test prevails over H. pylori seropositivity status in the prediction of gastric cancer.
Sex difference
In our study, the risk of gastric cancer increased significantly at a lower level of the serum pepsinogen test for men (positive level) than for women (strong-positive level). Several clinical and epidemiologic studies have reported that, compared with women, men have a higher risk of developing gastric cancer after severe gastric atrophy (11, 41). In animal experiments, this tolerance of women toward carcinogenesis has been explained in terms of their sex hormones (42). When the serum pepsinogen test is used to screen for gastric cancer, it might be preferable to vary the cutoff level according to sex.
Limitations
Several limitations of our study should be mentioned. The first is that we used frozen, stored serum samples to measure serum pepsinogen levels. The validity of using long-term stored serum is unclear, but the mean values of pepsinogen I and II and the frequency of subjects with positive serum pepsinogen tests in our study were similar to those in a previous report (43). Thus, it is suggested that serum pepsinogen levels remain reliable. The second limitation is that the number of cases of gastric cancer was somewhat small in our cohort. Therefore, the generalizability of the study results may be limited. Nonetheless, we believe that the findings of our study represent the actual associations between the serum pepsinogen test and the occurrence of gastric cancer since we performed this study by using a highly accurate method for determining all gastric cancer cases. The final limitation is that we may have overestimated the incidence of gastric cancer because we could not exclude subjects who had concealed cancer at baseline. However, the prevalence of gastric cancer in healthy subjects has been reported to be low (0.12 percent) according to the nationwide mass screening in Japan (44). In addition, our stratified analysis showed that the association between the serum pepsinogen test and the risk of gastric cancer was similarly significant in both the early and late periods of follow-up. Thus, we believe that concealed cancers were rare at the baseline examination and that the influence of this bias, if any, would be small.
Conclusion
The results of our population-based cohort study show a significant relation between serum pepsinogen test levels and development of intestinal-type gastric cancer, and this relation was consistent irrespective of H. pylori infection. Thus, the serum pepsinogen test may be a practical way to predict future occurrence of intestinal-type gastric cancer. Further studies are needed to clarify the pathogenesis of gastric cancer and to establish screening methods for groups at high risk of this cancer, particularly the diffuse type.
This study was supported in part by a Special Coordination Fund for Promoting Science and a Fund for Technology and Innovative Development Projects in the Life Sciences from the Ministry of Education, Culture, Sports, Science and Technology of Japan.
The authors thank the residents of Hisayama Town for their participation in the survey and the staff of the Division of Health and Welfare of Hisayama for their cooperation in this study.
Conflict of interest: none declared.
References
Samloff IM, Varis K, Ihamaki T, et al. Relationships among serum pepsinogen I, serum pepsinogen II, and gastric mucosal histology. A study in relatives of patients with pernicious anemia.
Miki K, Ichinose M, Shimizu A, et al. Serum pepsinogens as a screening test of extensive chronic gastritis.
Correa P. Human gastric carcinogenesis: a multistep and multifactorial process—First American Cancer Society Award Lecture on Cancer Epidemiology and Prevention.
Nomura AM, Stemmermann GN, Samloff IM. Serum pepsinogen I as a predictor of stomach cancer.
Ellis A, Hughes S, McConnell RB. Gastric neoplasms and pepsinogen phenotypes.
Miki K, Ichinose M, Kawamura N, et al. The significance of low serum pepsinogen levels to detect stomach cancer associated with extensive chronic gastritis in Japanese subjects.
Webb PM, Hengels KJ, Moller H, et al. The epidemiology of low serum pepsinogen A levels and an international association with gastric cancer rates. EUROGAST Study Group.
Kikuchi S, Wada O, Miki K, et al. Serum pepsinogen as a new marker for gastric carcinoma among young adults. Research Group on Prevention of Gastric Carcinoma among Young Adults.
Fukuda H, Saito D, Hayashi S, et al. Helicobacter pylori infection, serum pepsinogen level and gastric cancer: a case-control study in Japan.
Kodoi A, Yoshihara M, Sumii K, et al. Serum pepsinogen in screening for gastric cancer.
Parsonnet J, Samloff IM, Nelson LM, et al. Helicobacter pylori, pepsinogen, and risk for gastric adenocarcinoma.
Aromaa A, Kosunen TU, Knekt P, et al. Circulating anti-Helicobacter pylori immunoglobulin A antibodies and low serum pepsinogen I level are associated with increased risk of gastric cancer.
Watanabe Y, Kurata JH, Mizuno S, et al. Helicobacter pylori infection and gastric cancer. A nested case-control study in a rural area of Japan.
Nomura AM, Stemmermann GN, Chyou PH. Gastric cancer among the Japanese in Hawaii.
Ohata H, Kitauchi S, Yoshimura N, et al. Progression of chronic atrophic gastritis associated with Helicobacter pylori infection increases risk of gastric cancer.
Watabe H, Mitsushima T, Yamaji Y, et al. Predicting the development of gastric cancer from combining Helicobacter pylori antibodies and serum pepsinogen status: a prospective endoscopic cohort study.
Miki K, Ichinose M, Ishikawa KB, et al. Clinical application of serum pepsinogen I and II levels for mass screening to detect gastric cancer.
Kitahara F, Kobayashi K, Sato T, et al. Accuracy of screening for gastric cancer using serum pepsinogen concentrations.
Miki K, Morita M, Sasajima M, et al. Usefulness of gastric cancer screening using the serum pepsinogen test method.
Kiyohira K, Yoshihara M, Ito M, et al. Serum pepsinogen concentration as a marker of Helicobacter pylori infection and the histologic grade of gastritis; evaluation of gastric mucosa by serum pepsinogen levels.
Yamagata H, Kiyohara Y, Aoyagi K, et al. Impact of Helicobacter pylori infection on gastric cancer incidence in a general Japanese population: the Hisayama study.
Uemura N, Okamoto S, Yamamoto S, et al. Helicobacter pylori infection and the development of gastric cancer.
Ohmura T, Ueda K, Kiyohara Y, et al. Prevalence of type 2 (non-insulin-dependent) diabetes mellitus and impaired glucose tolerance in the Japanese general population: the Hisayama Study.
The Ministry of Health and Welfare of Japan. The Results of the National Nutrition Survey in 1989. (In Japanese). Tokyo, Japan: Dai-Ichi Shuppan Publishing Co Ltd,
Lauren P. The two histological main types of gastric carcinoma: diffuse and so-called intestinal-type carcinoma. An attempt at a histo-clinical classification.
Ichinose M, Miki K, Furihata C, et al. Radioimmunoassay of serum group I and group II pepsinogens in normal controls and patients with various disorders.
Shirota T, Yoshizumi E. Accuracy of nutritional survey using the simple method. (In Japanese).
Willett W, Stampfer MJ. Total energy intake: implications for epidemiologic analyses.
Kneller RW, You WC, Chang YS, et al. Cigarette smoking and other risk factors for progression of precancerous stomach lesions.
Kato I, Vivas J, Plummer M, et al. Environmental factors in Helicobacter pylori-related gastric precancerous lesions in Venezuela.
Chen VW, Abu-Elyazeed RR, Zavala DE, et al. Risk factors of gastric precancerous lesions in a high-risk Colombian population.
Bergin IL, Sheppard BJ, Fox JG. Helicobacter pylori infection and high dietary salt independently induce atrophic gastritis and intestinal metaplasia in commercially available outbred Mongolian gerbils.
Nardone G. Review article: molecular basis of gastric carcinogenesis.
Kokkola A, Kosunen TU, Puolakkainen P, et al. Spontaneous disappearance of Helicobacter pylori antibodies in patients with advanced atrophic corpus gastritis.
Sipponen P, Kekki M, Haapakoski J, et al. Gastric cancer risk in chronic atrophic gastritis: statistical calculations of cross-sectional data.
Furukawa H, Iwanaga T, Koyama H, et al. Effect of sex hormones on the experimental induction of cancer in rat stomach—a preliminary study.
Hattori Y, Tashiro H, Kawamoto T, et al. Sensitivity and specificity of mass screening for gastric cancer using the measurement of serum pepsinogens.

