


Abstract
The authors explored the relation of body mass index (BMI; weight (kg)/height (m)2) and weight change to all-cause mortality in the elderly, using data from a large, population-based California cohort study, the Leisure World Cohort Study. They estimated relative risks of mortality associated with self-reported BMI at study entry, BMI at age 21 years, and weight change between age 21 and study entry. Participants were categorized as underweight (BMI <18.5), normal weight (BMI 18.5–24.9), overweight (BMI 25–29.9), or obese (BMI ≥30). Of 13,451 participants aged 73 years (on average) at study entry (1981–1985), 11,203 died during 23 years of follow-up (1981–2004). Relative to normal weight, being underweight (relative risk (RR) = 1.51, 95% confidence interval (CI): 1.38, 1.65) or obese (RR = 1.25, 95% CI: 1.13, 1.38) at study entry was associated with increased mortality. People who were either overweight or obese at age 21 also had increased mortality (RR = 1.17, 95% CI: 1.09, 1.25). Participants who lost weight between age 21 and study entry had increased mortality regardless of their BMI category at age 21. Obesity was significantly associated with increased mortality only among persons under age 75 years and among never or past smokers. This study highlights the influence on older-age mortality risk of being overweight or obese in young adulthood and underweight or obese in later life.
Although studies relating body mass index (BMI) to all-cause mortality are numerous, the nature of this association in elderly persons (ages ≥65 years) is unclear. In 2001, Heiat et al. (1) reviewed findings on the BMI-mortality relation in the elderly. They concluded that current data do not support the notion that being overweight, as opposed to obese, increases mortality risk and argued that federal guidelines for ideal weight may be overly restrictive for older adults (1). In a recent analysis using a representative sample of the US population to estimate excess deaths attributable to being underweight, overweight, or obese, Flegal et al. (2) also concluded that being overweight is not related to increased mortality in the elderly. They recognized the need for additional studies in this age group. Furthermore, little is known about the effects of weight change from early adulthood to old age on mortality.
The objective of this study was to explore the associations between BMI at study entry, BMI at age 21 years, and weight change and all-cause mortality in the elderly using data from a large, population-based cohort study. The cohort had an average age at entry of 73 years and 23 years of follow-up. We also explored whether these associations varied by gender, age, or smoking status. In addition to its large size and long follow-up period, this cohort study had the advantage of possessing information on many variables that may confound or modify the association between weight and mortality.
MATERIALS AND METHODS
Participants
Participants were members of the Leisure World Cohort Study, a population-based study initiated in 1981. A health questionnaire was mailed on June 1, 1981, to all residents who owned homes in Leisure World Laguna Hills, a retirement community in California. Residents who moved into the community after this date were sent surveys in 1982, 1983, and 1985. The survey was returned by 13,978 residents (61 percent). Nonrespondents had higher hospitalization rates than respondents during the first year of follow-up and higher death rates during the first 3 years but not thereafter (3). The cohort, like the population, is primarily Caucasian, educated, and upper middle-class; two thirds are female. The health questionnaire collected information on demographic factors, medical history (selected data), exercise, and smoking, among other variables. The institutional review boards of the University of Southern California and the University of California, Irvine, approved the study.
Potential predictors of mortality
BMI at study entry and at age 21 years.
Participants were asked to report their height (in inches) and weight (in pounds) at the time of the survey and to estimate their weight at age 21 years. BMI at study entry was based on self-reported weight and height at entry, and BMI at age 21 was based on self-reported weight at age 21 and height at entry. BMI (weight (kg)/height (m)2) was categorized according to federal guidelines (4): underweight (<18.5), normal weight (18.5–24.9), overweight (25–29.9), and obese (≥30). Because few participants had been obese at age 21 (n = 81; 0.6 percent), we combined the overweight and obese categories. The normal weight category was used as the reference category for all analyses.
Weight change.
Weight change was calculated as percent change in weight from age 21 years to study entry (100 × (weight at entry – weight at age 21)/weight at age 21) and was classified into four categories: >5 percent loss, ≤5 percent change (stable), >5–15 percent gain, and >15 percent gain. Participants were then classified into 12 categories according to their BMI at age 21 and their weight change from age 21 to study entry. The reference category was normal weight at age 21 and stable weight.
Physical activity as a potential confounder.
Studies on the relation between BMI and mortality emphasize the importance of adjusting for physical activity given the high degree of confounding that may occur when studying either factor alone (5). Therefore, we present the results of our analyses both with and without adjustment for physical activity. As part of the survey, participants reported the amount of time they spent in several activities on an average weekday. The activities included active outdoor activities (e.g., swimming, biking, jogging, tennis, vigorous walking) and active indoor activities (e.g., exercising, dancing). The response categories were 0 minutes, 15 minutes, 30 minutes, 1 hour, 2 hours, 3–4 hours, 5–6 hours, 7–8 hours, and 9 or more hours per day. We calculated the amount of time spent per day in active activities by summing time spent in active outdoor activities and time spent in active indoor activities. Responses were grouped into seven categories: 0 minutes (reference category), 15 minutes, 30 minutes, 45 minutes, 1–1.75 hours, 2–2.75 hours, and 3 or more hours per day. We selected categories before conducting the analyses in order to ensure sufficient numbers of participants in each category. Although more passive activities such as fishing, gardening, reading, and crafts were assessed as part of the questionnaire, they were not included in the category of active activities analyzed here.
Medical history as a potential confounder.
Some authors have suggested that adjustment for factors such as hypertension, diabetes, and high cholesterol results in biased estimates, since these factors are biologic intermediates in the causal pathway between obesity and mortality rather than confounders (6, 7). Therefore, we show the results of all analyses both with and without adjustment for the available medical history variables known to be associated with mortality in our study and others: hypertension, angina, myocardial infarction, stroke, diabetes mellitus, rheumatoid arthritis, and cancer (excluding skin cancer other than melanoma).
Outcome ascertainment
Cohort members have been followed by means of periodic resurveys, reviews of local hospital discharge records, and determination of vital status through searches of national and commercial death indexes and ascertainment of death certificates. Findings presented in this report were based on follow-up data through December 31, 2004. As of that date, 51 participants (0.4 percent) had been lost to follow-up. Further details on the data collection methods used and the validity of exposure and outcome data are available in previously published reports (3, 8–10).
Statistical analysis
We used Cox regression (11) to estimate the relative risk of all-cause mortality associated with BMI at study entry, BMI at age 21 years, and weight change from age 21 to study entry. Participants not known to have died by December 31, 2004, were censored at their age on that date. All analyses were adjusted for age at entry (continuous variable), gender, and smoking status at entry (never, past, or current smoker). We also present the results of analyses with adjustment for physical activity (seven categories) and medical history (positive vs. negative). All analyses were performed using SAS software, version 9.1 for Windows (SAS Institute, Inc., Cary, North Carolina).
To address the possibility that the relation between the factors under study and mortality may have been confounded by preexisting disease, we repeated the analyses after excluding the first 5 years of follow-up. To explore potential differences in the association between BMI and mortality according to smoking status, age at entry, and gender, we performed additional stratified analyses.
RESULTS
We analyzed data for 13,451 participants after deleting 527 participants with missing data for the variables of interest. Table 1 shows the characteristics of these participants. The average age at study entry was 73 years, the average duration of follow-up was 13 years, and the majority of participants were women (64 percent). Table 1 also shows the characteristics of participants by BMI category at study entry. People in the higher BMI categories were younger at entry, had greater weight gain, and were more likely to have a history of hypertension or diabetes but were less likely to smoke or have a history of stroke or cancer.
Characteristics of study participants by body mass index* (BMI) category at study entry, Leisure World Cohort Study, 1981–2004
All participants (n = 13,451) | BMI category | |||||||||||||||||
|---|---|---|---|---|---|---|---|---|---|---|---|---|---|---|---|---|---|---|
| Underweight (BMI <18.5) (n = 556) | Normal weight (BMI 18.5–24.9) (n = 9,021) | Overweight (BMI 25–29.9) (n = 3,376) | Obese (BMI ≥30) (n = 498) | |||||||||||||||
| Mean or no. | Range or % | Mean or no. | Range or % | Mean or no. | Range or % | Mean or no. | Range or % | Mean or no. | Range or % | |||||||||
| Mean (range) | ||||||||||||||||||
| Age (years) at entry | 73.5 | 44–101 | 76.5 | 50–98 | 73.9 | 48–101 | 72.5 | 44–99 | 70.8 | 50–94 | ||||||||
| Age (years) at last follow-up | 86.8 | 59–110 | 86.3 | 64–104 | 87.1 | 59–110 | 86.1 | 59–106 | 84.7 | 64–102 | ||||||||
| Duration (years) of follow-up | 13.2 | 0.01–23.6 | 9.8 | 0.04–23.6 | 13.2 | 0.01–23.6 | 13.7 | 0.2–23.6 | 14.0 | 0.4–23.6 | ||||||||
| Height (inches†) | 65.5 | 48–79 | 64.8 | 57–76 | 65.3 | 56–79 | 66.1 | 55–78 | 64.2 | 48–78 | ||||||||
| Weight (pounds‡) at entry | 143.5 | 70–295 | 103.4 | 70–145 | 135.0 | 84–210 | 166.0 | 108–246 | 190.1 | 105–295 | ||||||||
| Weight (pounds) at age 21 years | 130.1 | 75–280 | 116.5 | 80–180 | 127.0 | 75–250 | 138.8 | 80–280 | 141.4 | 88–250 | ||||||||
| Weight change§ (pounds) | 13.4 | −133 to 164 | −13.1 | −70 to 30 | 8.0 | −133 to 65 | 27.2 | −100 to 100 | 48.7 | −30 to 164 | ||||||||
| BMI at entry | 23.5 | 12.4–54.1 | 17.3 | 12.4–18.5 | 22.2 | 18.5–25.0 | 26.7 | 25.0–29.9 | 32.4 | 30.0–54.1 | ||||||||
| BMI at age 21 years | 21.3 | 14.1–44.0 | 19.5 | 14.1–26.7 | 20.9 | 14.1–44.0 | 22.3 | 14.4–44.0 | 24.0 | 15.8–38.2 | ||||||||
| Number (%) | ||||||||||||||||||
| Gender | ||||||||||||||||||
| Male | 4,880 | 36 | 82 | 15 | 3,017 | 33 | 1,633 | 48 | 148 | 30 | ||||||||
| Female | 8,571 | 64 | 474 | 85 | 6,004 | 67 | 1,743 | 52 | 350 | 70 | ||||||||
| Smoking at entry | ||||||||||||||||||
| Never smoker | 6,330 | 47 | 293 | 53 | 4,281 | 47 | 1,514 | 45 | 242 | 49 | ||||||||
| Past smoker | 5,624 | 42 | 159 | 29 | 3,697 | 41 | 1,549 | 46 | 219 | 44 | ||||||||
| Current smoker | 1,497 | 11 | 104 | 19 | 1,043 | 12 | 313 | 9.3 | 37 | 7.4 | ||||||||
| Medical history | ||||||||||||||||||
| Hypertension | 5,243 | 39 | 196 | 35 | 3,251 | 36 | 1,517 | 45 | 279 | 56 | ||||||||
| Angina | 1,526 | 11 | 60 | 11 | 1,007 | 11 | 400 | 12 | 59 | 12 | ||||||||
| Myocardial infarction | 1,366 | 10 | 56 | 10 | 922 | 10 | 340 | 10 | 48 | 9.6 | ||||||||
| Stroke | 657 | 4.9 | 43 | 7.7 | 430 | 4.8 | 167 | 5.0 | 17 | 3.4 | ||||||||
| Diabetes mellitus | 831 | 6.2 | 24 | 4.3 | 519 | 5.8 | 226 | 6.7 | 62 | 13 | ||||||||
| Rheumatoid arthritis | 790 | 5.9 | 32 | 5.8 | 514 | 5.7 | 212 | 6.3 | 32 | 6.4 | ||||||||
| Cancer¶ | 1,568 | 12 | 96 | 17 | 1,059 | 12 | 366 | 11 | 47 | 9.4 | ||||||||
Weight (kg)/height (m)2.
1 inch = 2.5 cm.
1 pound = 0.45 kg.
Change in weight from age 21 years to study entry.
Excludes skin cancer other than melanoma.
BMI at study entry
Table 2 shows the relation between BMI at study entry and all-cause mortality, with adjustment for age at entry, gender, and smoking (model 1). The relation was reverse J-shaped. Underweight participants had the highest mortality (relative risk (RR) = 1.51) in comparison with those in the normal weight category. Obese participants (RR = 1.25) also had increased mortality. Being overweight (RR = 1.01) was not associated with excess mortality. Adjustment for physical activity (model 2) or for physical activity and medical history (model 3) slightly attenuated the relative risk for persons in the obese category (RR = 1.12).
Relative risk of all-cause mortality by body mass index* (BMI) category at study entry, Leisure World Cohort Study, 1981–2004
BMI category | Median BMI | BMI range | No. of participants | No. of deaths | Model 1† | Model 2‡ | Model 3§ | ||||||
|---|---|---|---|---|---|---|---|---|---|---|---|---|---|
| RR¶ | 95% CI¶ | RR | 95% CI | RR | 95% CI | ||||||||
| All participants | |||||||||||||
| Underweight (BMI <18.5) | 17.6 | 12.4–18.5 | 556 | 518 | 1.51 | 1.38, 1.65 | 1.50 | 1.37, 1.64 | 1.53 | 1.40, 1.67 | |||
| Normal weight (BMI 18.5–24.9) | 22.4 | 18.5–25.0 | 9,021 | 7,501 | 1.00 | Reference | 1.00 | Reference | 1.00 | Reference | |||
| Overweight (BMI 25–29.9) | 26.5 | 25.0–29.9 | 3,376 | 2,784 | 1.01 | 0.97, 1.06 | 0.99 | 0.95, 1.03 | 0.97 | 0.93, 1.01 | |||
| Obese (BMI ≥30) | 31.6 | 30.0–54.1 | 498 | 400 | 1.25 | 1.13, 1.38 | 1.18 | 1.07, 1.31 | 1.12 | 1.01, 1.24 | |||
| Excluding the first 5 years of follow-up | |||||||||||||
| Underweight (BMI <18.5) | 17.8 | 12.4–18.5 | 390 | 352 | 1.39 | 1.24, 1.54 | 1.38 | 1.24, 1.54 | 1.42 | 1.27, 1.58 | |||
| Normal weight (BMI 18.5–24.9) | 22.4 | 18.5–25.0 | 7,611 | 6,091 | 1.00 | Reference | 1.00 | Reference | 1.00 | Reference | |||
| Overweight (BMI 25–29.9) | 26.5 | 25.0–29.9 | 2,937 | 2,345 | 1.04 | 0.99, 1.09 | 1.02 | 0.98, 1.08 | 1.00 | 0.95, 1.05 | |||
| Obese (BMI ≥30) | 31.6 | 30.0–54.1 | 437 | 339 | 1.27 | 1.14, 1.42 | 1.22 | 1.10, 1.37 | 1.16 | 1.04, 1.29 | |||
Weight (kg)/height (m)2.
Results were adjusted for age at entry, gender, and smoking.
Results were adjusted for age at entry, gender, smoking, and “active” activities (seven categories).
Results were adjusted for age at entry, gender, smoking, “active” activities (seven categories), and history of hypertension, angina, myocardial infarction, stroke, diabetes, arthritis, and cancer.
RR, relative risk; CI, confidence interval.
In analyses excluding the first 5 years of follow-up, 2,076 decedents were excluded (bottom half of table 2). The association between BMI at study entry and all-cause mortality, after adjustment for age at entry, gender, and smoking (model 1), was U-shaped. In these analyses, the relative risk for being underweight was somewhat attenuated (RR = 1.39). Adjustment for physical activity (model 2) or for physical activity and medical history (model 3) attenuated the relative risk for obese persons, making the association once again reverse J-shaped.
BMI at age 21 years
With adjustment for age at study entry, gender, and smoking, all-cause mortality was significantly increased among participants who were overweight/obese at age 21 years (RR = 1.17) in comparison with those of normal weight at 21 (table 3, model 1). The mortality risk was not different for underweight participants (RR = 1.05). Adjustment for physical activity (model 2) or for physical activity and medical history (model 3) resulted in similar risk estimates. Excluding the first 5 years of follow-up had little effect on the association between BMI at age 21 and all-cause mortality (bottom half of table 3).
Relative risk of all-cause mortality by body mass index* (BMI) category at age 21 years, Leisure World Cohort Study, 1981–2004
BMI category | Median BMI | BMI range | No. of participants | No. of deaths | Model 1† | Model 2‡ | Model 3§ | ||||||
|---|---|---|---|---|---|---|---|---|---|---|---|---|---|
| RR¶ | 95% CI¶ | RR | 95% CI | RR | 95% CI | ||||||||
| All participants | |||||||||||||
| Underweight (BMI <18.5) | 17.8 | 14.1–18.5 | 1,408 | 1,154 | 1.05 | 0.99, 1.12 | 1.04 | 0.97, 1.10 | 1.02 | 0.96, 1.09 | |||
| Normal weight (BMI 18.5–24.9) | 21.1 | 18.5–25.0 | 11,014 | 9,138 | 1.00 | Reference | 1.00 | Reference | 1.00 | Reference | |||
| Overweight/obese (BMI ≥25) | 26.4 | 25.0–44.0 | 1,029 | 911 | 1.17 | 1.09, 1.25 | 1.16 | 1.08, 1.24 | 1.15 | 1.07, 1.23 | |||
| Excluding the first 5 years of follow-up | |||||||||||||
| Underweight (BMI <18.5) | 17.8 | 14.1–18.5 | 1,223 | 969 | 1.06 | 0.99, 1.13 | 1.05 | 0.98, 1.12 | 1.04 | 0.97, 1.11 | |||
| Normal weight (BMI 18.5–24.9) | 21.1 | 18.5–25.0 | 9,356 | 7,479 | 1.00 | Reference | 1.00 | Reference | 1.00 | Reference | |||
| Overweight/obese (BMI ≥25) | 26.4 | 25.0–44.0 | 796 | 678 | 1.13 | 1.04, 1.22 | 1.13 | 1.04, 1.22 | 1.12 | 1.04, 1.21 | |||
Weight (kg)/height (m)2.
Results were adjusted for age at entry, gender, and smoking.
Results were adjusted for age at entry, gender, smoking, and “active” activities (seven categories).
Results were adjusted for age at entry, gender, smoking, “active” activities (seven categories), and history of hypertension, angina, myocardial infarction, stroke, diabetes, arthritis, and cancer.
RR, relative risk; CI, confidence interval.
Weight change
Table 4 shows the relation between all-cause mortality and weight at age 21 years by weight-change category. With adjustment for age at entry, gender, and smoking, mortality was significantly increased for participants who lost weight, regardless of their weight at age 21 (model 1). The relative risks were 1.93, 1.28, and 1.26 for being underweight, normal weight, and overweight/obese, respectively, at age 21. Mortality was also significantly increased among persons who were underweight at age 21 and remained at a stable weight (RR = 1.48) and among persons who were overweight/obese at age 21 and gained more than 15 percent of their body weight (RR = 1.32). With adjustment for physical activity and medical history (models 2 and 3), the relative risks were generally similar in magnitude, but the statistical significance of some risks changed, including significantly lower mortality with weight gain among persons who were underweight or normal weight at age 21.
Relative risk of all-cause mortality by category of weight change from age 21 years to study entry, Leisure World Cohort Study, 1981–2004
Weight change category | Weight change (%) | Weight change (pounds*) | No. of participants | No. of deaths | Model 1† | Model 2‡ | Model 3§ | ||||||||||
|---|---|---|---|---|---|---|---|---|---|---|---|---|---|---|---|---|---|
| Median | Range | Median | Range | RR¶ | 95% CI¶ | RR | 95% CI | RR | 95% CI | ||||||||
| Underweight (BMI¶,# <18.5) at age 21 years | |||||||||||||||||
| Weight loss >5% | −10 | −32.7 to –5.1 | −10 | −34 to –5 | 37 | 34 | 1.93 | 1.37, 2.70 | 1.94 | 1.38, 2.72 | 1.87 | 1.33, 2.63 | |||||
| Stable weight (within 5%) | 0 | −5.0 to 5.0 | 0 | −6 to 6 | 147 | 137 | 1.48 | 1.24, 1.76 | 1.43 | 1.20, 1.70 | 1.45 | 1.22, 1.73 | |||||
| Weight gain 5.1–15% | 10.6 | 5.1 to 15.0 | 11 | 5 to 20 | 260 | 215 | 1.12 | 0.97, 1.28 | 1.10 | 0.96, 1.27 | 1.09 | 0.95, 1.26 | |||||
| Weight gain >15% | 30 | 15.1 to 104.5 | 31 | 13 to 100 | 964 | 768 | 0.97 | 0.90, 1.06 | 0.94 | 0.87, 1.02 | 0.90 | 0.83, 0.98 | |||||
| Normal weight (BMI 18.5–24.9) at age 21 years | |||||||||||||||||
| Weight loss >5% | −9.6 | −33.3 to –5.0 | −13 | −55 to –5 | 1,293 | 1,169 | 1.28 | 1.19, 1.37 | 1.27 | 1.18, 1.36 | 1.26 | 1.17, 1.35 | |||||
| Stable weight (within 5%) | 0.8 | −5.0 to 5.0 | 1 | −9 to 10 | 2,725 | 2,275 | 1.00 | Reference | 1.00 | Reference | 1.00 | Reference | |||||
| Weight gain 5.1–15% | 9.7 | 5.0 to 15.0 | 12 | 5 to 25 | 3,324 | 2,728 | 0.96 | 0.91, 1.01 | 0.95 | 0.90, 1.00 | 0.93 | 0.88, 0.99 | |||||
| Weight gain >15% | 23 | 15.0 to 141.4 | 30 | 15 to 164 | 3,672 | 2,966 | 0.97 | 0.92, 1.02 | 0.94 | 0.88, 0.99 | 0.90 | 0.85, 0.95 | |||||
| Overweight/obese (BMI ≥25) at age 21 years | |||||||||||||||||
| Weight loss >5% | −12.5 | −53.6 to –5.1 | −20 | −133 to –7 | 441 | 403 | 1.26 | 1.13, 1.40 | 1.25 | 1.12, 1.39 | 1.23 | 1.10, 1.37 | |||||
| Stable weight (within 5%) | 0 | −5.0 to 5.0 | 0 | −10 to 10 | 273 | 241 | 1.05 | 0.92, 1.20 | 1.02 | 0.89, 1.16 | 1.00 | 0.88, 1.14 | |||||
| Weight gain 5.1–15% | 8.8 | 5.1 to 15.0 | 15 | 7 to 30 | 201 | 173 | 1.09 | 0.93, 1.27 | 1.06 | 0.91, 1.24 | 1.00 | 0.86, 1.17 | |||||
| Weight gain >15% | 19.8 | 15.2 to 84.4 | 30.5 | 20 to 135 | 114 | 94 | 1.32 | 1.08, 1.63 | 1.25 | 1.02, 1.54 | 1.15 | 0.93, 1.41 | |||||
1 pound = 0.45 kg.
Results were adjusted for age at entry, gender, and smoking.
Results were adjusted for age at entry, gender, smoking, and “active” activities (seven categories).
Results were adjusted for age at entry, gender, smoking, “active” activities (seven categories), and history of hypertension, angina, myocardial infarction, stroke, diabetes, arthritis, and cancer.
RR, relative risk; CI, confidence interval; BMI, body mass index.
Weight (kg)/height (m)2.
The association between weight change and all-cause mortality did not change greatly after exclusion of the first 5 years of follow-up. With adjustment for all potential confounders, the main differences were that 1) the relative risk among persons who were underweight at age 21 and lost weight was attenuated (RR = 1.62, 95 percent CI: 1.06, 2.47); 2) the relative risk among persons who were underweight at age 21 and gained more than 15 percent of their weight remained similar in magnitude but was no longer significant (RR = 0.94, 95 percent CI: 0.86, 1.03); and 3) the relative risk among persons of normal weight at age 21 who gained 5–15 percent of their weight was also similar in magnitude but no longer significant (RR = 0.96, 95 percent CI: 0.91, 1.03).
Stratification by smoking status
The association between BMI at study entry and all-cause mortality varied among the different smoking categories (figure 1). For never smokers, the association was U-shaped, with similarly increased mortality among both underweight (RR = 1.26, 95 percent CI: 1.12, 1.43) and obese (RR = 1.35, 95 percent CI: 1.17, 1.57) participants in comparison with normal-weight participants. For past smokers, the association was reverse J-shaped, with the highest mortality being seen among underweight participants (RR = 1.81, 95 percent CI: 1.54, 2.14), although obese participants also had increased mortality (RR = 1.19, 95 percent CI: 1.03, 1.38). Among current smokers, underweight participants had increased mortality (RR = 1.99, 95 percent CI: 1.61, 2.46) while overweight or obese participants did not differ from persons of normal weight.
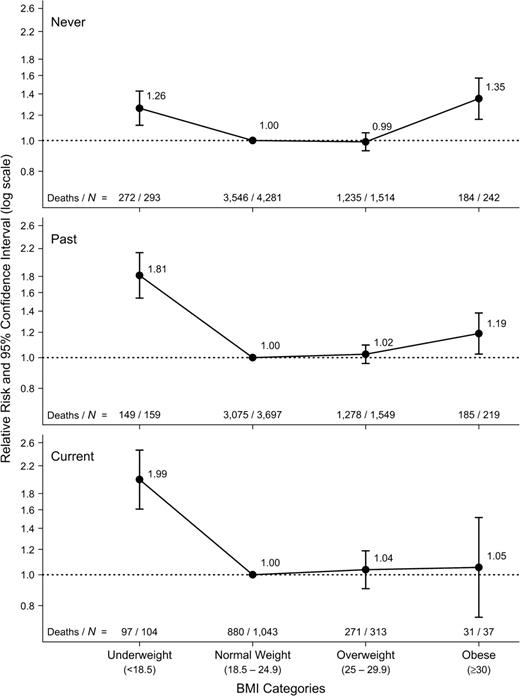
Relative risk of all-cause mortality according to body mass index (BMI; weight (kg)/height (m)2) category at study entry for never, past, and current smokers, Leisure World Cohort Study, 1981–2004. Results were adjusted for gender and age at entry. The normal weight category within each smoking group was used as the reference category. Bars, 95% confidence interval.
Excluding the first 5 years of follow-up slightly changed the curves for the three smoking categories. The relative risks among underweight participants in all smoking categories, especially past smokers, were attenuated (never smokers: RR = 1.21, 95 percent CI: 1.05, 1.40; past smokers: RR = 1.50, 95 percent CI: 1.21, 1.86; current smokers: RR = 1.91, 95 percent CI: 1.49, 2.46). Conversely, the relative risk among obese past smokers was slightly increased (RR = 1.25, 95 percent CI: 1.07, 1.47).
Stratification by age
Figure 2 shows the shape of the association between BMI at study entry and all-cause mortality for four categories of age at entry (<70, 70–74, 75–79, and ≥80 years). The association was reverse J-shaped for all age categories, with the greatest mortality being seen among underweight participants. However, the curves were somewhat flattened for ages ≥70 years. The relative risks for underweight participants were 2.09 (95 percent CI: 1.66, 2.62), 1.47 (95 percent CI: 1.21, 1.80), 1.42 (95 percent CI: 1.20, 1.68), and 1.36 (95 percent CI: 1.17, 1.58) in the four age groups, respectively. While obese participants aged less than 70 years (RR = 1.35, 95 percent CI: 1.13, 1.61) or aged 70–74 years (RR = 1.33, 95 percent CI: 1.10, 1.61) had increased mortality in comparison with their normal-weight counterparts, the mortality of obese participants aged 75–79 years (RR = 1.12, 95 percent CI: 0.92, 1.38) or ≥80 years (RR = 1.22, 95 percent CI: 0.94, 1.58) was not significantly different from that of normal-weight participants. Conversely, overweight participants aged ≥80 years had significantly lower mortality than their normal-weight counterparts (RR = 0.89, 95 percent CI: 0.81, 0.98).
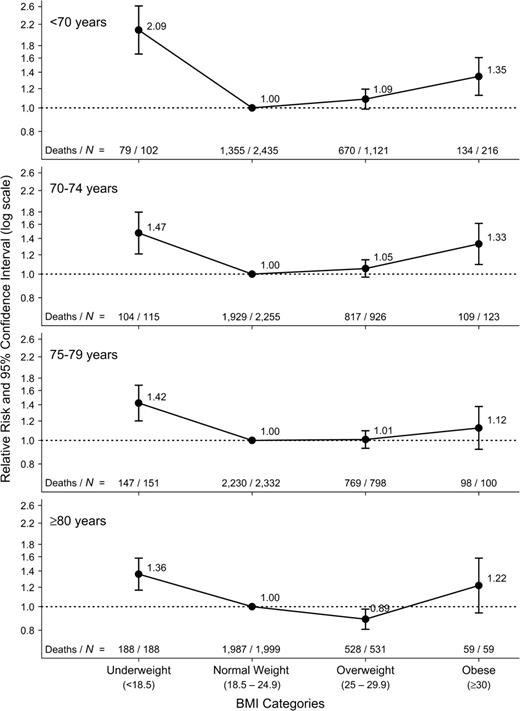
Relative risk of all-cause mortality according to body mass index (BMI; weight (kg)/height (m)2) category at study entry for different age groups at entry, Leisure World Cohort Study, 1981–2004. Results were adjusted for gender and smoking status. The normal weight category within each age group was used as the reference category. Bars, 95% confidence interval.
Excluding the first 5 years of follow-up slightly changed the shape of the association between BMI at entry and all-cause mortality. While the curve for ages <70 years and ≥80 years did not change much, the curves for ages 70–74 years and 75–79 years became U-shaped, with similar nonsignificant relative risks being observed among underweight and obese participants.
Stratification by gender
The curves for the association between BMI at study entry and all-cause mortality were almost identical for men and women (not shown). After adjustment for age at entry and smoking, the curves were reverse J-shaped, with underweight men (RR = 1.52, 95 percent CI: 1.21, 1.90) and women (RR = 1.52, 95 percent CI: 1.37, 1.67) having the highest mortality compared with those in the normal-weight category. Obese men (RR = 1.20, 95 percent CI: 1.01, 1.43) and women (RR = 1.26, 95 percent CI: 1.12, 1.43) also had increased mortality.
Excluding the first 5 years of follow-up changed the shape of the association, particularly in the underweight category. While underweight men no longer had a significant increase in mortality (RR = 1.17, 95 percent CI: 0.84, 1.63), underweight women still had the highest mortality, although the relation was somewhat attenuated (RR = 1.41, 95 percent CI: 1.26, 1.59).
DISCUSSION
Our 23-year follow-up study suggests that all-cause mortality in older adults is increased among persons who are underweight or obese during old age and among persons who were overweight or obese at age 21 years. Both weight loss between age 21 and later life (regardless of weight at age 21) and being underweight at age 21 but not gaining weight later in life were associated with increased mortality. Conversely, being of normal weight at age 21 and gaining weight by late adulthood was associated with decreased all-cause mortality.
To maintain the population-based characteristic of our sample, we included in our analyses some participants who were younger than age 65 years at entry. Although, by our doing this, some participants did not fall into the elderly category, 97 percent of the person-years in our study were for persons aged 65 years or older. In addition, results for analyses excluding persons under age 65 years at entry (not shown) were essentially unchanged.
The shape of the association between BMI and mortality in the elderly remains controversial (1, 12). Most studies have found the association to be U-shaped (13–22) or J-shaped (15, 16, 20, 21, 23, 24) in all or a subset of the subjects under study. However, other studies have found a positive linear association (7, 13, 25), a negative linear association (26–30), or no association (25, 27, 31–34).
The variations in the shape of the association between BMI and all-cause mortality among studies may be due to differences in the age composition of the cohorts, the length of follow-up, and the variables that were adjusted for in the analyses, as well as inclusion or exclusion of smokers or early deaths. Two studies with long follow-up in the elderly have found a reverse J-shaped association (2, 23). The results of these studies agree with our finding that persons in the lowest weight category, regardless of age, adjustment for other confounders, or exclusion of early deaths, have the highest mortality.
The reason for increased mortality among the underweight elderly is not clear. Being lean may represent a real risk because of nutrient deficiency, frailness, and reduced functional status (23). Persons with underlying disease and increased mortality are more likely to be underweight. In our study, however, the highest mortality was observed among the underweight even after exclusion of the first 5 years of follow-up. In some studies, increased mortality with low BMI has been seen only among smokers or the very old (15, 23). We observed increased mortality in the underweight regardless of smoking status or age. Persons in the underweight category in this study may represent a mix of those who chose to be lean and those who were underweight because of illness (35). It may also be a mix, especially in the elderly, of persons with low muscle mass and persons with low fat mass (30). Adjustments for recent weight changes and other measures of assessing body composition are important in order to pinpoint the reasons for increased mortality among the underweight elderly. Nonetheless, our results are fairly robust in showing that underweight elderly have higher mortality than normal-weight elderly.
While the authors of a recent meta-analysis of the association between adiposity and all-cause mortality emphasized the importance of adjusting for physical activity (5), the summary relative risk for an elevated BMI from the studies that included physical activity as a covariate (RR = 1.23) was almost identical to the risk from the studies that did not (RR = 1.24). Consistent with this finding, our results were similar regardless of whether or not we adjusted for physical activities.
It has been suggested that adjusting for factors such as hypertension and diabetes in regression analyses represents overadjustment and produces biased estimates (6, 7), since these factors are biologic intermediates on the causal pathway between obesity and mortality rather than confounders. Adjustment for the specified medical conditions changed our results little.
The strategy of excluding early follow-up has been used in many studies to account for the potential effect of underlying disease. Some simulation studies have indicated that exclusion of the first few years of follow-up is not an effective way of dealing with confounding due to occult disease and that it may, in some circumstances, exacerbate this confounding (36–38). However, investigators from another simulation study concluded that under certain assumptions this method could be very effective (39). Nonetheless, although our results showed some changes in the magnitude of the relative risk estimates with exclusion of the first 5 years of follow-up, the main conclusions were unchanged.
The influence of age on the relation between BMI and mortality has not been widely studied, especially in the elderly. The few available studies suggest that the association between increased weight and higher mortality is primarily relevant for the younger elderly. A study with over 12 years of follow-up (23) found that greater BMI was associated with higher mortality only up to 75 years of age. Beyond age 75, increased BMI was associated with increased mortality only among men, and above age 85, low BMI was associated with higher mortality only among women. Another study with 14 years of follow-up found an association between high BMI and increased mortality at all ages, while low BMI was associated with mortality only among persons aged 75 years or more (15). In contrast, for all age groups in our study, the highest mortality was among underweight participants. Obese participants had increased mortality only among persons aged less than 75 years.
Many studies deal with the effect of smoking on the BMI-mortality relation by including it as a covariate in the analyses, while other studies analyze only nonsmokers. The authors of one report concluded that the association between BMI and all-cause mortality is present in both smokers and nonsmokers but the effects of underweight, overweight, and obesity may differ depending on smoking status (5). Another study found a positive linear association between BMI and mortality among never smokers but no association among recent former smokers or current smokers (35). We found increased mortality among the underweight regardless of smoking status, while mortality was increased in obese never and past smokers but not in current smokers. It is possible that the harmful effect of obesity is overshadowed by the harmful effect of smoking, so that obese smokers do not show higher mortality when compared with normal-weight smokers.
Although some studies have found differences in the BMI-mortality association for men and women (20, 27), our risk estimates for men and women were almost identical. The only difference was found when early follow-up was excluded, resulting in greater attenuation of the relative risk for underweight men than for underweight women.
Few studies have reported on the effects of being overweight or obese in early adulthood on all-cause mortality in later life. The available findings are consistent with our results showing increased mortality in the overweight or obese (29, 40, 41). Since our cohort was 73 years of age at entry, on average, most were aged 21 years during the 1920s and 1930s. The prevalence of overweight and obesity has greatly increased since then, especially in the past few decades (42). Even though the proportion of persons who were obese at age 21 in our study was smaller than the proportion of obese 21-year-olds today, we have no reason to believe that the observed associations should not apply to those who are aged 21 now. However, since our study included only people who survived to enter the retirement community, the effect of weight at age 21 on mortality in our study is limited to its effect in old age and does not reflect its effect on mortality between age 21 and age at entry.
While many studies of the association between weight change and all-cause mortality have been conducted, the results are difficult to compare among studies because of differences in the time period between the two weight measures, the length of follow-up, and how weight change is expressed. Increased mortality has been associated with weight loss in most studies of weight change (19, 26, 27, 43–50), but in other studies it has been associated with weight gain (24, 51, 52), both weight loss and extreme weight gain (35, 53–58), or neither (59, 60). In contrast to our findings, the few studies most similar to ours in terms of weight change over a long time period and follow-up periods of more than 20 years have mostly shown increased mortality with weight gain (24, 51, 52). The differences between those results and ours might be explained by the older age of our participants.
The benefit of gaining weight throughout life was reported in 1985 with the publication of tables of ideal weight (61), where the lowest mortality occurred at progressively increasing body weight with advancing age (5 kg per decade). Although our most consistent finding was that weight loss was associated with increased mortality, we also saw evidence of benefit with weight gain among persons who were underweight or of normal weight at age 21. The statistical significance of these findings, however, depended on whether or not adjustment was made for other confounders and on whether early follow-up was excluded.
When interpreting our results regarding weight change, it is important to note that we were able to evaluate only weight change between age 21 years and the age at which the questionnaire was completed (an average period of 52 years). We were unable to determine when the weight change occurred or to distinguish between gradual weight change and rapid weight change, fluctuating weight and relatively stable weight, and intentional weight change and unintentional weight change. All of these factors may be important in analysis of the effect of weight change on mortality (12, 44, 62).
Other limitations included the use of self-reported data on height and weight and recall of weight at age 21 years. The validity and reliability of such data are controversial. Although we previously found relatively good agreement (>90 percent) in this population between self-reported height and weight and height and weight obtained from medical records (8), some studies suggest that bias in reporting of height and weight varies with weight, such that overweight and obese persons are more likely to underreport their weight than normal- or underweight persons (63, 64). This underreporting would result in misclassification of participants when using standard weight categories. A strategy for dealing with this potential misclassification is to analyze ranked data such as quintiles. Although we did not report those results, we obtained very similar findings when the data were analyzed in quintiles: increased mortality among persons in the lowest and highest quintiles of BMI, with the highest mortality being seen among persons in the lowest quintile.
Despite its limitations, our large, population-based, long-term study of older adults with almost complete follow-up provides important information on the relations of weight and weight change to mortality in the elderly. We were able to adjust for several important confounding variables and to explore the modifying effects of smoking status, age, and gender. Our study highlights the risks on mortality in older age of being overweight or obese in young adulthood and underweight or obese in later life.
This research was funded by grants from the National Institutes of Health (R01CA32197 and R01AG21055), the Earl Carroll Trust Fund, and the Al and Trish Nichols Chair in Clinical Neuroscience.
Conflict of interest: none declared.
References
Heiat A, Vaccarino V, Krumholz HM. An evidence-based assessment of federal guidelines for overweight and obesity as they apply to elderly persons.
Flegal KM, Graubard BI, Williamson DF, et al. Excess deaths associated with underweight, overweight, and obesity.
Paganini-Hill A, Hsu G, Chao A, et al. Comparison of early and late respondents to a postal health survey questionnaire.
National Heart, Lung, and Blood Institute. Clinical guidelines on the identification, evaluation, and treatment of overweight and obesity in adults: the evidence report. Bethesda, MD: National Heart, Lung, and Blood Institute,
Katzmarzyk PT, Janssen I, Ardern CI. Physical inactivity, excess adiposity and premature mortality.
Manson JE, Stampfer MJ, Hennekens CH, et al. Body weight and longevity. A reassessment.
Ajani UA, Lotufo PA, Gaziano JM, et al. Body mass index and mortality among US male physicians.
Paganini-Hill A, Ross RK. Reliability of recall of drug usage and other health-related information.
Paganini-Hill A, Chao A, Ross RK, et al. Exercise and other factors in the prevention of hip fracture: The Leisure World Study.
Paganini-Hill A. Risk factors for Parkinson's disease: The Leisure World Cohort Study.
Zamboni M, Mazzali G, Zoico E, et al. Health consequences of obesity in the elderly: a review of four unresolved questions.
Lindsted KD, Singh PN. Body mass and 26-year risk of mortality among women who never smoked: findings from the Adventist Mortality Study.
Allison DB, Gallagher D, Heo M, et al. Body mass index and all-cause mortality among people age 70 and over: The Longitudinal Study of Aging.
Calle EE, Thun MJ, Petrelli JM, et al. Body-mass index and mortality in a prospective cohort of U.S. adults.
Singh PN, Lindsted KD, Fraser GE. Body weight and mortality among adults who never smoked.
Folsom AR, Kushi LH, Anderson KE, et al. Associations of general and abdominal obesity with multiple health outcomes in older women: The Iowa Women's Health Study.
Heitmann BL, Erikson H, Ellsinger BM, et al. Mortality associated with body fat, fat-free mass and body mass index among 60-year-old Swedish men—a 22-year follow-up. The study of men born in 1913.
Dey DK, Rothenberg E, Sundh V, et al. Body mass index, weight change and mortality in the elderly. A 15 y longitudinal population study of 70 y olds.
Lahmann PH, Lissner L, Gullberg B, et al. A prospective study of adiposity and all-cause mortality: The Malmo Diet and Cancer Study.
Engeland A, Bjorge T, Selmer RM, et al. Height and body mass index in relation to total mortality.
Bigaard J, Frederiksen K, Tjonneland A, et al. Body fat and fat-free mass and all-cause mortality.
Stevens J, Cai J, Pamuk ER, et al. The effect of age on the association between body-mass index and mortality.
Hu FB, Willett WC, Li T, et al. Adiposity as compared with physical activity in predicting mortality among women.
Harris T, Cook EF, Garrison R, et al. Body mass index and mortality among nonsmoking older persons. The Framingham Heart Study.
Cornoni-Huntley JC, Harris TB, Everett DF, et al. An overview of body weight of older persons, including the impact on mortality. The National Health and Nutrition Examination Survey I–Epidemiologic Follow-up Study.
Losonczy KG, Harris TB, Cornoni-Huntley J, et al. Does weight loss from middle age to old age explain the inverse weight mortality relation in old age?
Diehr P, Bild DE, Harris TB, et al. Body mass index and mortality in nonsmoking older adults: The Cardiovascular Health Study.
Bender R, Jockel KH, Trautner C, et al. Effect of age on excess mortality in obesity.
Kalmijn S, Curb JD, Rodriguez BL, et al. The association of body weight and anthropometry with mortality in elderly men: The Honolulu Heart Program.
Tayback M, Kumanyika S, Chee E. Body weight as a risk factor in the elderly.
Rissanen A, Heliovaara M, Knekt P, et al. Weight and mortality in Finnish men.
Menotti A, Kromhout D, Nissinen A, et al. Short-term all-cause mortality and its determinants in elderly male populations in Finland, the Netherlands, and Italy: The FINE Study. Finland, Italy, Netherlands Elderly Study.
Visscher TL, Seidell JC, Molarius A, et al. A comparison of body mass index, waist-hip ratio and waist circumference as predictors of all-cause mortality among the elderly: The Rotterdam Study.
Wannamethee SG, Shaper AG, Walker M. Weight change, body weight and mortality: the impact of smoking and ill health.
Allison DB, Faith MS, Heo M, et al. Meta-analysis of the effect of excluding early deaths on the estimated relationship between body mass index and mortality.
Allison DB, Heo M, Flanders DW, et al. Simulation study of the effects of excluding early deaths on risk factor-mortality analyses in the presence of confounding due to occult disease: the example of body mass index.
Allison DB, Heo M, Flanders DW, et al. Examination of “early mortality exclusion” as an approach to control for confounding by occult disease in epidemiologic studies of mortality risk factors.
Singh PN, Wang X. Simulation study of the effect of the early mortality exclusion on confounding of the exposure-mortality relation by preexisting disease.
Allebeck P, Bergh C. Height, body mass index and mortality: do social factors explain the association?
Jeffreys M, McCarron P, Gunnell D, et al. Body mass index in early and mid-adulthood, and subsequent mortality: a historical cohort study.
Flegal KM, Carroll MD, Kuczmarski RJ, et al. Overweight and obesity in the United States: prevalence and trends, 1960–1994.
Pamuk ER, Williamson DF, Madans J, et al. Weight loss and mortality in a national cohort of adults, 1971–1987.
Peters ET, Seidell JC, Menotti A, et al. Changes in body weight in relation to mortality in 6441 European middle-aged men: The Seven Countries Study.
Iribarren C, Sharp DS, Burchfiel CM, et al. Association of weight loss and weight fluctuation with mortality among Japanese American men.
Reynolds MW, Fredman L, Langenberg P, et al. Weight, weight change, mortality in a random sample of older community-dwelling women.
Newman AB, Yanez D, Harris T, et al. Weight change in old age and its association with mortality.
Wedick NM, Barrett-Connor E, Knoke JD, et al. The relationship between weight loss and all-cause mortality in older men and women with and without diabetes mellitus: The Rancho Bernardo Study.
Somes GW, Kritchevsky SB, Shorr RI, et al. Body mass index, weight change, and death in older adults: The Systolic Hypertension in the Elderly Program.
Droyvold WB, Lund Nilsen TI, Lydersen S, et al. Weight change and mortality: The Nord-Trondelag Health Study.
Hamm P, Shekelle RB, Stamler J. Large fluctuations in body weight during young adulthood and twenty-five-year risk of coronary death in men.
Strandberg TE, Strandberg A, Salomaa VV, et al. Impact of midlife weight change on mortality and quality of life in old age. Prospective cohort study.
Rhoads GG, Kagan A. The relation of coronary disease, stroke, and mortality to weight in youth and in middle age.
Rosengren A, Wedel H, Wilhelmsen L. Body weight and weight gain during adult life in men in relation to coronary heart disease and mortality. A prospective population study.
Dyer AR, Stamler J, Greenland P. Associations of weight change and weight variability with cardiovascular and all-cause mortality in the Chicago Western Electric Company Study.
Maru S, van der Schouw YT, Gimbrere CH, et al. Body mass index and short-term weight change in relation to mortality in Dutch women after age 50 y.
Schroll M. A longitudinal epidemiological survey of relative weight at age 25, 50 and 60 in the Glostrup population of men and women born in 1914.
Kuriyama S, Ohmori K, Miura C, et al. Body mass index and mortality in Japan: The Miyagi Cohort Study.
Andres R, Elahi D, Tobin JD, et al. Impact of age on weight goals.
Lissner L, Odell PM, D'Agostino RB, et al. Variability of body weight and health outcomes in the Framingham population.
Gunnell D, Berney L, Holland P, et al. How accurately are height, weight and leg length reported by the elderly, and how closely are they related to measurements recorded in childhood?

