


Abstract
Despite mounting evidence that sleep duration is a risk factor across diverse health and functional domains, little is known about the distribution and determinants of sleep. In 2003–2004, the authors used wrist activity monitoring and sleep logs to measure time in bed, sleep latency (time required to fall asleep), sleep duration, and sleep efficiency (percentage of time in bed spent sleeping) over 3 days for 669 participants at one of the four sites of the Coronary Artery Risk Development in Young Adults (CARDIA) study (Chicago, Illinois). Participants were aged 38–50 years, 58% were women, and 44% were Black. For the entire sample, mean time in bed was 7.5 (standard deviation (SD), 1.2) hours, mean sleep latency was 21.9 (SD, 29.0) minutes, mean sleep duration was 6.1 (SD, 1.2) hours, and mean sleep efficiency was 80.9 (SD, 11.3)%. All four parameters varied by race-sex group. Average sleep duration was 6.7 hours for White women, 6.1 hours for White men, 5.9 hours for Black women, and 5.1 hours for Black men. Race-sex differences (p < 0.001) remained after adjustment for socioeconomic, employment, household, and lifestyle factors and for apnea risk. Income was independently associated with sleep latency and efficiency. Sleep duration and quality, which have consequences for health, are strongly associated with race, sex, and socioeconomic status.
Sleep comprises approximately one third of a person's life. Historically, sleep duration has received relatively little attention in epidemiology. However, recent years have produced mounting evidence that sleep duration affects diverse health and functional domains. Much of the evidence comes from sleep laboratory studies. Such studies are carried out in well-controlled environments, with sleep hours precisely measured or restricted and with relatively small numbers of healthy volunteers. Studies have found that sleep facilitates the consolidation of memory and learning (1–5) and that sleep loss decreases performance and alters electroencephalogram activity patterns (6, 7). Sleep restriction can impair immune function (8–10) and may impair carbohydrate metabolism and increase heart-rate variability, a marker of sympathovagal balance (11). Sleep restriction also affects the hormones that regulate hunger (12–14).
Larger population-based studies have assessed sleep duration, sleepiness, or trouble sleeping primarily by self-report. Short sleep hours (≤5) have been associated with increased risk of motor vehicle accidents (15). Several studies have reported an association with body mass index: people who report less sleep weigh more (16–18). Persons who report poor-quality sleep or insomnia are at a high risk of psychiatric conditions, including depression and substance abuse (19–22). An association has been found with mortality. Although the associations are not entirely consistent across cohorts, sleep hours generally predict all-cause mortality in a U-shaped pattern, with both short and long self-reported hours increasing mortality risk (17, 23–27).
Given the potential impact of sleep duration on health, remarkably little is known about sleep duration and its determinants in the general population. Self-reports of usual sleep hours may not be particularly accurate. Although there have been excellent epidemiologic studies with objective measures of sleep, they have concentrated on sleep-disordered breathing or apnea and therefore used polysomnography, the “gold standard” for recording sleep. However, with polysomnography, the number of sensors attached to the participant might affect his or her usual bedtime, sleep latency (time required to fall asleep), and sleep hours, even when it is home based. In this study, we used wrist activity monitoring (actigraphy) and sleep logs over 3 nights to measure four sleep parameters: time in bed, sleep latency, total sleep duration, and sleep efficiency (ratio of sleep duration to time in bed, expressed as a percentage). Study subjects were persons in early middle age participating at one of the four Coronary Artery Risk Development in Young Adults (CARDIA) study sites. In this study, we examined whether these sleep parameters vary by demographic, socioeconomic, employment, household, and lifestyle factors.
MATERIALS AND METHODS
Study population
Our investigation was an ancillary to the CARDIA study, an ongoing, prospective, multicenter cohort study of the evolution of cardiovascular risk factors. The original CARDIA cohort was aged 18–30 years in 1985–1986 and was balanced by sex, race (Black and White), and education. A more detailed study description has been presented elsewhere (28). This ancillary study included participants from one of the four US CARDIA sites: Chicago, Illinois. Participants in the clinical examination in year 15 of CARDIA who were not then pregnant (total eligible, n = 814) were invited to participate in the sleep study in 2003 and 2004. All participants gave informed written consent; the protocol was approved by the institutional review boards of Northwestern University and the University of Chicago and by the CARDIA steering committee.
Measurements
Sleep measurements.
Sleep was measured by using wrist actigraphy in the home. Actiwatches (model AW-16; Mini Mitter, Inc., Bend, Oregon) were mailed to participants between May 2003 and July 2004. An Actiwatch looks like a wristwatch with a blank face. Using highly sensitive accelerometers, the watches digitally record an integrated measure of gross motor activity, which is analyzed to identify sleep periods. Participants were asked to wear the Actiwatch continuously (they are waterproof) for 3 days, Wednesday through Saturday, to include two weeknights and one weekend night. The Actiwatch model used has an event marker that the participant presses to record specific times; participants were asked to push the marker each night when they began trying to fall asleep and again when they got out of bed each morning. The event marker does not start or stop data recording. After 3 nights, participants returned the Actiwatch in a prepaid mailer. Data were downloaded and analyzed by using manufacturer-supplied software. Along with the Actiwatch, participants were sent a nightly log to record hours in bed (“Please report the time you get into bed and try to go to sleep (‘Bedtime’) and the time you got out of bed (‘Wake Time’) in the spaces provided. Write down the exact time, such as ‘11:37’ a.m./p.m.”). The sleep log provided backup data that could be manually added to the data file when participants forgot to press the event marker to record bedtime and wake time. The sleep log was modified partway through data collection to solicit information on naps, available for 331 of the 668 participants (49.6 percent).
Four sleep parameters were derived from the Actiwatch recording by using software algorithms supplemented by the sleep log, if necessary: total time in bed (beginning when the subject tried to fall asleep and ending when he or she got out of bed), sleep latency (how long it took to fall asleep initially), total sleep duration (excludes periods of wakefulness during the night), and sleep efficiency (the percentage of time in bed spent sleeping). A 3-day average was calculated for each parameter. Time in bed and duration were expressed in hours, latency in minutes, and efficiency as a percentage. Actiwatches have been validated against polysomnography, demonstrating a correlation in sleep duration from 0.82 for insomniacs to 0.97 for healthy subjects (29). The mean discrepancy ranges from 12 to 25 minutes (29); no consistent bias has been found among middle-aged subjects.
Self-reported sleep duration was collected at the same time as part of the Pittsburgh Sleep Quality Index questionnaire (30). Participants were asked, “During the past month, how many hours of actual sleep did you get at night? (This may be different than the number of hours you spend in bed.) On week days? On week-ends?”
Covariates.
Information on most of the covariates was collected during the year 15 CARDIA interview in 2000–2001.
Age at the time of sleep recording was calculated from date of birth and date of Actiwatch recording. Age was entered in the models as years older than age 35.
Race and sex information was collected at cohort initiation and was verified in 2000–2001.
Body mass index was calculated by dividing weight (in kilograms) by height squared (in meters). Height and weight were measured in 2000–2001. Body mass index was entered in the models as body mass index greater than 16 kg/m2.
Education as of 2000–2001 was a five-level ordinal variable: less than high school, high school graduate, some college, college graduate, more than college.
Income was a seven-level ordinal variable based on self-reported household income in 2000–2001. The lowest category was <$16,000 and the highest was ≥$100,000.
Alcohol consumption in 2000–2001 was considered the self-reported average number of drinks per week (wine, liquor, and beer), divided into quartiles and modeled as an ordinal variable.
Current smoker was defined as anyone who smoked at least five cigarettes per week almost every week, assessed in 2000–2001.
Physical activity in 2000–2001 was determined by using the CARDIA Physical Activity History that asks the frequency and intensity of 13 categories of sports and exercise over the past 12 months. The intensity, frequency, and duration of each activity are used to determine a total physical activity score in exercise units (31). The score was entered as a continuous variable.
Apnea risk was assessed at the time of actigraph measurement. We used the Berlin Questionnaire (32) to identify respondents at high risk of sleep apnea. A participant is classified as high risk if he or she has two of the three following conditions: 1) loud or frequent snoring or frequent breathing pauses, 2) being frequently tired after sleeping or during wake time or having fallen asleep while driving, and 3) having high blood pressure or a body mass index of >30 kg/m2.
Bed partner information was collected at the time of actigraph measurement. This information was derived from the Pittsburgh Sleep Quality Index questionnaire (30), which asks whether the respondent has a bed partner.
Shift workers are identified as those whose bedtime on any of the 3 days was between 6:00 a.m. and 5:00 p.m.
Employment status was assessed in 2000–2001. Respondents were categorized as full-time or part-time workers based on responses. The other categories (unemployed/laid off, looking for work, or keeping house full-time) were grouped together as “not employed.” Seven participants for whom responses to these questions were missing were classified as “missing employment.”
Number of children younger than age 18 years in the household at the time of actigraph measurement in 2003–2004 was estimated based on the 2000–2001 interview. Respondents were asked whether they had any children (one missing response) and the ages of their children (12 missing responses for those who indicated they had children). Respondents were then asked how many children lived with them. We calculated the number of children less than age 16 years and compared this sum with the total number of children in the home to calculate number of children less than age 16 years in 2000–2001 living with the respondent. When not all children lived with the respondent, we assumed that the younger children lived with the respondent.
Statistical analysis
Primary analyses divided the study population into four race-sex groups: White women, White men, Black women, and Black men, following previous CARDIA studies. Because there were questions about sleep in the year 15 CARDIA interview, we could assess response bias by comparing self-reported sleep hours and report of “trouble falling asleep” for participants and nonparticipants in the sleep study.
For each of the four sleep parameters, three multiple linear regression models were constructed. Model 1 included race-sex groups and age. Model 2 also included income. Model 3 included all of the previously described covariates. Models without constants were fitted so that beta coefficients representing the adjusted baseline value in the absence of covariate effects for all four race-sex groups were included. Equality of the beta coefficients for the four race-sex groups was tested with a partial F test. For the half of the sample for whom nap information was available, a confirmatory model for sleep duration including nap time was also constructed.
To further examine whether associations varied by race, in this paper we present race-specific models including all covariates and adjusted for sex. To test whether beta coefficients differed significantly by race, models were constructed with all observations so that interaction terms between race and each covariate could be tested. Each interaction term was tested in a separate model (e.g., a model including all of the covariates and the interaction term for education by race). All models also included an interaction between race and sex. These numerous interaction models are not fully presented here, but the significant interactions are marked in the presentation of the race-specific models. All tests of significance were two sided. All analyses were performed by using Stata release 8.0 software (33) and were repeated by using SAS software (SAS Institute, Inc., Cary, North Carolina) for verification by the CARDIA data coordination center.
RESULTS
A total of 669 of 814 eligible persons participated (82 percent) in this ancillary study. Answers to questions about sleep asked in the prior CARDIA interview were very similar for participants and nonparticipants: mean average number of self-reported sleep hours in the previous month was 6.5 for both groups. The percentages reporting trouble falling asleep were 19 for participants and 20 for nonparticipants. However, participation did vary by race (84 percent of Whites and 79 percent of Blacks) and by sex (86 percent of women and 77 percent of men).
Study sample characteristics are shown in table 1. Age ranged from 38 to 50 years at the time of sleep recording. All of the covariates varied by race-sex group. For household income, the majority of White men and women were in the highest category (≥$100,000), while the modal categories for Black men and women were lower. The modal education categories were college degree for White women, postgraduate for White men, and some college for Black men and women.
Characteristics of the study population from the Chicago, Illinois, site of the CARDIA cohort, 2000–2004
All (n = 669) | White women (n = 198) | White men (n = 177) | Black women (n = 187) | Black men (n = 107) | ||||||
|---|---|---|---|---|---|---|---|---|---|---|
| Mean (standard deviation) | ||||||||||
| Age (years) | 43.4 (3.63) | 43.8 (3.42) | 44.0 (3.33) | 42.7 (3.99) | 42.9 (3.62) | |||||
| Alcohol consumption (drinks/week) | 4.5 (8.8) | 3.7 (5.2) | 6.0 (8.4) | 2.2 (7.7) | 7.7 (14.0) | |||||
| Physical activity (exercise units) | 367 (295) | 382 (307) | 444 (283) | 220 (203) | 467 (331) | |||||
| Children aged <18 years in the household (no.) | 1.1 (1.2) | 1.3 (1.3) | 1.3 (1.3) | 0.9 (1.1) | 0.9 (1.1) | |||||
| Body mass index (kg/m2) | 28.4 (6.9) | 25.4 (6.0) | 27.7 (4.4) | 31.9 (8.4) | 28.6 (5.8) | |||||
| Frequency (%) | ||||||||||
| Education | ||||||||||
| <High school | 5.2 | 1.5 | 2.3 | 7.0 | 14.0 | |||||
| High school | 15.8 | 8.1 | 10.2 | 24.6 | 24.3 | |||||
| Some college | 27.8 | 17.2 | 17.5 | 43.9 | 36.5 | |||||
| College degree | 24.7 | 36.9 | 22.6 | 16.0 | 20.6 | |||||
| Postgraduate | 26.5 | 36.4 | 47.5 | 8.6 | 4.7 | |||||
| Income (US $) | ||||||||||
| <16,000 | 6.8 | 1.5 | 1.1 | 14.1 | 13.5 | |||||
| 16,000–24,999 | 5.9 | 2.6 | 1.7 | 14.1 | 4.8 | |||||
| 25,000–34,999 | 6.8 | 3.6 | 3.4 | 11.9 | 9.6 | |||||
| 35,000–49,999 | 14.5 | 9.2 | 9.0 | 21.6 | 21.2 | |||||
| 50,000–74,999 | 19.2 | 24.5 | 10.2 | 20.5 | 22.1 | |||||
| 75,000–99,999 | 12.8 | 7.7 | 20.3 | 10.3 | 14.4 | |||||
| ≥100,000 | 34.0 | 51.0 | 54.2 | 7.6 | 14.4 | |||||
| Employment | ||||||||||
| Full-time | 73.1 | 54.0 | 96.0 | 72.2 | 72.0 | |||||
| Part-time | 10.9 | 20.7 | 1.1 | 9.1 | 12.1 | |||||
| Not employed | 14.9 | 24.2 | 1.7 | 17.1 | 15.9 | |||||
| Data missing | 1.0 | 1.0 | 1.1 | 1.6 | 0 | |||||
| Shift worker | 3.7 | 1.5 | 4.0 | 5.0 | 5.0 | |||||
| Current smoker | 21.7 | 18.2 | 13.6 | 26.2 | 33.6 | |||||
| High risk of apnea | 14.2 | 9.6 | 8.5 | 23.0 | 16.8 | |||||
| Has a bed partner | 66.2 | 72.6 | 78.4 | 50.3 | 62.3 | |||||
Mean values by race-sex group for the sleep parameters are given in table 2. The number of observations was 647 for time in bed, sleep latency, and sleep efficiency because these parameters cannot be estimated without knowing the bedtime from either the event monitor or the sleep log: 22 of 669 participants did not use the event monitor or keep an adequate sleep log. One participant completed questionnaires but did not wear the Actiwatch, yielding 668 observations of sleep duration. Because only a minority of participants consistently used the event marker for all three bedtimes and three wake times, the sleep log was needed for 40 percent of bedtimes or wake times. When both the event marker and the sleep log were available, agreement was high, with 55 percent agreeing to the exact minute and 90 percent within 15 minutes.
Sleep characteristics* of the study population from the Chicago, Illinois, site of the CARDIA cohort, 2000–2004
All | White women | White men | Black women | Black men | |
|---|---|---|---|---|---|
| Time in bed (hours) | 7.51 (1.20) | 7.84 (0.97) | 7.34 (0.94) | 7.55 (1.43) | 7.10 (1.40) |
| Sleep latency (minutes) | 22.33 (30.21) | 13.30 (15.67) | 18.52 (23.22) | 28.36 (32.57) | 35.93 (46.96) |
| Sleep duration (hours) | 6.06 (1.23) | 6.71 (0.89) | 6.09 (1.13) | 5.90 (1.18) | 5.10 (1.30) |
| Sleep duration with naps (hours) | 6.13 (1.17) | 6.66 (0.87) | 6.25 (1.10) | 6.21 (0.96) | 5.25 (1.34) |
| Sleep efficiency (%) | 80.8 (11.3) | 85.7 (6.1) | 82.4 (9.12) | 78.2 (12.0) | 73.2 (15.4) |
| Self-reported sleep duration | |||||
| Weekdays (hours) | 6.65 (1.19) | 7.02 (1.0) | 6.78 (0.82) | 6.46 (1.41) | 6.05 (1.33) |
| Weekends (hours) | 7.26 (1.31) | 7.66 (1.05) | 7.38 (0.98) | 7.04 (1.52) | 6.72 (1.55) |
All values are given as mean (standard deviation).
Mean time in bed ranged from 7.8 hours for White women to 7.1 hours for Black men. For the other three parameters, ordering was parallel across race-sex groups, with White women obtaining the most sleep, followed by White men, Black women, and Black men. Mean sleep duration ranged from 6.7 hours for White women to 5.1 hours for Black men, while latency ranged from 13 minutes for White women to 36 minutes for Black men. Mean self-reported sleep duration reflected similar race-sex differences but was on average almost an hour longer than measured duration. Unadjusted associations between income and the sleep parameters are graphed in figure 1. Income appeared to be strongly associated with latency; persons having higher income experienced shorter latency. There also seemed to be gradients for duration and efficiency, with more sleep similarly associated with higher income.
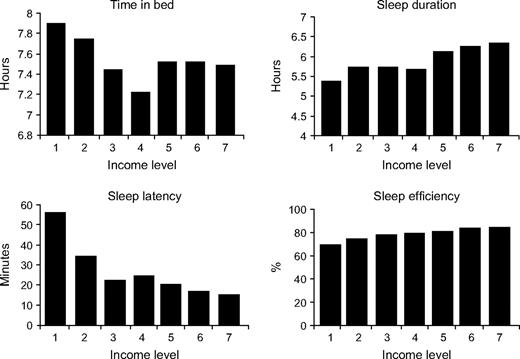
Mean values of four sleep variables for seven household-income-level groups (1 = <$16,000; 2 = $16,000–24,999; 3 = $25,000–34,999; 4 = $35,000–49,999; 5 = $50,000–74,999; 6 = $75,000–99,999; 7 = ≥$100,000) from the Chicago, Illinois, site of the CARDIA cohort, 2000–2004.
Tables 3–6 present the results of the multiple linear regression models for the four sleep parameters. When we adjusted for age only (model 1 in all four tables), there were significant differences by race-sex group for each of the sleep outcomes. In each instance, White women had mean sleep parameter values that were most advantageous for more sleep (longer time in bed, shorter latency, longer duration, and greater efficiency), and Black men had mean sleep parameters associated with the least sleep. The associations between race-sex groups remained similar for all four sleep parameters after adjustment for income (model 2 in all four tables) and for all covariates (model 3 in all four tables). When we adjusted for age only, the difference in mean sleep duration between White women and Black men was 1.63 hours (table 4, model 1). After we adjusted for all covariates, the difference was 1.36 hours (table 4, model 3). For the half of the sample for whom nap time was available, total sleep duration including naps showed similar race-sex variation: in the fully adjusted model, sleep duration was 6.85 hours for White women, 6.37 hours for White men, 6.52 hours for Black women, and 5.54 hours for Black men (data not shown). Over the limited age range observed, age was significantly associated with time in bed only, with increasing age associated with shorter time in bed.
Three different multiple linear regression models* predicting time in bed (hours) for participants from the Chicago, Illinois, site of the CARDIA cohort, 2000–2004
Model 1 | Model 2 | Model 3 | |||||||||||||
|---|---|---|---|---|---|---|---|---|---|---|---|---|---|---|---|
| β | 95% CI† | p value | β | 95% CI | p value | β | 95% CI | p value | |||||||
| White women | 8.15 | 7.88, 8.43 | 8.36 | 7.98, 8.73 | 8.36 | 7.83, 8.88 | |||||||||
| White men | 7.66 | 7.38, 7.95 | 7.87 | 7.48, 8.26 | 7.94 | 7.41, 8.47 | |||||||||
| Black women | 7.82 | 7.56, 8.09 | 7.94 | 7.64, 8.24 | 8.10 | 7.64, 8.56 | |||||||||
| Black men | 7.39 | 7.08, 7.70 | 7.49 | 7.14, 7.85 | 7.55 | 7.05, 8.05 | |||||||||
| Equality of race-sex groups | <0.001 | <0.001 | <0.001 | ||||||||||||
| Age (years)‡ | −0.04 | −0.06, −0.01 | 0.006 | −0.03 | −0.06, −0.01 | 0.01 | −0.03 | −0.06, −0.01 | 0.02 | ||||||
| Income‡ | −0.05 | −0.10, 0.01 | 0.12 | −0.04 | −0.11, 0.03 | 0.26 | |||||||||
| Education‡ | −0.06 | −0.16, 0.04 | 0.26 | ||||||||||||
| Employment | |||||||||||||||
| Full-time | Referent | ||||||||||||||
| Part-time | −0.02 | −0.34, 0.30 | 0.88 | ||||||||||||
| Not employed | 0.33 | 0.03, 0.63 | 0.03 | ||||||||||||
| Data missing | 0.46 | −0.48, 1.41 | 0.34 | ||||||||||||
| Shift worker | −0.54 | −1.05, −0.02 | 0.04 | ||||||||||||
| Body mass index (kg/m2)‡ | −0.01 | −0.03, 0.01 | 0.19 | ||||||||||||
| Alcohol consumption‡ | 0.12 | 0.04, 0.21 | 0.003 | ||||||||||||
| Current smoker | 0.05 | −0.20, 0.30 | 0.70 | ||||||||||||
| Activity level (exercise units) | −0.0002 | −0.0005, 0.0002 | 0.33 | ||||||||||||
| Apnea risk | −0.05 | −0.35, 0.24 | 0.72 | ||||||||||||
| Bed partner | 0.05 | −0.17, 0.28 | 0.66 | ||||||||||||
| Children aged <18 years in the household | 0.03 | −0.06, 0.11 | 0.56 | ||||||||||||
For a description of how the three models were constructed, refer to the Statistical Analysis section of the text.
CI, confidence interval.
Base level for age: 35 years; income: seven levels; education: five levels; base level for body mass index: 16 kg/m2; alcohol consumption: modeled as number of drinks per week divided into quartiles.
Three different multiple linear regression models* predicting actual sleep duration (hours) for participants from the Chicago, Illinois, site of the CARDIA cohort, 2000–2004
Model 1 | Model 2 | Model 3 | |||||||||||||
|---|---|---|---|---|---|---|---|---|---|---|---|---|---|---|---|
| β | 95% CI† | p value | β | 95% CI | p value | β | 95% CI | p value | |||||||
| White women | 6.86 | 6.60, 7.11 | 6.44 | 6.09, 6.78 | 6.46 | 5.97, 6.94 | |||||||||
| White men | 6.24 | 5.97, 6.51 | 5.79 | 5.43, 6.15 | 5.80 | 5.31, 6.28 | |||||||||
| Black women | 6.03 | 5.79, 6.27 | 5.80 | 5.53, 6.07 | 5.92 | 5.49, 6.34 | |||||||||
| Black men | 5.23 | 4.95, 5.51 | 4.92 | 4.60, 5.24 | 5.10 | 4.64, 5.56 | |||||||||
| Equality of race-sex groups | <0.001 | <0.001 | <0.001 | ||||||||||||
| Age (years)‡ | −0.02 | −0.04, 0.01 | 0.17 | −0.02 | −0.04, 0.003 | 0.09 | −0.02 | −0.04, 0.01 | 0.19 | ||||||
| Income‡ | 0.10 | 0.04, 0.15 | <0.001 | 0.03 | −0.03, 0.10 | 0.34 | |||||||||
| Education‡ | 0.06 | −0.04, 0.15 | 0.26 | ||||||||||||
| Employment | |||||||||||||||
| Full-time | Referent | ||||||||||||||
| Part-time | −0.05 | −0.35, 0.24 | 0.72 | ||||||||||||
| Not employed | 0.08 | −0.19, 0.35 | 0.56 | ||||||||||||
| Data missing | 0.29 | −0.59, 1.16 | 0.52 | ||||||||||||
| Shift worker | −0.21 | −0.66, 0.24 | 0.36 | ||||||||||||
| Body mass index (kg/m2)‡ | −0.01 | −0.02, 0.01 | 0.43 | ||||||||||||
| Alcohol consumption‡ | 0.05 | −0.02, 0.13 | 0.16 | ||||||||||||
| Current smoker | −0.27 | −0.51, −0.04 | 0.02 | ||||||||||||
| Activity level (exercise units) | −0.0001 | −0.0004, 0.0002 | 0.47 | ||||||||||||
| Apnea risk | −0.13 | −0.40, 0.14 | 0.35 | ||||||||||||
| Bed partner | 0.07 | −0.13, 0.28 | 0.49 | ||||||||||||
| Children aged <18 years in the household | 0.07 | −0.008, 0.15 | 0.08 | ||||||||||||
For a description of how the three models were constructed, refer to the Statistical Analysis section of the text.
CI, confidence interval.
Base level for age: 35 years; income: seven levels; education: five levels; base level for body mass index: 16 kg/m2; alcohol consumption: modeled as number of drinks per week divided into quartiles.
Three different multiple linear regression models* predicting sleep latency (minutes) for participants from the Chicago, Illinois, site of the CARDIA cohort, 2000–2004
Model 1 | Model 2 | Model 3 | |||||||||||||
|---|---|---|---|---|---|---|---|---|---|---|---|---|---|---|---|
| β | 95% CI† | p value | β | 95% CI | p value | β | 95% CI | p value | |||||||
| White women | 14.52 | 7.63, 21.41 | 34.65 | 25.67, 43.62 | 33.54 | 20.92, 46.16 | |||||||||
| White men | 19.77 | 12.66, 26.88 | 40.83 | 31.49, 50.18 | 41.36 | 28.65, 54.08 | |||||||||
| Black women | 29.44 | 22.94, 35.93 | 40.28 | 33.12, 47.43 | 41.25 | 30.17, 52.33 | |||||||||
| Black men | 37.07 | 29.37, 44.76 | 50.57 | 41.99, 59.15 | 48.20 | 36.16, 60.24 | |||||||||
| Equality of race-sex groups | <0.001 | <0.001 | <0.001 | ||||||||||||
| Age (years)‡ | −0.14 | −0.77, 0.49 | 0.66 | 0.13 | −0.49, 0.74 | 0.69 | −0.02 | −0.66, 0.62 | 0.95 | ||||||
| Income‡ | −4.65 | −6.03, −3.27 | <0.001 | −3.13 | −4.87, −1.39 | <0.001 | |||||||||
| Education‡ | −1.97 | −4.46, 0.52 | 0.12 | ||||||||||||
| Employment | |||||||||||||||
| Full-time | Referent | ||||||||||||||
| Part-time | 2.32 | −5.38, 10.02 | 0.55 | ||||||||||||
| Not employed | 5.04 | −2.09, 12.18 | 0.17 | ||||||||||||
| Data missing | 15.04 | −7.74, 37.81 | 0.20 | ||||||||||||
| Shift worker | −11.15 | −23.55, 1.25 | 0.08 | ||||||||||||
| Body mass index (kg/m2)‡ | −0.08 | −0.46, 0.30 | 0.68 | ||||||||||||
| Alcohol consumption‡ | 2.04 | 0.04, 4.04 | 0.05 | ||||||||||||
| Current smoker | 6.90 | 0.84, 12.95 | 0.03 | ||||||||||||
| Activity level (exercise units) | 0.002 | −0.006, 0.01 | 0.64 | ||||||||||||
| Apnea risk | −0.34 | −7.42, 6.74 | 0.93 | ||||||||||||
| Bed partner | −4.49 | −9.91, 0.92 | 0.10 | ||||||||||||
| Children aged <18 years in the household | −0.97 | −3.01, 1.06 | 0.35 | ||||||||||||
For a description of how the three models were constructed, refer to the Statistical Analysis section of the text.
CI, confidence interval.
Base level for age: 35 years; income: seven levels; education: five levels; base level for body mass index: 16 kg/m2; alcohol consumption: modeled as number of drinks per week divided into quartiles.
Three different multivariate linear regression models* predicting sleep efficiency (%) for participants from the Chicago, Illinois, site of the CARDIA cohort, 2000–2004
Model 1 | Model 2 | Model 3 | |||||||||||||
|---|---|---|---|---|---|---|---|---|---|---|---|---|---|---|---|
| β | 95% CI† | p value | β | 95% CI | p value | β | 95% CI | p value | |||||||
| White women | 84.67 | 82.20, 87.14 | 77.25 | 74.03, 80.46 | 77.48 | 73.01, 81.94 | |||||||||
| White men | 81.39 | 78.84, 83.94 | 73.64 | 70.30, 76.99 | 73.47 | 68.97, 77.97 | |||||||||
| Black women | 77.28 | 74.96, 79.61 | 73.26 | 70.70, 75.82 | 73.20 | 69.28, 77.12 | |||||||||
| Black men | 72.25 | 69.49, 75.01 | 67.17 | 64.10, 70.24 | 68.69 | 64.43, 72.95 | |||||||||
| Equality of race-sex groups | <0.001 | <0.001 | <0.001 | ||||||||||||
| Age (years)‡ | 0.12 | −0.11, 0.34 | 0.31 | 0.03 | −0.19, 0.25 | 0.80 | 0.10 | −0.12, 0.33 | 0.38 | ||||||
| Income‡ | 1.70 | 1.20, 2.19 | <0.001 | 0.79 | 0.18, 1.41 | 0.01 | |||||||||
| Education‡ | 1.27 | 0.39, 2.15 | 0.005 | ||||||||||||
| Employment | |||||||||||||||
| Full-time | Referent | ||||||||||||||
| Part-time | −0.14 | −2.87, 2.58 | 0.92 | ||||||||||||
| Not employed | −2.05 | −4.58, 0.47 | 0.11 | ||||||||||||
| Data missing | −0.76 | −8.82, 7.29 | 0.85 | ||||||||||||
| Shift worker | 0.44 | −3.95, 4.82 | 0.85 | ||||||||||||
| Body mass index (kg/m2)‡ | 0.01 | −0.12, 0.15 | 0.83 | ||||||||||||
| Alcohol consumption‡ | −0.66 | −1.37, 0.04 | 0.07 | ||||||||||||
| Current smoker | −4.04 | −6.18, −1.90 | <0.001 | ||||||||||||
| Activity level (exercise units) | 0.0005 | −0.002, 0.003 | 0.73 | ||||||||||||
| Apnea risk | −0.70 | −3.20, 1.81 | 0.58 | ||||||||||||
| Bed partner | 0.79 | −1.12, 2.71 | 0.42 | ||||||||||||
| Children aged <18 years in the household | 0.70 | −0.02, 1.42 | 0.06 | ||||||||||||
For a description of how the three models were constructed, refer to the Statistical Analysis section of the text.
CI, confidence interval.
Base level for age: 35 years; income: seven levels; education: five levels; base level for body mass index: 16 kg/m2; alcohol consumption: modeled as number of drinks per week divided into quartiles.
When income was the only additional covariate in the models (model 2 in tables 3–6), increasing levels of income were significantly associated with shorter latency, longer sleep duration, and greater efficiency, even though greater income was weakly associated with less time in bed. Moving from the lowest income category to the highest was associated with a reduction in latency of 28 minutes when just age and race-sex groups were included in the model (table 5, model 2) and of 15 minutes when all covariates were in the model (table 5, model 3). With all of the covariates in the model, including education, income remained significantly associated with latency and efficiency. More education was also significantly associated with greater efficiency. For sleep efficiency, moving from the lowest to the highest income categories represented 5 percent more of the time in bed spent sleeping, and moving from the lowest to the highest education categories independently represented another 5 percent more of the time in bed spent sleeping (table 6, model 3).
Increasing levels of alcohol consumption were associated with increased time in bed but longer sleep latency. Compared with current nonsmokers, current smokers had longer sleep latency and decreased sleep duration and efficiency. The only other significant associations were for time in bed (table 3), with shift workers spending less time in bed and those not employed more time in bed. Finally, there was no evidence that physical activity level or body mass index was associated with any of the sleep parameters.
Table 7 presents the regression coefficients from models stratified by race, and the section symbols (§) indicate the coefficients that differed significantly between race groups. Several significant interaction terms were found. In general, education and income effects were stronger for Blacks than for Whites, and in several instances were significantly greater. There was evidence of qualitative interaction for alcohol consumption, with greater alcohol consumption associated with shorter sleep latency for Whites and longer latency for Blacks; effects for sleep efficiency were parallel.
Race-specific multivariate linear regression models predicting four sleep parameters derived from wrist activity monitoring, including indications of significant differences in regression coefficients by race, for participants from the Chicago, Illinois, site of the CARDIA cohort, 2000–2004*
Whites | Blacks | |||||
|---|---|---|---|---|---|---|
| β for time in bed (hours) | 95% CI† | β for time in bed (hours) | 95% CI | |||
| Age (years)‡ | −0.02 | −0.05, 0.01 | −0.04 | −0.09, 0.002 | ||
| Women | 0.52 | 0.27, 0.76 | 0.64 | 0.24, 1.05 | ||
| Income‡ | 0.02 | −0.07, 0.10 | −0.07 | −0.20, 0.05 | ||
| Education‡ | −0.06 | −0.17, 0.06 | −0.13 | −0.32, 0.07 | ||
| Full-time employment | Referent | Referent | ||||
| Part-time employment | −0.08 | −0.44, 0.28 | 0.07 | −0.52, 0.66 | ||
| Not employed | 0.06§ | −0.30, 0.42 | 0.54§ | 0.02, 1.05 | ||
| Employment data missing | 0.75 | −0.22, 1.72 | −0.40 | −2.35, 1.55 | ||
| Alcohol consumption‡ | 0.08 | −0.01, 0.17 | 0.14 | −0.02, 0.31 | ||
| Current smoker | −0.17 | −0.47, 0.12 | 0.14 | −0.30, 0.58 | ||
| Activity level (exercise units) | −0.0002 | −0.001, 0.0001 | 0.00003 | −0.001, 0.001 | ||
| Body mass index (kg/m2)‡ | −0.01 | −0.03, 0.01 | −0.01 | −0.04, 0.01 | ||
| Shift worker | 0.06§ | −0.55, 0.68 | −1.34§ | −2.21, −0.47 | ||
| Apnea risk | −0.05 | −0.45, 0.36 | −0.16 | −0.61, 0.28 | ||
| Bed partner | 0.005 | −0.26, 0.27 | 0.03 | −0.36, 0.42 | ||
| Children aged <18 years in the household | −0.03§ | −0.12, 0.06 | 0.21§ | 0.04, 0.38 | ||
| Constant | 7.74 | 7.12, 8.35 | 7.59 | 6.77, 8.42 | ||
β for sleep duration (hours) | 95% CI | β for sleep duration (hours) | 95% CI | |||
| Age (years)‡ | −0.02 | −0.05, 0.01 | −0.01 | −0.05, 0.03 | ||
| Women | 0.68 | 0.44, 0.93 | 0.77 | 0.41, 1.13 | ||
| Income‡ | 0.02 | −0.06, 0.11 | 0.03 | −0.08, 0.14 | ||
| Education‡ | 0.003 | −0.11, 0.11 | 0.11 | −0.06, 0.29 | ||
| Full-time employment | Referent | Referent | ||||
| Part-time employment | −0.06 | −0.42, 0.30 | 0.06 | −0.46, 0.58 | ||
| Not employed | 0.22 | −0.14, 0.58 | 0.06 | −0.40, 0.51 | ||
| Employment data missing | 0.50 | −0.46, 1.46 | −0.28 | −2.02, 1.47 | ||
| Alcohol consumption‡ | 0.11 | 0.02, 0.20 | −0.02 | −0.16, 0.12 | ||
| Current smoker | −0.39 | −0.68, −0.10 | −0.11 | −0.50, 0.28 | ||
| Activity level (exercise units) | −0.00004 | −0.0004, 0.0003 | −0.0002 | −0.001, 0.0004 | ||
| Body mass index (kg/m2)‡ | −0.001 | −0.02, 0.02 | −0.01 | −0.03, 0.01 | ||
| Shift worker | 0.10 | −0.51, 0.71 | −0.56 | −1.26, 0.13 | ||
| Apnea risk | −0.07 | −0.47, 0.33 | −0.20 | −0.60, 0.19 | ||
| Bed partner | 0.15 | −0.11, 0.42 | −0.03 | −0.38, 0.31 | ||
| Children aged <18 years in the household | 0.01 | −0.08, 0.10 | 0.18 | 0.03, 0.33 | ||
| Constant | 5.84 | 5.23, 6.45 | 5.05 | 4.32, 5.78 | ||
β for sleep latency (minutes) | 95% CI | β for sleep latency (minutes) | 95% CI | |||
| Age (years)‡ | 0.28 | −0.35, 0.91 | −0.47 | −1.67, 0.73 | ||
| Women | −7.88 | −12.82, −2.93 | −2.80 | −13.46, 7.86 | ||
| Income‡ | −1.10§ | −2.83, 0.63 | −4.57§ | −7.83, −1.30 | ||
| Education‡ | −0.52§ | −2.77, 1.73 | −4.67§ | −9.84, 0.51 | ||
| Full-time employment | Referent | Referent | ||||
| Part-time employment | 2.55 | −4.75, 9.86 | −0.92 | −16.36, 14.51 | ||
| Not employed | −0.44 | −7.68, 6.79 | 3.31 | −10.15, 16.78 | ||
| Employment data missing | 12.66 | −6.80, 32.12 | 17.80 | −33.14, 68.73 | ||
| Alcohol consumption‡ | −2.31§ | −4.13, −0.49 | 7.52§ | 3.27, 11.77 | ||
| Current smoker | 6.44 | 0.50, 12.38 | 1.77 | −9.67, 13.21 | ||
| Activity level (exercise units) | 0.00003 | −0.007, 0.007 | 0.004 | −0.01, 0.02 | ||
| Body mass index (kg/m2)‡ | −0.29 | −0.74, 0.16 | 0.03 | −0.58, 0.63 | ||
| Shift worker | −3.84 | −16.21, 8.54 | −17.78 | −40.51, 4.94 | ||
| Apnea risk | 0.35 | −7.75, 8.44 | −1.27 | −12.92, 10.37 | ||
| Bed partner | −7.08 | −12.39, −1.77 | −1.27 | −11.38, 8.83 | ||
| Children aged <18 years in the household | −0.46 | −2.27, 1.36 | −0.75 | −5.20, 3.70 | ||
| Constant | 35.68 | 23.34, 48.01 | 51.93 | 30.36, 73.50 | ||
β for sleep efficiency (%) | 95% CI | β for sleep efficiency (%) | 95% CI | |||
| Age (years)‡ | −0.02 | −0.27, 0.22 | 0.24 | −0.17, 0.65 | ||
| Women | 3.64 | 1.73, 5.54 | 3.07 | −0.55, 6.68 | ||
| Income‡ | 0.12§ | −0.55, 0.78 | 1.18§ | 0.07, 2.29 | ||
| Education‡ | 0.65§ | −0.22, 1.51 | 2.42§ | 0.66, 4.18 | ||
| Full-time employment | Referent | Referent | ||||
| Part-time employment | −0.44 | −3.26, 2.37 | 1.54 | −3.69, 6.77 | ||
| Not employed | 1.90§ | −0.90, 4.69 | −3.80§ | −8.37, 0.77 | ||
| Employment data missing | −1.28 | −8.79, 6.23 | 1.33 | −15.94, 18.60 | ||
| Alcohol consumption‡ | 0.55§ | −0.15, 1.25 | −1.88§ | −3.32, −0.44 | ||
| Current smoker | −3.09 | −5.38, −0.79 | −3.37 | −7.25, 0.51 | ||
| Activity level (exercise units) | 0.002 | −0.001, 0.005 | −0.002 | −0.008, 0.004 | ||
| Body mass index (kg/m2)‡ | 0.10 | −0.08, 0.27 | −0.04 | −0.24, 0.17 | ||
| Shift worker | 0.46 | −4.32, 5.23 | 0.83 | −6.88, 8.54 | ||
| Apnea risk | −0.72 | −3.85, 2.40 | −0.35 | −4.30, 3.60 | ||
| Bed partner | 2.14 | 0.09, 4.19 | −0.46 | −3.89, 2.97 | ||
| Children aged <18 years in the household | 0.47 | −0.23, 1.17 | 0.58 | −0.93, 2.09 | ||
| Constant | 75.33 | 70.57, 80.09 | 68.32 | 61.01, 75.64 | ||
All listed covariates were included in each model.
CI, confidence interval.
Base level for age: 35 years; income: seven levels; education: five levels; alcohol consumption: modeled as number of drinks per week divided into quartiles; base level for body mass index: 16 kg/m2.
Indicates that the regression coefficients differed significantly by race, from additional regression models including both Whites and Blacks (models not shown).
DISCUSSION
We found significant variation in objectively measured sleep parameters by race, sex, and income. Although mean time in bed was 7.5 hours, mean sleep duration was only 6.1 hours. Average sleep duration ranged from 6.7 hours for White women to 5.1 hours for Black men, with parallel disparities for the other sleep parameters. Even after we adjusted for socioeconomic, employment, household, and lifestyle factors, Black men in the sample slept on average 82 minutes less per night than White women did. For White men and Black women, sleep duration was intermediate. These disparities in sleep duration in part reflect time in bed and in part reflect difficulty falling and staying asleep. Socioeconomic status (either education or income) was only weakly associated with how long people spent in bed (intending to sleep), and the direction of the association showed that people with more income and education spent less time in bed. However, people with less income took significantly longer to fall asleep and slept less despite similar or more time spent in bed.
Three lifestyle factors that are risk factors for many chronic diseases were examined in this study: alcohol consumption, smoking, and physical activity. Although alcohol consumption was associated with longer time in bed, it was also associated with less efficiency; therefore, there was no net effect on sleep duration. However, we found evidence of heterogeneity of effects by race, which may be related to unmeasured differences in timing of drinking or binge drinking. Smoking did not affect time in bed but was associated with longer sleep latency and lower sleep efficiency. As a result, smokers had a shorter total sleep duration. Physical activity was not associated with any of the sleep parameters in this study. The association of difficulty falling and staying asleep with smoking was consistent with previous reports; the mechanism is hypothesized to be the stimulatory effects of nicotine (34). Standard sleep hygiene guidelines recommend avoiding alcohol and physical exercise in the hours right before bed, but they recommend physical activity earlier in the day. Timing of alcohol consumption and physical activity was not available from these data.
Over the past 50 years, studies that included polysomnography of healthy individuals have primarily characterized sleep architecture (e.g., rapid eye movement sleep), but they have also reported duration. In a study from the 1970s, mean sleep duration was 7.1 hours for persons aged 30–39 years (n = 20) and 6.8 hours for persons aged 40–49 years (n = 21) (35). A meta-analysis of 65 generally small studies published between 1960 and 2003 summarized the relation between age and sleep duration (36). In those that included persons aged 35–50 years, duration ranged from about 5.4 hours to 7.8 hours. More recently, the Sleep Heart Health Study used a single night of in-home polysomnography to measure sleep apnea in ongoing cohort studies. Among 2,685 participants whose mean age was 62 years, average sleep time was 6.05 hours for women and 5.74 hours for men (37). A substudy of participants free of comorbidities that might affect sleep reported a mean sleep duration of 6.5 hours for 104 women aged 40–54 years and 6.1 hours for 53 men aged 40–54 years (38). To summarize, these previous studies have generally reported longer mean sleep durations than we found, although durations were similar to those for our White sample. Possible explanations for these differences include study population, secular trends, and differences in the measurement modes.
The data most comparable to ours were derived from a series of 273 population-based volunteers aged 40–60 years in San Diego, California, whose sleep was also measured with wrist actigraphy in 1990–1994 (39). The study sample was 77 percent non-Hispanic White and 23 percent minority (a heterogeneous group of Hispanics, Blacks, Asians, and others). Mean sleep duration was 6.2 hours, and mean time in bed was 7.5 hours (calculated from the data presented). Mean sleep latency was 11 minutes, and mean sleep efficiency was 83 percent. Time in bed was similar to that found in this study, while sleep latency was shorter and sleep duration somewhat longer. There were significant race and gender differences. Compared with men, women had more time in bed and longer sleep duration. Compared with the minority group, Whites had shorter sleep latency and greater sleep duration and efficiency. These authors' findings, therefore, are generally similar to those in our study.
We found that actigraph-measured duration was shorter than self-reported sleep duration. This conclusion was also reached in the Sleep Heart Health Study, where healthy participants reported sleeping on average about an hour longer than measured sleep duration (38). Further work is needed to understand the relation between self-reported and measured sleep duration.
There are limitations to our data. Wrist actigraphy does not perfectly measure sleep hours when compared with the gold standard of polysomnography. However, the advantage of actigraphy is that it is unlikely to actually affect bedtime, sleep latency, and duration. Actigraphy may underestimate sleep time for persons with a disorder of sleep fragmentation such as sleep apnea. However, we carried out a sensitivity analysis in which we included only those persons at low risk of apnea, and the race-sex differences were similar to those in the full sample. There does not seem to be a consistent bias for actigraphy versus polysomnography. It is possible that participants changed their usual sleep habits during the observation period, although it is not clear what the direction of the effect would be.
Selection issues may affect generalizability from the CARDIA study in general, in that participants both consented to be a part of CARDIA and then stayed in that study for 15 years. However, additional participation in the ancillary sleep study did not appear to be related to self-perceptions of sleep hours or sleep difficulty. Income, smoking, physical activity, and alcohol consumption were measured 2–3 years before sleep was, which is both an advantage and a disadvantage. Short-term variations in lifestyle could not be a response to sleep problems; however, income and lifestyle factors may have changed in the intervening years. Education and income may not fully capture socioeconomic confounding of race-sex effects, and we may have omitted confounders, such as chronic conditions. However, additional adjustment with indicator variables for self-report of current asthma and for a high count of depressive symptoms did not confound the race-sex effects (data not shown). The presence of children in the household was also based on data collected previously and would not have included children born since the last CARDIA examination. Apnea risk was approximated by using the Berlin Questionnaire.
The race, sex, and income gradients in sleep revealed by these data evoke gradients identified across many health domains, including all-cause mortality. Reasons for socioeconomic disparities in sleep could relate to psychosocial factors, health factors, or the physical environment. With mounting evidence of health effects of sleep duration, this study is consistent with sleep being on the causal pathway between socioeconomic status (or race) and disease risk. However, the strong associations we found between sleep duration, income, and race also raise questions about some prior studies that found associations between sleep duration and health outcomes (e.g., obesity or mortality). If analyses do not adjust for socioeconomic status and race, the magnitude of sleep effects may be overestimated.
This study revealed large disparities by race, sex, and income in sleep latency, efficiency, and duration. As the health consequences of sleep are more fully elucidated, sleep may prove to play a role in the associations between socioeconomic status, race, and health.
Editor's note:An invited commentary on this article appears on page , and the authors' response is published on page .
Research for this study was supported by grant AG 11412 from the National Institute on Aging. CARDIA is supported by US Public Health Service contracts NO1-HC-48047, NO1-HC-48048, NO1-HC-48049, NO1-HC-48050, and NO1-HC-95095 from the National Heart, Lung, and Blood Institute.
Conflict of interest: none declared.
References
Karni A, Tanne D, Rubenstein BS, et al. Dependence on REM sleep of overnight improvement of a perceptual skill.
Wilson MA, McNaughton BL. Reactivation of hippocampal ensemble memories during sleep.
Kuriyama K, Stickgold R, Walker M. Sleep-dependent learning and motor-skill complexity.
Bonnet M. Sleep deprivation. In: Kryger M, Roth T, Dement WC, eds. Principles and practices of sleep medicine. Philadelphia, PA: W B Saunders,
Belenky G, Wesensten NJ, Thorne DR, et al. Patterns of performance degradation and restoration during sleep restriction and subsequent recovery: a sleep dose-response study.
Krueger JM, Floyd RA, Fang J. Relationships between sleep and immune function. In: Turek FW, Zee PC, eds. Regulation of sleep and circadian rhythms. New York, NY: Marcel Dekker,
Spiegel K, Leproult R, Van Cauter E. Impact of sleep debt on metabolic and endocrine function.
Taheri S, Lin L, Austin D, et al. Short sleep duration is associated with reduced leptin, elevated ghrelin, and increased body mass index.
Spiegel K, Leproult R, L'Hermite-Baleriaux M, et al. Leptin levels are dependent on sleep duration: relationships with sympathovagal balance, carbohydrate regulation, cortisol, and thyrotropin.
Spiegel K, Tasali E, Penev P, et al. Sleep curtailment in healthy young men is associated with decreased leptin levels, elevated ghrelin levels and increased hunger and appetite.
Connor J, Norton R, Ameratunga S, et al. Driver sleepiness and risk of serious injury to car occupants: population based case control study.
Vioque J, Torres A, Quiles J. Time spent watching television, sleep duration and obesity in adults living in Valencia, Spain.
Kripke DF, Garfinkel L, Wingard DL, et al. Mortality associated with sleep duration and insomnia.
Hasler G, Buysse D, Klaghofer R, et al. The association between short sleep duration and obesity in young adults: a 13-year prospective study.
Ford D, Cooper-Patrick L. Sleep disturbances and mood disorders: an epidemiologic perspective.
Crum RM, Storr CL, Chan YF, et al. Sleep disturbance and risk for alcohol-related problems.
Doi Y, Minowa M, Uchiyama M, et al. Psychometric assessment of subjective sleep quality using the Japanese version of the Pittsburgh Sleep Quality Index (PSQI-J) in psychiatric disordered and control subjects.
Drake CL, Roehrs T, Roth T. Insomnia causes, consequences, and therapeutics: an overview.
Wingard DL, Berkman LF. Mortality risk associated with sleeping patterns among adults.
Kojima M, Wakai K, Kawamura T, et al. Sleep patterns and total mortality: a 12-year follow-up study in Japan.
Heslop P, Smith G, Metcalfe C, et al. Sleep duration and mortality: the effect of short or long sleep duration on cardiovascular and all-cause mortality in working men and women.
Tamakoshi A, Ohno Y. Self-reported sleep duration as a predictor of all-cause mortality: results from the JACC Study, Japan.
Patel SR, Ayas NT, Malhotra MR, et al. A prospective study of sleep duration and mortality risk in women.
Friedman GD, Cutter GR, Donahue RP, et al. CARDIA: study design, recruitment, and some characteristics of the examined subjects.
Jean-Louis G, von Gizycki H, Zizi F, et al. The actigraph data analysis software: I. A novel approach to scoring and interpreting sleep-wake activity.
Buysse DJ, Reynolds CF III, Monk TH, et al. The Pittsburgh Sleep Quality Index: a new instrument for psychiatric practice and research.
Bild DE, Jacobs DR Jr, Sidney S, et al. Physical activity in young black and white women. The CARDIA Study.
Netzer N, Stoohs R, Netzer C, et al. Using the Berlin Questionnaire to identify patients at risk for the sleep apnea syndrome.
Stata Corporation. Stata statistical software, release 8.0. College Station, TX: Stata Corporation,
Htoo A, Talwar A, Feinsilver SH, et al. Smoking and sleep disorders.
Williams RL, Karacan I, Hursch CJ. EEG of human sleep: clinical applications. New York, NY: John Wiley & Sons,
Ohayon MM, Carskadon MA, Guilleminault C, et al. Meta-analysis of quantitative sleep parameters from childhood to old age in healthy individuals: developing normative sleep values across the human lifespan.
Redline S, Kirchner HL, Quan SF, et al. The effects of age, sex, ethnicity, and sleep-disordered breathing on sleep architecture.
Walsleben JA, Kapur VK, Newman AB, et al. Sleep and reported daytime sleepiness in normal subjects: the Sleep Heart Health Study.

