


Abstract
The estimation of transmission parameters has been problematic for diseases that rely predominantly on transmission of pathogens from person to person through small infectious droplets. Age-specific transmission parameters determine how such respiratory agents will spread among different age groups in a human population. Estimating the values of these parameters is essential in planning an effective response to potentially devastating pandemics of smallpox or influenza and in designing control strategies for diseases such as measles or mumps. In this study, the authors estimated age-specific transmission parameters by augmenting infectious disease data with auxiliary data on self-reported numbers of conversational partners per person. They show that models that use transmission parameters based on these self-reported social contacts are better able to capture the observed patterns of infection of endemically circulating mumps, as well as observed patterns of spread of pandemic influenza. The estimated age-specific transmission parameters suggested that school-aged children and young adults will experience the highest incidence of infection and will contribute most to further spread of infections during the initial phase of an emerging respiratory-spread epidemic in a completely susceptible population. These findings have important implications for controlling future outbreaks of novel respiratory-spread infectious agents.
Pandemic influenza, smallpox, and pneumonic plague are transmitted predominantly from person to person through small infectious respiratory droplets (1). These diseases have the potential to cause devastating epidemics, and planning an effective response to such epidemics requires knowledge of the pattern of spread through the population (2–6). Essential to understanding the pattern of spread is the estimation of age-specific transmission parameters for each of these diseases (5). Estimating the required transmission parameters for a modern industrialized population is difficult, because diseases like pandemic influenza, smallpox, and pneumonic plague have not been circulating within the population for decades.
Estimating the age-specific transmission parameters is problematic even for other respiratory-spread agents that circulate endemically within the population. Difficulties arise because we have more unknown age-specific transmission parameters than observations on risk of infection for each age class, and as a consequence we face an indeterminacy problem (7–9). Often, a-priori assumptions about the contact processes are invoked to reduce the number of unknowns to the number of age classes. The simplest such transmission hypothesis is homogeneous mixing: Each individual has an equal chance of contacting any other individual in the population. A slightly more realistic transmission hypothesis is proportionate mixing: The rate at which individuals make such random contacts depends on their age class (10, 11). Other transmission hypotheses rely on specifying a structure for the transmission rates that involves one parameter per age class; the different structures are often referred to as “who acquires infection from whom” configurations (8, 12).
To overcome the problems with estimating age-specific transmission parameters, we could infer likely contact patterns from age distributions and household sizes obtained from census data (2, 4, 13, 14) and from transportation data (15). Alternatively, likely patterns of contact can be derived from the self-reported social behavior of individuals (16–18). These approaches suggest that individuals tend to make most of their contacts with other persons of a similar age (19). However, none of these patterns of social contact have been tested against alternatives for their capability to describe observed patterns of infection.
One of the most promising methods for approximating the relative magnitude of age-specific transmission rates is asking people how frequently they experience some proxy measure for such at-risk events at which infection can be transmitted. Face-to-face conversation might be an appropriate proxy measure for exposure to infectious respiratory-spread agents (18). The idea is that both talking to someone and exposing someone to infectious respiratory-spread agents requires spatial proximity of the persons involved. Therefore, it is reasonable to assume that the age distribution of the conversational contacts is related in one way or another to the age distribution of exposed individuals (19). The simplest such relation is that both age distributions differ by only a proportionality factor. We will refer to this transmission hypothesis as the “social contact hypothesis.”
In this paper, we present age-specific numbers of different conversational contacts that were obtained from a large population study carried out in the Netherlands. We used these data to test the social contact hypothesis against alternative transmission hypotheses, such as homogeneous mixing and proportionate mixing. We show that models that use transmission rates based on self-reported social contacts are best able to capture observed patterns of infection for respiratory-spread agents such as mumps and pandemic influenza. In addition, we use simulations to explore the initial spread of emerging respiratory-spread agents among age groups in a completely susceptible population, and we suggest approaches to planning for intervention measures against such newly emerging infections.
MATERIALS AND METHODS
Data
Information on social contacts was obtained in a large cross-sectional survey conducted in the town of Utrecht, the Netherlands, in 1986 (20). The survey participants were randomly selected from population records, excluding persons younger than 1 year of age. Participants were sent a written invitation for a face-to-face interview. If necessary, respondents or their parents were visited at home and approached in another language than Dutch. During the interviews, the participants reported their own age and were asked about the number of persons in their household, excluding themselves, and the number of different persons they conversed with during a typical week, excluding household members, specified for six age classes: 0–5, 6–12, 13–19, 20–39, 40–59, and ≥60 years. For each participant, we added the answers to both questions to obtain the age-specific number of different conversation partners the participant encountered during a typical week. Incomplete or inconsistent answers were excluded from further analysis. Of the 3,084 invited participants, 2,106 responded and completed a questionnaire, of which 1,813 (59 percent of the invited participants) met the criteria for further analysis (20).
The participants in this survey were also screened for antibodies against mumps. Since the survey was conducted just before the introduction of routine vaccination with a combined measles-mumps-rubella vaccine, the presence of immunizing antibodies against mumps provided an unambiguous indication of past infection with endemically circulating mumps virus. Of the 2,106 respondents, 1,859 (60 percent of the invited participants) gave serum samples that could be screened for mumps-specific antibodies by enzyme-linked immunosorbent assay (20, 21).
We assessed the direction of potential nonresponse bias in the self-reported number of social contacts by comparing the results for Utrecht with the results of a similar study conducted in Nijmegen, the Netherlands, in 1986. In Nijmegen, a questionnaire was sent by mail to participants. Of the 5,000 persons invited to participate, 1,493 (30 percent) filled out the questionnaire and returned answers that met the criteria for further analysis (20).
Age-specific attack rates during an influenza pandemic were obtained from a family study carried out in a US city, Cleveland, Ohio, in 1957 (22). Serum was collected in the spring of 1957. The “Asian influenza” pandemic had passed through the community during a period of 8 weeks, with a peak in October 1957. Serum was collected again at the end of 1957. The collected sera were tested for the presence of antibodies against the specific influenza strain by complement fixation and a hemagglutinin-inhibition test; a fourfold or greater increase in titer in at least one of those tests was used as an indicator of infection (22). We used information on 128 participants, after excluding vaccinated participants and adults (the results on adults were not representative because the study was aimed at households with children).
Estimation of age-specific social contacts
We arranged the mean numbers of self-reported conversational partners by age classes in a “social contact matrix” M. Each matrix element, mij, gives the mean number of conversational partners per week in age class i as reported by a participant in age class j. For estimation of the matrix elements mij, we must take the reciprocal nature of conversational contacts into account (23). At the individual level, this means that if John has a conversation with Mary, Mary must also have a conversation with John. At the population level, it means that the total number of contacts from age class j to age class i must be equal to the total number of contacts from age class i to age class j. If we have wi individuals in age class i and wj individuals in age class j, reciprocity thus requires that mijwj = mjiwi. We estimate the mean number of self-reported conversation partners mij from the reported contacts from age class i to age class j and the reported contacts from j to i using the method of maximum likelihood (see Appendix).
Estimation of age-specific transmission parameters
The social contact hypothesis implies that the age-specific number of potentially infectious contacts is proportional to the self-reported age-specific number of social contacts; we assume that within age classes, individuals are contacted at random. The proportionality factor measures the disease-specific infectivity and is indicated by q. The age-specific numbers of potential transmission events per person are described by a matrix N = (nij) = (qmij). This matrix N is called the “next generation matrix” in infectious disease epidemiology (24, 25). The basic reproduction number R0, defined as the number of secondary cases produced by a typical infectious person during his or her entire infectious period in an entirely susceptible population, is given by the largest eigenvalue of this next generation matrix (24, 25).
The next generation matrix N = (qmij) determines uniquely what the transmission rates are between age classes and how the risk of infection varies over age classes (see Appendix). In endemic equilibrium, as for mumps before the introduction of routine vaccination, the next generation matrix N determines the age-specific hazard rate of infection or the “force of infection” (9, 11, 25). During an epidemic in a susceptible population, as for an influenza pandemic, the next generation matrix N determines the age-specific infection attack rates (25). We keep mij fixed at the maximum likelihood value and search for a value of the infectivity parameter q that maximizes the log-likelihood of observing the age-specific proportion of persons immune to mumps in Utrecht, the Netherlands, in 1986 and the age-specific proportion of persons immune to pandemic influenza in Cleveland, Ohio, in 1957 (see Appendix).
Statistical testing of transmission hypotheses against serologic data
We compare the hypothesis that the age-specific numbers of potentially infectious contacts are proportional to age-specific numbers of social contacts (the “social contact hypothesis”) with two available alternative hypotheses. The first alternative is the “homogeneous mixing hypothesis,” which states that contacts occur at random. This hypothesis implies one free parameter: the overall contact rate. The second alternative is the “proportionate mixing hypothesis,” which states that the rates for making contact are specific to each age class. This hypothesis implies six free parameters: the contact rates for each of the six age classes. Transmission hypotheses that rely on “who acquires infection from whom” configurations have the same number of parameters as the proportionate mixing hypothesis and will give, at best, the same value for the maximum log-likelihood (9, 12). Those hypotheses need not be considered here.
For all three transmission hypotheses, we calculate the maximum log-likelihood of the serologic observations (see Appendix). The Bayesian Information Criterion (BIC) (26) is used to compare the three hypotheses. This criterion corrects the maximized log-likelihood values for the number of free parameters and the number of observations. The scale of the BIC is similar to that of the more familiar deviance statistic: A difference in BIC between 5 and 10 indicates strong evidence, and a difference larger than 10 indicates decisive evidence in favor of the hypothesis with the lowest BIC.
Simulating the initial spread of an epidemic in a completely susceptible population
We use the age-specific pattern of social contacts to explore how a new infection would spread in an entirely susceptible population. For any value of the disease-specific infectivity q, and for any age class of the index case, we can use the next generation matrix to calculate the expected age distribution of the secondary cases, and then the tertiary cases, and so on. We assume that the duration of an infection cycle is much shorter than the life span of the human host, so we can neglect the aging of hosts during the epidemic. After five generations of infection, we rank the age classes by incidence of new infections. We repeat these calculations for values of the infectivity parameter q ranging from 0.025 to 0.5 and for index-case ages ranging from the youngest to the oldest age class. In addition, we measure the relative contribution of an age class i to the spread of infection during the next five generations of infection. We do this by calculating the expected reduction in the number of new infections over those five generations following immunization of one single susceptible person in age class i; a larger contribution to further spread of infection corresponds to a larger expected impact of a single immunization.
RESULTS
Age-specific social contacts
The estimated numbers of different conversational partners reveal a strong preference for contacting others within the same age class (table 1). High numbers of contacts within the same age class were reported by school-aged children and young adults.
Number of conversations held with different persons during a typical week, mij, as estimated from self-reported data, after correction for reciprocity, Utrecht, the Netherlands, 1986*
Age class (years) of contacts | Age class (years) of participant | ||||||||||||||||||||||
|---|---|---|---|---|---|---|---|---|---|---|---|---|---|---|---|---|---|---|---|---|---|---|---|
| 1–5 | 6–12 | 13–19 | 20–39 | 40–59 | ≥60 | ||||||||||||||||||
| No. | 95% CI† | No. | 95% CI | No. | 95% CI | No. | 95% CI | No. | 95% CI | No. | 95% CI | ||||||||||||
| 0–5 | 12.26 | 10.36, 14.06 | 2.28 | 1.80, 2.80 | 1.29 | 0.89, 1.75 | 2.50 | 2.14, 2.91 | 1.15 | 0.97, 1.38 | 0.83 | 0.65, 1.08 | |||||||||||
| 6–12 | 2.72 | 2.15, 3.34 | 23.77 | 21.42, 26.47 | 2.80 | 2.13, 3.53 | 3.02 | 2.55, 3.57 | 1.78 | 1.50, 2.14 | 1.00 | 0.84, 1.16 | |||||||||||
| 13–19 | 2.00 | 1.38, 2.71 | 3.63 | 2.76, 4.58 | 25.20 | 21.77, 28.61 | 5.70 | 4.91, 6.56 | 4.22 | 3.63, 4.90 | 1.68 | 1.35, 2.02 | |||||||||||
| 20–39 | 11.46 | 9.97, 13.35 | 11.58 | 9.97, 13.71 | 16.87 | 14.52, 19.38 | 25.14 | 23.57, 26.78 | 16.43 | 15.15, 17.99 | 8.34 | 7.27, 9.60 | |||||||||||
| 40–59 | 3.59 | 3.02, 4.31 | 4.67 | 3.92, 5.60 | 8.50 | 7.32, 9.89 | 11.21 | 10.33, 12.27 | 13.89 | 12.16, 15.52 | 7.48 | 6.57, 8.33 | |||||||||||
| ≥60 | 1.94 | 1.53, 2.53 | 1.95 | 1.65, 2.27 | 2.54 | 2.03, 3.05 | 4.25 | 3.71, 4.89 | 5.59 | 4.91, 6.23 | 9.19 | 7.83, 10.68 | |||||||||||
To obtain a next generation matrix for a specific infection, these entries should be multiplied by the disease-specific value of the infectivity parameter q.
95% CI, 95% bootstrap confidence interval.
The possible impact of age-specific participation or reporting is assessed by comparing the numbers of conversation partners mij after correcting for reciprocity with the numbers of conversation partners without correcting for reciprocity. The largest discrepancy between those numbers of contacts occurs in the age class 13–19 years; this age group claims to have fewer contacts with the age class 20–39 years than vice versa (see Appendix). For comparing numbers of contacts over all age classes, we take the largest eigenvalue of the social contact matrix M after correcting for reciprocity and the largest eigenvalue without correcting for reciprocity. The largest eigenvalue of the social contact matrix M is an appropriate “average” value, as it gives the expected number of different persons contacted during a typical week by an individual who has just been contacted. After correction for reciprocity, this eigenvalue is 47.48 (95 percent confidence interval (CI): 45.43, 49.72). Without correction for reciprocity, this eigenvalue is 45.82. The small difference indicates that, on average, different age classes en masse agree on the number of contacts occurring between them.
The participation rates achieved in this survey were similar to or higher than participation rates achieved in comparable surveys (27). To assess the direction of a potential nonparticipation bias in the reported number of social contacts, we mimic the effect of a lower participation rate by pooling the data from the survey conducted in Utrecht (with a 59 percent participation rate) and data from the survey conducted in Nijmegen (with a 30 percent participation rate). The lower participation rate of the pooled data results in a qualitatively similar contact pattern with a slightly higher largest eigenvalue of 48.64, representing 48.64 different conversational partners per week per person.
Transmission parameters and testing of transmission hypotheses
The serologic data on mumps show that the highest hazard rate of infection was experienced in the age class 6–12 years. These data provide decisive empirical evidence in favor of the social contact hypothesis (figure 1, table 2). The infectivity of mumps is estimated as q = 0.16 (95 percent CI: 0.15, 0.17). The resulting estimate of the basic reproduction number for mumps is 7.68 (95 percent CI: 6.96, 8.45). This estimate is close to the reported values of 6.17 and 8.01 for a wide range of transmission models that account for only age-specific variation in contacts (9, 12). The testing of transmission models against serologic data also reveals that the estimated values of the basic reproduction number and the positions of the confidence intervals are sensitive to the model being used (table 2). Therefore, the reported values should be thought of as conditional on the specific transmission model being used, rather than inherently characteristic of the infection.
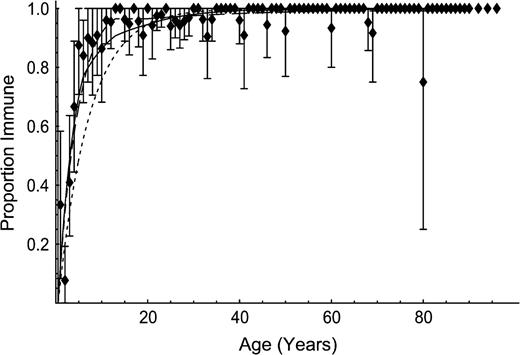
Age-specific immunity to endemic mumps before the introduction of routine vaccination, Utrecht, the Netherlands, 1986. Markers indicate observations, and bars represent 95 percent bootstrap confidence intervals for age cohorts with more than one participant per age class. Lines indicate fit according to the hypotheses of self-reported social contacts (solid line), proportionate mixing (long-dashed line), and homogeneous mixing (short-dashed line).
Results from testing of transmission hypotheses against serologic data on endemic mumps, Utrecht, the Netherlands, 1986
Transmission hypothesis | |||||
|---|---|---|---|---|---|
| Social contact | Proportionate mixing | Homogeneous mixing | |||
| No. of free parameters | 1 | 6 | 1 | ||
Maximized log-likelihood  | −89.43 | −81.52 | −143.29 | ||
| BIC* | 186.39 | 208.21 | 294.11 | ||
| Difference in BIC† | 0 | 21.82 | 107.72 | ||
| Basic reproduction number R0 | 7.68 | 3.83 | 10.99 | ||
| 95% CI* | 6.96, 8.45 | 3.11, 4.74 | 9.66, 12.82 | ||
Transmission hypothesis | |||||
|---|---|---|---|---|---|
| Social contact | Proportionate mixing | Homogeneous mixing | |||
| No. of free parameters | 1 | 6 | 1 | ||
| Maximized log-likelihood | −89.43 | −81.52 | −143.29 | ||
| BIC* | 186.39 | 208.21 | 294.11 | ||
| Difference in BIC† | 0 | 21.82 | 107.72 | ||
| Basic reproduction number R0 | 7.68 | 3.83 | 10.99 | ||
| 95% CI* | 6.96, 8.45 | 3.11, 4.74 | 9.66, 12.82 | ||
BIC, Bayesian Information Criterion; CI, confidence interval.
A difference in BIC between 5 and 10 indicates strong evidence; differences larger than 10 indicate decisive evidence in favor of the hypothesis with the lowest BIC value. Here, the values indicate decisive evidence for the social contact hypothesis over the other two transmission hypotheses.
Results from testing of transmission hypotheses against serologic data on endemic mumps, Utrecht, the Netherlands, 1986
Transmission hypothesis | |||||
|---|---|---|---|---|---|
| Social contact | Proportionate mixing | Homogeneous mixing | |||
| No. of free parameters | 1 | 6 | 1 | ||
| Maximized log-likelihood | −89.43 | −81.52 | −143.29 | ||
| BIC* | 186.39 | 208.21 | 294.11 | ||
| Difference in BIC† | 0 | 21.82 | 107.72 | ||
| Basic reproduction number R0 | 7.68 | 3.83 | 10.99 | ||
| 95% CI* | 6.96, 8.45 | 3.11, 4.74 | 9.66, 12.82 | ||
BIC, Bayesian Information Criterion; CI, confidence interval.
A difference in BIC between 5 and 10 indicates strong evidence; differences larger than 10 indicate decisive evidence in favor of the hypothesis with the lowest BIC value. Here, the values indicate decisive evidence for the social contact hypothesis over the other two transmission hypotheses.
The serologic data on Asian influenza show that the highest infection attack rate was experienced in the age range 10–20 years. These data provide strong empirical evidence against the proportionate mixing hypothesis and more support for the social contact hypothesis than for the homogeneous mixing hypothesis (figure 2, table 3). The infectivity of Asian influenza is estimated as q = 0.036 (95 percent CI: 0.033, 0.041). The resulting estimate of the basic reproduction number for Asian influenza is 1.73 (95 percent CI: 1.57, 1.95). This estimate is close to the recently published value of 1.68 (2).
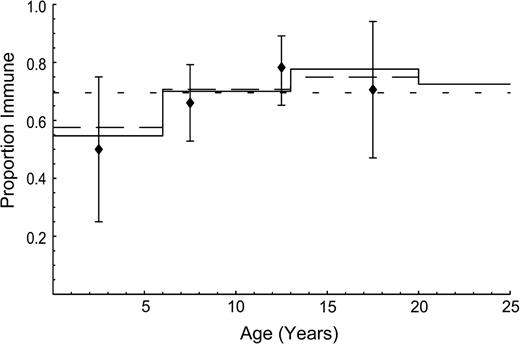
Age-specific immunity to pandemic influenza after the first wave of infection, Cleveland, Ohio, 1957. Markers indicate observations, and bars represent 95 percent bootstrap confidence intervals. Lines indicate fit according to the hypotheses of self-reported social contacts (solid line), proportionate mixing (long-dashed line), and homogeneous mixing (short-dashed line).
Results from testing of transmission hypotheses against serologic data on pandemic “Asian” influenza, Cleveland, Ohio, 1957
Transmission hypothesis | |||||
|---|---|---|---|---|---|
| Social contact | Proportionate mixing | Homogeneous mixing | |||
| No. of free parameters | 1 | 3 | 1 | ||
| Maximized log-likelihood | −27.69 | −27.57 | −28.51 | ||
| BIC* | 60.23 | 69.69 | 61.88 | ||
| Difference in BIC† | 0 | 9.46 | 1.65 | ||
| Basic reproduction number R0 | 1.73 | 1.71 | |||
| 95% CI* | 1.57, 1.95 | 1.56, 1.92 | |||
BIC, Bayesian Information Criterion; CI, confidence interval.
A difference in BIC between 5 and 10 indicates strong evidence; differences larger than 10 indicate decisive evidence in favor of the hypothesis with the lowest BIC value. Here, the values indicate strong evidence for the social contact hypothesis over the proportionate mixing hypothesis.
Initial spread of an epidemic in a completely susceptible population
Simulations of respiratory-spread epidemics reveal that during the initial phase, the highest incidence occurs in the age class 13–19 years. Irrespective of the age of the index case and the value of infectivity parameter q, the age-specific incidences converge to the same ranking after only five generations of infection. Irrespective of the value of infectivity parameter q, immunizing a single individual from the age class 13–19 years results in a greater reduction in the number of new infections than immunizing a single individual from any other age class. In this sense, the age class 13–19 years contributes the most to further spread of the infection.
DISCUSSION
In this paper, we have identified an age-specific social contact pattern and explored its relevance for estimating transmission parameters of respiratory-spread agents. We found that mathematical transmission models that use transmission parameters based on social contacts are better able to capture the observed age-specific infection patterns of mumps and pandemic influenza than similar models that use transmission parameters based on homogeneous mixing or proportionate mixing.
The observed pattern of social contacts reveals a strong preference for contacting other persons of similar age. This is in agreement with contact patterns observed in small convenience samples (16, 18) and with simulated contact patterns based on transportation data (15). The different age classes en masse agreed on the numbers of contacts occurring between them. This consistency may be surprising, as self-reported recall of social behavior is often inaccurate (28). However, although individuals are not very good at remembering and reporting their particular social interactions, individuals on average seem to know certain broad facts about the social interactions in the population at large (29). Nevertheless, the quality of self-reported information could be further improved in future studies by using a prospective study design and by giving a clear definition of an equivalent for conversation that applies to contact with infants.
The school-aged children and young adults reported the highest number of different conversation partners. The simulation study shows the epidemiologic implications of this finding: During an epidemic in a completely susceptible population, school-aged children and young adults will experience the highest incidence of infection and will contribute most to the future spread of infection. There is fragmented epidemiologic evidence supporting this suggested role in the transmission of respiratory-spread agents. Measles epidemics occurring in susceptible populations in remote locations, such as Greenland or the Shetland Islands (30), and influenza pandemics occurring in populations as different as those of Iceland (31) and Japan (32) have revealed a peak in the incidence of infection around the age of 15 years.
The simulations with the estimated contact pattern suggest that in the initial phase of an epidemic of a respiratory-spread agent in a susceptible population, the age-specific incidences converge rapidly (within a few generations of infection) to a typical pattern, with a peak incidence in the age class 13–19 years. The epidemiologic corollary is that in the initial stages of an epidemic, we can already see whether the observed age-specific incidence is consistent with the predictions obtained from the self-reported social contacts. If the observations agree with the predictions, we can be more confident in using transmission models that rely on the estimated contact pattern to explore the effectiveness of alternative intervention strategies. The simulations suggest that targeting school-aged children and young adults is highly effective in reducing further transmission, irrespective of the infectivity of the disease.
Our study provides a direct connection between observations about the age-specific social behavior of persons in different age classes and the observed age-specific risk of infection. Such a connection facilitates the application of mathematical transmission models to respiratory-spread infectious diseases. Furthermore, the observed social contact behavior can be particularly helpful in planning for interventions when little else is known about the infection besides its predominant transmission route. Such planning will be crucial if a new pandemic influenza subtype emerges, if smallpox or pneumonic plague is reintroduced, or if any new respiratory agent starts spreading from person to person.
APPENDIX
Log-likelihood functions for the social contact matrix M
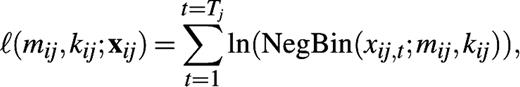
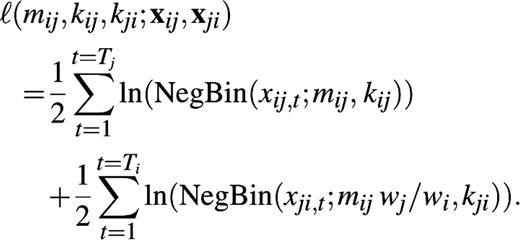
We use the negative binomial distribution to describe the self-reported number of conversational partners encountered during a typical week in age class i by participants in age class j. The mean of this distribution is mij, and the variance is mij +
Age distribution of survey participants who reported their numbers of social contacts, Utrecht, the Netherlands, 1986*
Age class (years) | Total | |||||||||||||
|---|---|---|---|---|---|---|---|---|---|---|---|---|---|---|
| 0 | 1–5 | 6–12 | 13–19 | 20–39 | 40–59 | ≥60 | ||||||||
| No. of participants | 0 | 125 | 154 | 152 | 681 | 360 | 341 | 1,813 | ||||||
| Dutch population (×1,000) | 184 | 876 | 1,265 | 1,642 | 4,857 | 3,312 | 2,477 | 14,614 | ||||||
The projected age distribution of the Dutch population on January 1, 1987, is given for comparison (33).
Selective reporting and selective participation
The largest correction for reciprocity is observed for contacts between the age classes 13–19 years and 20–39 years (compare appendix table 1 with appendix figure 1). We illustrate this with the age-specific population sizes from appendix table 1 and the reported numbers of contacts from appendix figure 1: The age class 13–19 years claims to have had a total of 18,899,420 conversational contacts with the age class 20–39 years (1,642,000 × 11.51 = 18,899,420); the age class 20–39 years claims to have had a total of 32,590,470 conversational contacts with the age class 13–19 years (4,857,000 × 6.71 = 32,590,470). This discrepancy is suggestive of a reporting bias (e.g., young adults overestimating their numbers of contacts with adolescents) or a participation bias (e.g., young adults who converse with adolescents being more likely to participate).
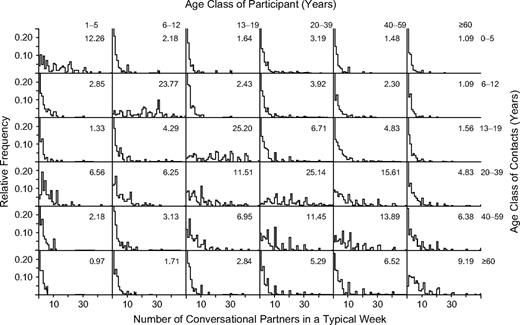
Relative frequencies of numbers of different conversation partners encountered during a typical week, as estimated from self-reported data, without correction for reciprocity, Utrecht, the Netherlands, 1986. Data are stratified by the age classes of the participants (horizontal) and their contacts (vertical). The numbers above each histogram indicate the mean value, without correction for reciprocity.
Relation to transmission rates
Normalized age-specific contact rates cij as estimated from self-reported data for a typical week, after correction for reciprocity, Utrecht, the Netherlands, 1986*
Age class (years) of contacts | Age class (years) of participant | ||||||||||
|---|---|---|---|---|---|---|---|---|---|---|---|
| 1–5 | 6–12 | 13–19 | 20–39 | 40–59 | ≥60 | ||||||
| 0–5 | 169.14 | 31.47 | 17.76 | 34.50 | 15.83 | 11.47 | |||||
| 6–12 | 31.47 | 274.51 | 32.31 | 34.86 | 20.61 | 11.50 | |||||
| 13–19 | 17.76 | 32.31 | 224.25 | 50.75 | 37.52 | 14.96 | |||||
| 20–39 | 34.50 | 34.86 | 50.75 | 75.66 | 49.45 | 25.08 | |||||
| 40–59 | 15.83 | 20.61 | 37.52 | 49.45 | 61.26 | 32.99 | |||||
| ≥60 | 11.47 | 11.50 | 14.96 | 25.08 | 32.99 | 54.23 | |||||
To obtain a matrix with transmission rates for a specific infection in a specific population, these entries should be multiplied by the disease-specific value of the infectivity parameter q and divided by the total population size.
Log-likelihood functions for the transmission parameters
Social contact hypothesis. We substitute N = (nij) = (qmij) for the next generation matrix and maximize the log-likelihood function for θ = q.
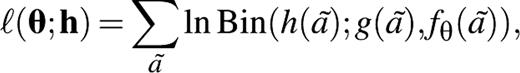
Proportionate mixing hypothesis. For mumps, we maximize the log-likelihood function for θ = (λ1, λ2, λ3, λ4, λ5, λ6) over age cohorts ã = 0 to ã = 100. For influenza, we maximize the log-likelihood function for θ = (z1, z2, z3) over age cohorts ã = 0 to ã = 20.
Homogeneous mixing hypothesis. For mumps, we maximize the log-likelihood function for θ = λ. For influenza, we maximize the log-likelihood function for θ = z over age cohorts ã = 0 to ã = 20.
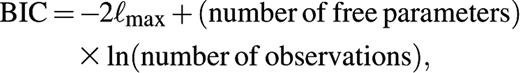
 denotes the maximized log-likelihood (26).
Editor's note:An invited commentary on this article is published on page .
The authors are much indebted to Dr. Hans van Druten for allowing them to use the hitherto unpublished sociologic and serologic data collected in Utrecht and Nijmegen in 1986 and to Prof. Herb Hethcote for helpful comments on a previous version of this paper.
Conflict of interest: none declared.
References
Heyman DL, ed. Control of communicable diseases manual. 18th ed. Washington, DC: American Public Health Association,
Longini IM Jr, Halloran E, Nizam A, et al. Containing pandemic influenza with antiviral agents.
Ferguson NM, Fraser C, Donnelly CA, et al. Public health risk from the avian H5N1 influenza epidemic.
Halloran ME, Longini IM Jr, Nizam A, et al. Containing bioterrorist smallpox.
Ferguson NM, Keeling MJ, Edmunds WJ, et al. Planning for smallpox outbreaks.
Gani R, Leach S. Epidemiologic determinants for modelling pneumonic plague outbreaks.
Schenzle D. An age-structured model of pre- and post-vaccination measles transmission.
Anderson RM, May RM. Age-related changes in the rate of disease transmission: implications for the design of vaccination programmes.
Farrington CP, Kanaan MN, Gay NJ. Estimation of the basic reproduction number for infectious diseases from age-stratified serological survey data.
Hethcote HW. Modeling heterogeneous mixing in infectious disease dynamics. In: Isham V, Medley G, eds. Models for infectious human diseases: their structure and relation to data. Cambridge, United Kingdom: Cambridge University Press,
Wallinga J, Levy-Bruhl D, Gay NJ, et al. Estimation of measles reproduction ratios and prospects for elimination of measles by vaccination in some Western European countries.
Kanaan MN, Farrington CP. Matrix models for childhood infections: a Bayesian approach with applications to rubella and mumps.
Ferguson NM, Cummings DAT, Cauchemez S, et al. Strategies for containing an emerging influenza pandemic in Southeast Asia.
Longini IM Jr, Nizam A, Xu S, et al. Containing pandemic influenza at the source.
Eubank S, Guclu H, Kumar VSA, et al. Modelling disease outbreaks in realistic urban social networks.
Van Geuns HA, Meijer J, Styblo K. Results of contact examination in Rotterdam, 1967–1969.
Sattenspiel L, Powell C. Geographic spread of measles on the island of Dominica, West Indies.
Edmunds WJ, O'Callaghan CJ, Nokes DJ. Who mixes with whom? A method to determine the contact patterns of adults that may lead to the spread of airborne infections.
Wallinga J, Edmunds WJ, Kretzschmar M. Human contact patterns and the spread of airborne infectious diseases.
Van Druten JAM, Reintjes AGM, Plantinga AD, et al. Mumps, measles and rubella, a longitudinal serological study into degree of protection and risk of infection. (In Dutch). (Eindverslag Praeventiefondsproject no. 28-1348). The Hague, the Netherlands: Praeventiefonds,
Harmsen T, Jongerius MC, van der Zwan CW, et al. Comparison of a neutralization enzyme immunoassay and an enzyme-linked immunosorbent assay for evaluation of immune status of children vaccinated for mumps.
Jordan WS, Denny FW, Badger GF, et al. A study of illness in a group of Cleveland families. XVII. The occurrence of Asian influenza.
Diekmann O, Heesterbeek JAP, Metz JAJ. On the definition and the computation of the basic reproduction ratio R0 in models for infectious diseases in heterogeneous populations.
Diekmann O, Heesterbeek JAP. Mathematical epidemiology of infectious diseases: model building, analysis and interpretation. New York, NY: John Wiley and Sons, Inc,
De Melker H, Nagelkerke NJD, Conyn-van Spaendonck MAE. Nonparticipation in a population-based seroprevalence study of vaccine-preventable diseases.
Bernard HR, Killworth PD, Sailer L. Informant accuracy in social-network data V: an experimental attempt to predict actual communication from recall data.
Wasserman S, Faust K. Social network analysis: methods and applications. Cambridge, United Kingdom: Cambridge University Press,
Anderson RM, May RM. Infectious diseases of humans: dynamics and control. Oxford, United Kingdom: Oxford University Press,
Sigurjonsson J, Sigurdsson B, Grimsson H. Experience with influenza vaccination in Iceland, 1957.
Fukumi H. Summary report on the Asian influenza epidemic in Japan, 1957.

