


Abstract
Aims: A combined index based on γ-glutamyltransferase (GGT) and carbohydrate-deficient transferrin (CDT) measurements (GGT–CDT) has been recently suggested to improve the detection of excessive ethanol consumption. The aim of this work was to compare GGT–CDT with the conventional markers of alcohol abuse in individuals with a wide variety of alcohol consumption. Methods: A cross-sectional and follow-up analysis was conducted in a sample of 165 heavy drinkers, consuming 40–540 g of ethanol per day, and 86 reference individuals who were either moderate drinkers (n = 51) or abstainers (n = 35). Results: GGT–CDT (5.35 ± 1.08) in the heavy drinkers was significantly higher than in the reference individuals (3.30 ± 0.37). The sensitivity of GGT–CDT (90%) in correctly classifying heavy drinkers exceeded that of CDT (63%), GGT (58%), mean corpuscular volume (MCV) (45%), aspartate aminotransferase (AST) (47%), and alanine aminotransferase (ALT) (50%), being also essentially similar for alcoholics with (93%) or without (88%) liver disease. When comparing the data using either moderate drinkers or abstainers as reference population, the sensitivity of GGT–CDT, CDT, and ALT remained unchanged whereas the sensitivity of GGT, MCV, and AST was found to show variation. Conclusions: GGT–CDT improves the sensitivity of detecting excessive ethanol consumption as compared with the traditional markers of ethanol consumption. These findings should be considered in the assessment of patients with alcohol use disorders.
(Received 6 January 2006; first review notified 19 April 2006; in revised form 5 May 2006; accepted 19 May 2006)
INTRODUCTION
Although the prevalence of alcoholism and associated medical disorders are continuously growing in most Western countries, patients with hazardous drinking practices continue to escape detection in clinical work (Lieber, 1995; Conigrave et al., 2002; Niemelä, 2002; Room et al., 2005). Therefore, the need for objective laboratory tests, which respond to excessive ethanol intake in a sensitive and specific manner, has been widely recognized. In spite of the fact that a wide variety of biochemical parameters in circulation are altered in alcoholics, none of them has so far provided enough diagnostic accuracy to meet the demands of clinicians in routine use for differentiating between alcoholics and non-alcoholics (Allen et al., 1994; Salaspuro, 1999; Scouller et al., 2000; Arndt, 2001; Conigrave et al., 2002; Niemelä, 2002).
Recent studies have suggested the possibility of using marker combinations, which could improve assay sensitivities without sacrificing specificity (Sillanaukee and Olsson, 2001; Anttila et al., 2003a). A mathematically formulated equation derived from the data of γ-glutamyltransferase (GGT) and carbohydrate-deficient transferrin (CDT) measurements appears to be elevated in a higher percentage of alcoholics than either GGT or CDT alone. This approach, when the latter component of the equation is replaced by the results from %CDT assay, which expresses CDT data as percentage of total transferrin, was recently found to further improve this method as compared with the previous CDTect-based equation (Anttila et al., 2003a). The main advantage achieved by the %CDT method in this context is its ability to avoid the interference of unexpected variation in serum transferrin levels, which complicated the use of the CDTect assay. However, as yet, only limited information has been available on the clinical performance of the new GGT–CDT method and its comparisons with other markers of ethanol intake.
This study was aimed at comparing the diagnostic value of GGT–CDT with several other biomarkers of alcohol abuse in a well-characterized population of heavy drinkers, moderate drinkers, and abstainers.
METHODS
Patients
The sample of alcohol abusers consisted of 165 heavy drinkers (140 men, 25 women), age (mean ± SD) 46 ± 10 years (range 19–73 years). All patients showed a well-documented history of excessive ethanol consumption, as assessed by detailed personal interviews using a time-line follow-back technique and medical and social records. They had consumed ethanol in amounts ranging from 40 to 540 g/day during the past 1 month either continuously or during repeated episodes of binge drinking. The patients also met the DSM-IV criteria of alcohol dependence including pathological alcohol use, social impairment, presence of tolerance, and withdrawal symptoms. There were 51 patients, (38 men, 13 women) age 49 ± 10 years, range 30–67 years, who also showed evidence of liver disease, as assessed by previously established combined morphological index (CMI) or a combined clinical and laboratory index (CCLI) (Orrego et al., 1983; Blake and Orrego, 1991). The mean duration of abstinence prior to sampling was 2 ± 2 days, range 0–6 days. All patients were negative for hepatitis B antigen or hepatitis C serology. Follow-up studies with supervised abstinence for assessing marker normalization rates were carried out in 44 alcoholics, age 42 ± 11 years (range 19–59 years), who were monitored for a period of 11 ± 4 days, range 3–19 days.
Reference individuals were 86 healthy volunteers (49 men, 37 women), age 48 ± 17 years (range 19–84 years) who were either abstainers (n = 35, age 54 ± 18 years, range 22–84 years) or moderate drinkers (n = 51, age 43 ± 14 years, range 19–77 years) whose mean ethanol consumption per day, as also assessed from the past one month by questionnaires, was between 1 and 40 g. All of them were without any previous social or medical history of alcohol abuse. The weekly ethanol consumption in these individuals did not exceed 280 g of alcohol (men) and 160 g (women) or 6 drinks (men) and 4 drinks (women) on any single occasion.
All serum samples were stored at −70°C until analysis. All participants gave their informed consent and the study was carried out according to the provisions of the Declaration of Helsinki. The study was approved by the hospital ethical committee.
Laboratory methods
The concentration of CDT was measured by a turbidimetric immunoassay (TIA) after ion exchange chromatography (%CDT, Axis-Shield, Oslo, Norway). The assay detects primarily a-, mono- and disialotransferrin, although there may be some reactivity towards the trisialofraction of CDT, as recently reported by Aldén et al. (2005). The measurements were carried out on Behring Nephelometer II (Dade Behring, Behring Diagnostics GmbH, Marburg, Germany). The within-run precision was 4.7%, day-to-day variation was 6.0%, and accuracy 12.7%. Serum GGT was measured using enzymatic colorimetric assay, as standardized against IFCC (International Federation of Clinical Chemistry and Laboratory Medicine). The imprecision within run was 0.85% and the day-to-day variation was 0.54%. The accuracy of the GGT method was found to be 5.0%. Serum aspartate aminotransferase (AST) and serum alanine aminotransferase (ALT) were analysed using pyridoxal phosphate methods according to IFCC. For AST, the within-run precision was 0.90%, the day-to-day precision was 1.5%, and accuracy of the method was 10.6%. For ALT, the corresponding values were: within run 0.87%, day-to-day 1.1%, and accuracy 12.1%. The analyses of GGT, AST, and ALT were carried out with Cobas Integra 800 analyser (Roche Diagnostics, Basel, Switzerland). Mean corpuscular volume (MCV) of erythrocytes was measured using the Sysmex XE-2100 hematology analyser (Sysmex Corporation, Kobe, Japan). The imprecision within run was 0.41% and the day-to-day variation was 0.37%. The accuracy of the method was 3.7%. All assays were carried out in an accredited (SFS-EN ISO/IEC 17025) laboratory of the Seinäjoki Central Hospital, Finland. The cut-offs in the above assays were as follows: GGT, men 80 U/l, women 50 U/l; CDT, 2.6%; MCV, 96 fl; AST, men 50 U/l, women 35 U/l; ALT, men 50 U/l, women 35 U/l.
Counting the combined marker
GGT–CDT was counted using an equation based on the data derived from GGT and CDT measurements as follows: GGT–CDT = 0.8 × ln(GT) + 1.3 × ln(%CDT) (Anttila et al., 2003a). Analyses for assay cut-offs from the present reference population were made with ROC analyses using Analyse-It for Microsoft Excel software, which yielded a cut-off of 4.18 for men and 3.81 for women.
Statistical methods
The values are expressed as means ± SD. The comparisons between groups were carried out using the Kruskal–Wallis test with the Dunn's test for multiple comparisons. Correlations were calculated using the Pearson product-moment correlation coefficients for continuous non-skewed parameters or the Spearman's rank correlations for non-continuous variables, as required. Statistical analyses were carried out using GraphPad Prism, version 3.03 (GraphPad Software, San Diego, CA) and Analyse-It for Microsoft Excel software (version 1.68), Leeds, UK. A P-value < 0.05 was considered statistically significant.
RESULTS
The mean values for GGT–CDT, GGT, CDT, MCV, AST, and ALT were all significantly higher in the heavy drinkers than those in the moderate drinkers or abstainers (Fig. 1, P < 0.001 for all comparisons). The sensitivities and specificities of the various markers in differentiating between the heavy drinkers and the reference individuals are summarized in Table 1. GGT–CDT reached a sensitivity of 90% for a specificity of 98%, which clearly exceeded the sensitivities achieved by all the other markers in these comparisons. The sensitivities and specificities of GGT–CDT were high for both men and women (Table 1). Combining GGT and CDT in a manner where either marker is positive obviously yielded a higher sensitivity (85%) than the assays alone, but even this approach did not reach the sensitivity of the mathematically formulated combination (Table 1). When the alcoholic patients were further classified according to the presence or absence of liver disease, GGT–CDT showed essentially similar diagnostic accuracies for both groups, whereas the diagnostic characteristics of GGT, MCV, AST and ALT were found to change as a function of liver status (Table 1). The degree of liver disease severity, as assessed by the combined morphological index (CMI), was not found to correlate significantly with GGT–CDT (r = 0.19).
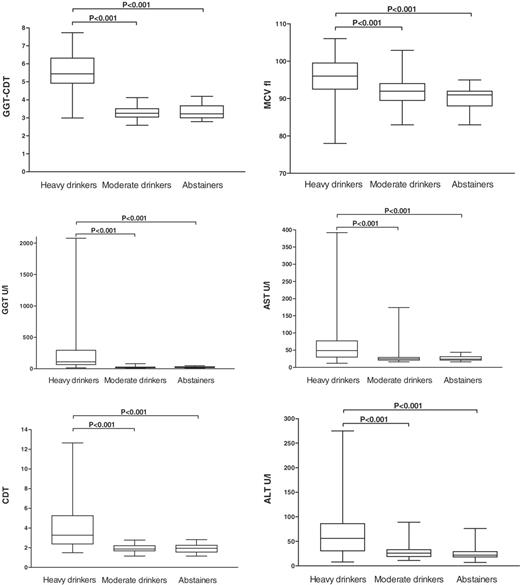
Box plots of various laboratory markers of alcohol consumption in heavy drinkers, moderate drinkers, and abstainers. Alcohol abusers show significantly higher values than moderate drinkers or abstainers in all comparisons (P < 0.001). GGT–CDT, combined marker based on the data from GGT and CDT measurements; GGT, γ-glutamyltransferase; CDT, carbohydrate-deficient transferrin; MCV, mean corpuscular volume; AST, aspartate aminotransferase; ALT, alanine aminotransferase.
Sensitivities of laboratory markers of alcohol consumption in heavy drinkers, as also divided by gender and liver status, and the specificities, as obtained from the current reference population
| Heavy drinkers | Heavy drinkers with liver disease | Heavy drinkers without liver disease | |||||||||||||||
|---|---|---|---|---|---|---|---|---|---|---|---|---|---|---|---|---|---|
| Cut-off | All n = 165 | Men n = 140 | Women n = 25 | All n = 51 | Men n = 38 | Women n = 13 | All n = 114 | Men n = 102 | Women n = 12 | ||||||||
| GGT–CDT | Men 4.18 | Sensitivity | 90 | 89 | 96 | 93 | 91 | 100 | 88 | 88 | 91 | ||||||
| Women 3.81 | Specificity | 98 | 98 | 97 | 98 | 98 | 97 | 98 | 98 | 97 | |||||||
| GGT U/l | Men 80 | Sensitivity | 58 | 56 | 68 | 76 | 79 | 69 | 50 | 48 | 67 | ||||||
| Women 50 | Specificity | 99 | 98 | 100 | 99 | 98 | 100 | 99 | 98 | 100 | |||||||
| CDT % | 2.60 | Sensitivity | 63 | 65 | 52 | 67 | 71 | 58 | 60 | 62 | 45 | ||||||
| Specificity | 98 | 100 | 94 | 98 | 100 | 94 | 98 | 100 | 94 | ||||||||
| GGT or CDT elevated | Sensitivity | 85 | 86 | 83 | 89 | 91 | 83 | 84 | 84 | 82 | |||||||
| Specificity | 96 | 98 | 94 | 96 | 98 | 94 | 96 | 98 | 94 | ||||||||
| GGT and CDT elevated | Sensitivity | 37 | 38 | 35 | 54 | 59 | 42 | 28 | 28 | 27 | |||||||
| Specificity | 100 | 100 | 100 | 100 | 100 | 100 | 100 | 100 | 100 | ||||||||
| MCV fl | 96 | Sensitivity | 45 | 46 | 36 | 69 | 70 | 67 | 42 | 44 | 27 | ||||||
| Specificity | 94 | 94 | 95 | 94 | 94 | 95 | 94 | 94 | 95 | ||||||||
| AST U/l | Men 50 | Sensitivity | 47 | 43 | 68 | 59 | 53 | 77 | 42 | 40 | 58 | ||||||
| Women 35 | Specificity | 95 | 94 | 97 | 95 | 94 | 97 | 95 | 94 | 97 | |||||||
| ALT U/l | Men 50 | Sensitivity | 50 | 49 | 57 | 92 | 100 | 67 | 44 | 43 | 55 | ||||||
| Women 35 | Specificity | 87 | 88 | 86 | 87 | 88 | 86 | 87 | 88 | 86 | |||||||
When the marker data obtained from the heavy drinkers were contrasted alternatively with either moderate drinkers or abstainers, the sensitivity percentages of GGT (+4%), MCV (+17%), and AST (+20%) all increased when abstainers were used as the only control population. In contrast, GGT–CDT and CDT sensitivities were not affected. The threshold ethanol consumption for elevation of GGT–CDT values when plotting daily ethanol consumption and GGT–CDT was found to be ∼40 g of ethanol (Figure 2). GGT–CDT also correlated more strongly with self-reported ethanol consumption (r = 0.76, P < 0.001) than either GGT (r = 0.71, P < 0.001) or CDT (r = 0.59, P < 0.001) alone or any of the other markers (Table 2).
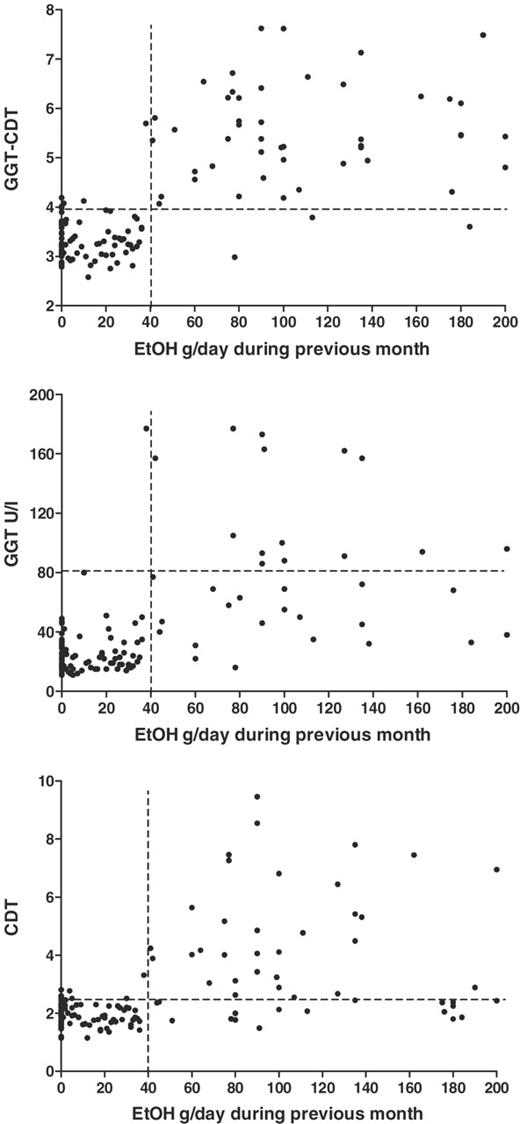
Correlations of GGT–CDT, GGT, and CDT with daily ethanol consumption from the past 1 month prior to sampling. Marker values showed an increase after a threshold consumption of ∼40 g/day, GGT–CDT showing the strongest correlation with the amount of ethanol consumption.
Correlations between biochemical markers of ethanol consumption, and markers and self-reported ethanol consumption
| GGT–CDT | GGT | CDT | MCV | AST | ALT | |
|---|---|---|---|---|---|---|
| GGT–CDT | 1 | |||||
| GGT | 0.90*** | 1 | ||||
| CDT | 0.78*** | 0.47*** | 1 | |||
| MCV | 0.56*** | 0.58*** | 0.33*** | 1 | ||
| AST | 0.72*** | 0.66*** | 0.55*** | 0.43*** | 1 | |
| ALT | 0.66*** | 0.68*** | 0.40*** | 0.33*** | 0.85*** | 1 |
| EtOH g/previous day | 0.45*** | 0.42*** | 0.40*** | 0.37*** | 0.38*** | 0.33*** |
| EtOH g/previous month | 0.76*** | 0.71*** | 0.59*** | 0.52*** | 0.59*** | 0.50*** |
***P < 0.001.
In the follow-up of 44 alcoholic patients, GGT–CDT was found to decrease in 93% of these individuals during 11 ± 4 days (range 3–19 days) of supervised abstinence (Table 3). The estimated time for normalization for GGT–CDT, depending on the initial value, was 18 ± 9 days, the mean rate of decay being ∼1.5% of the initial value per day, as compared with 3.4% for GGT and 3.7% for CDT. Nevertheless, the changes towards normalization were found to be more consistent for GGT–CDT and CDT than those for the other markers (Table 3).
Normalization rates for alcohol markers based on follow-ups of 44 alcoholic patients with supervised abstinence for a period 11 ± 4 days
| Marker | Percentages of declining values | Normalization time (days), mean ± SD |
|---|---|---|
| GGT–CDT | 93 | 18 ± 9 |
| GGT | 84 | 16 ± 8 |
| CDT | 93 | 16 ± 11 |
| AST | 68 | 13 ± 20 |
| ALT | 57 | 16 ± 19 |
| MCV | 20 | N.D. |
| Marker | Percentages of declining values | Normalization time (days), mean ± SD |
|---|---|---|
| GGT–CDT | 93 | 18 ± 9 |
| GGT | 84 | 16 ± 8 |
| CDT | 93 | 16 ± 11 |
| AST | 68 | 13 ± 20 |
| ALT | 57 | 16 ± 19 |
| MCV | 20 | N.D. |
N.D. not determined.
The sensitivities and specificities are expressed as percentages.
GGT–CDT, combined marker based on the data from GGT and CDT measurements.
DISCUSSION
In the diagnostics of alcohol use disorders, it is crucial that the laboratory analyses are accurate. Such analyses are needed both for detecting excessive ethanol consumption and for monitoring abstinence. An ideal assay should provide both specificity and sensitivity near 100%. However, to date such assays have not emerged, although marker combinations have been suggested to open new possibilities for improving the situation (Salaspuro, 1987; Anton et al., 2001; Sillanaukee and Olsson, 2001; Anttila et al., 2003a; Hock et al., 2005).
The present work compares a recently developed marker combination, defined here as GGT–CDT, with several other biochemical markers in the diagnosis of alcohol abuse. The data show that the sensitivity of GGT–CDT, which relies on a mathematically formulated equation based on serum GGT and CDT results, exceeds the diagnostic sensitivity of all the conventional markers of alcohol abuse. Interestingly, this advantage is achieved without sacrificing assay specificity. When using standardized methods for the GGT and CDT measurements, the combination can well be standardized for multi-laboratory use, too.
It appears that weighing GGT and CDT in the present manner is important for optimizing assay sensitivity. Previously, combining independent measurements of GGT and CDT (when either of the markers is positive) has been shown to yield a sensitivity of 90% for a specificity of 81% in men and a sensitivity of 75% for a specificity of 87% in women (Anton et al., 2001). Schwan et al. (2004) recently showed that combining GGT and CDT as independent parameters provides a sensitivity of 90% in alcohol abusers and 99% in the alcohol-dependent group, whereas the specificity remains at a level of only 63%. Hock et al. (2005) recently combined log GGT and CDT and obtained a sensitivity of 83% with a specificity of 95%. The sensitivity increased to 88% when MCV was included as a third component in the analyses. The use of MCV or any other parameter as a third component in the present material was, however, not found to lead to any additional improvement as compared with GGT–CDT alone (data not shown).
The first studies employing the combination of GGT and CDT used similar cut-offs for men and women (Sillanaukee and Olsson, 2001; Anttila et al., 2003a). The present work shows, however, that different cut-offs for men and women may be necessary also for this marker. Previously, gender-dependent analytical variation has been observed especially in CDT assays with the CDTect method, which has been later abolished by the use of %CDT assays (Anton and Moak, 1994; Tsutsumi et al., 1994; Niemelä et al., 1995; Viitala et al., 1998; Conigrave et al., 2003). Women are known to be more sensitive to the hepatotoxic effects of alcohol, and it is possible that the activities of serum GGT may also respond to alcohol consumption in a gender-dependent manner, which could explain in part the need for separate cut-offs for men and women. In this material, the presence of liver pathology was found to also affect the interpretation of GGT, AST, ALT, and MCV in the assessment of heavy drinking, whereas GGT–CDT appears to be more resistant towards the variation induced by liver pathology per se. The association between GGT–CDT combination and liver disease may, however, also depend on the method used for analysing the CDT component of the assay (Viitala et al., 1998; Anttila et al., 2003b; Fleming et al., 2004).
The diagnostic potential of GGT–CDT is also supported by its strong correlation with the actual amounts of ethanol consumption from the past 1 month prior to sampling. The values appear to increase after the daily ethanol consumption exceeds 40 g. Previously, CDT has been reported to elevate with daily ethanol consumption ranging from 40 to 80 g, possibly also depending on the method used (Stibler, 1991; Schellenberg et al., 2005). While GGT has also been suggested to increase with a threshold consumption of over 40 g of ethanol per day (Sharpe, 2001), even moderate drinkers may, however, show increased GGT values more often than abstainers (Hietala et al., 2005). Interestingly, recent data have suggested that GGT could actually be considered a marker of oxidative stress (Lim et al., 2004). It is, thus, possible that combining GGT and CDT could provide new diagnostic windows with synergistic benefits for the assessment of hazardous drinking practices.
GGT–CDT seems to recognize ethanol overconsumption in a similar manner whether or not heavy drinkers are contrasted with abstainers or moderate drinkers, which may be a useful characteristic for instance in screening programmes for excessive alcohol consumption. It should be noted that in routine health care reference populations in trials examining diagnostic tests have usually consisted of combined populations of moderate drinkers and abstainers. Here inclusion of moderate drinkers into the reference population was found to affect the diagnostic performance of GGT, AST, and MCV although not GGT–CDT. The combined marker was also found to be suitable for the follow-up of abstinence, showing a rather consistent decline during supervised abstinence, with mean normalization rate of 2–3 weeks. Interestingly, the time required for normalization for GGT–CDT appeared slightly longer than for each marker separately, suggesting that the mathematically formulated combination also follows a slightly different kinetics in its decay.
Taken together, this work supports the idea of using GGT–CDT for achieving a more sensitive diagnosis of alcohol abuse. Since this approach is also cost effective and easy to manage in hospital laboratories, it should be suitable for routine clinical work.
REFERENCES
Aldén, A., Ohlson, S., Påhlsson, P. et al. (
Allen, J. P., Litten, R. Z., Anton, R. F. et al. (
Anton, R. F., Dominick, C., Bigelow, M. et al. (
Anton, R. F. and Moak, D. H. (
Anttila, P., Järvi, K., Latvala, J. et al. (
Anttila, P., Järvi, K., Latvala, J. et al. (
Arndt, T. (
Blake, J. and Orrego, H. (
Conigrave, K. M., Degenhardt, L. J., Whitfield, J. B. et al. (
Conigrave, K. M., Davies, P., Haber, P. et al. (
Fleming, M. F., Anton, R. F. and Spies, C. D. (
Hietala, J., Puukka, K., Koivisto, H. et al. (
Hock, B., Schwarz, M., Domke, I. et al. (
Lieber, C. S. (
Lim, J. S., Yang, J. H., Chun, B. Y. et al. (
Niemelä, O. (
Niemelä, O., Sorvajärvi, K., Blake, J. E. et al. (
Orrego, H., Israel, Y., Blake, J. E. et al. (
Salaspuro, M. (
Salaspuro, M. (
Schellenberg, F., Schwan, R., Mennetrey, L. et al. (
Schwan, R., Loiseaux, M. N., Schellenberg, F. et al. (
Scouller, K., Conigrave, K. M., Macaskill, P. et al. (
Sharpe, P. C. (
Sillanaukee, P. and Olsson, U. (
Stibler, H. (
Tsutsumi, M., Wang, J. S. and Takada, A. (
