


Abstract
Aims: Measurement of an alcohol-induced shift in the serum transferrin glycosylation pattern, termed carbohydrate-deficient transferrin (CDT), is used as a biomarker for sustained high alcohol consumption. The present work examined whether non-enzymatic reaction of transferrin with glucose (glycation) might interfere with the use of CDT as an alcohol biomarker. Methods: The blood specimens were leftover volumes from the routine sample pool. Plasma and serum were collected among samples submitted for hemoglobin A1c (HbA1c) and CDT testing. Quantification of individual transferrin glycoforms in percentage of total transferrin was performed by an HPLC candidate CDT reference method. Results: Incubating serum spiked with 20 or 200 mmol/l glucose caused time- and dose-dependent changes in the chromatographic profile of transferrin glycoforms, resulting in gradually wider peaks and reduced relative amounts of disialo- and trisialotransferrin. No similar chromatographic effects were seen in samples collected from diabetic patients with elevated HbA1c (>68 mmol/mol) values. These samples instead showed slightly higher mean %disialotransferrin levels (1.21%) compared with low HbA1c (<44 mmol/mol) samples (mean 1.06%; P = 0.023), pointing at a higher alcohol consumption level in the former group. Altogether ∼5% of the CDT values exceeded the cutoff. There was no significant difference in phosphatidylethanol (PEth) levels between the high and low HbA1c samples, but several (∼14%) showed elevated PEth concentrations. Conclusion: Glycation of serum transferrin in vivo was indicated to differ from that in vitro, and suggested not to interfere with %CDT testing by the HPLC method. The results indicated that CDT and PEth are useful as objective, complementary alcohol biomarkers to identify risky drinking also in diabetic subjects.
INTRODUCTION
Glycosylation is a common form of post-translational modification by enzymatic addition of oligosaccharide chains (glycans) to proteins. The iron-transport protein transferrin is a glycoprotein with two N-glycosylation sites together carrying 0–2 bi-, tri- or tetra-antennary glycans (van Eijk and de Jong, 1992; Landberg et al., 1995). The different transferrin glycoforms are named depending on the number of terminal sialic acid residues on the glycans. Tetrasialotransferrin, containing two disialylated biantennary N-glycans, is usually the major glycoform in human serum, accounting for ∼75–80% of the total amount (Helander et al., 2003; Bergström and Helander, 2008b).
A shift in the carbohydrate composition of transferrin is commonly seen following sustained high alcohol consumption. Two of the usually minor glycoforms in serum, disialotransferrin with only one complete N-glycan and asialotransferrin without any glycans, are typically found in increased amounts in response to heavy drinking (Helander et al., 2003; Bergström and Helander, 2008b). Owing to a half-life of ∼1.5–2 weeks of serum transferrin, the alcohol-related shift in the glycoform pattern remains influenced for up to about 1 month after abstinence (Jeppsson et al., 1993; Helander and Carlsson, 1996). Based on these observations, measurement of the alcohol-induced glycoforms, collectively termed carbohydrate-deficient transferrin (CDT), has become employed as a long-term biomarker for detection and follow-up of persons with risky drinking habits (Stibler, 1991; Arndt, 2001; Golka and Wiese, 2004; Bortolotti et al., 2006). CDT normalized to the total transferrin concentration (%CDT), which is the recommended practice of expressing test results (Jeppsson et al., 2007), is considered a specific biomarker with little risk for generating false-positive identifications of heavy alcohol consumption (Meerkerk et al., 1998; Bergström and Helander, 2008a). An International Federation of Clinical Chemistry and Laboratory Medicine (IFCC) working group on CDT standardization (IFCC WG-CDT) has defined disialotransferrin as the target measurand for CDT testing, and high-performance liquid chromatography (HPLC) with photometric detection as the candidate reference measurement procedure (Jeppsson et al., 2007; Helander et al., 2010).
Besides glycosylation, transferrin and other proteins may react non-enzymatically with glucose or other sugars in a process known as glycation. Glycation is well known in relation to diabetes control where measurement of the major glycated hemoglobin A1c fraction (HbA1c) is an essential biomarker for long-term assessment of glycemic state (Gillery, 2012). Also transferrin is subject to glycation, both in vitro and in vivo, and studies have reported a higher degree of transferrin glycation in blood samples collected from diabetic subjects compared with non-diabetics (Van Campenhout et al., 2006).
Given glycation has been demonstrated to modify the iron-binding function of transferrin (Fujimoto et al., 1995; Van Campenhout et al., 2003, 2004), the present work was undertaken to study whether glycation of transferrin might interfere with the reliability of serum CDT as a biomarker for heavy alcohol consumption in diabetic subjects. Comparison was made with phosphatidylethanol (PEth) in whole blood, another long-term alcohol biomarker (Helander and Zheng, 2009; Helander et al., 2012).
MATERIALS AND METHODS
Samples
The human blood samples used for this study were de-identified leftover volumes from the routine samples pool (age and sex unknown) at the Karolinska University Laboratory in Stockholm (Sweden). Serum samples were selected among specimens submitted for testing of CDT. EDTA whole blood and plasma samples from diabetic patients (type 1 or type 2 unknown) were selected among those submitted for HbA1c testing by VARIANT II TURBO HbA1c kit 2.0 according to the manufacturer's instructions (Bio-Rad). The method is traceable to the reference methods of the National Glycohemoglobin Standardization Program (NGSP) and IFCC. The reference interval for HbA1c is 27–42 mmol/mol hemoglobin for those younger than 50 years and 31–46 mmol/mol for those who are 50 or older.
The use of de-identified leftover volumes from the routine samples pool for method development studies is approved by the ethics committee at the Karolinska University Hospital.
Incubation of serum samples with glucose
Five serum samples with unknown initial glucose concentration were divided into three tubes each that were spiked with glucose (BDH) to final concentrations of 20 (360 mg/dl) or 200 mmol/l, or without glucose (control), respectively, and incubated at 37°C. Aliquots of the three subsamples were collected at the start (0 h, baseline) and after 24 h and 48 h incubation and placed at −70°C until taken for analysis of transferrin glycoforms.
Measurement of transferrin glycoforms (CDT)
Measurement of transferrin glycoforms was performed by HPLC on an Agilent 1100 LC system, as detailed elsewhere (Helander et al., 2003). The HPLC method has been recommended as candidate CDT reference method by the IFCC working group on CDT standardization (Jeppsson et al., 2007; Helander et al., 2010), and it allows for separation and quantification of transferrin glycoforms in both serum and plasma samples. With EDTA plasma, however, an interfering peak occurs close to the retention time for asialotransferrin (Helander et al., 2003), but this will not influence quantification of CDT, as it includes only disialotransferrin. Pre-treatment of the samples included iron-saturation with ferric nitrilotriacetic acid (FeNTA), and lipoprotein precipitation with dextran sulfate and calcium chloride. Chromatographic separation of transferrin glycoforms was done on an anion-exchange column (SOURCE 15Q 4.6/100 PE, GE Healthcare) by salt gradient elution. Photometric identification and quantification of the glycoforms relied on the selective absorbance of the transferrin-iron complex at 470 nm (Jeppsson, 1967). The relative amount of each glycoform was calculated in percentage of total transferrin, based on measurement of HPLC peak areas using the baseline integration mode.
The cutoff employed to indicate an elevated CDT level was 1.7% disialotransferrin, which corresponds to the 97.5th percentile for control populations (Helander et al., 2003).
Measurement of phosphatidylethanol
Quantification of PEth species in blood was performed by liquid chromatography-mass spectrometry (LC-MS) using selected ion monitoring (SIM) in negative mode, as detailed elsewhere (Helander and Zheng, 2009; Zheng et al., 2011). Sample preparation included total lipid extraction of EDTA whole blood by addition of 100 µl of blood to 600 µl of isopropanol and 25 µl of internal standard solution under constant vortex mixing in glass tubes. Thereafter, samples were gently mixed for 10 min and 2 × 450 µl of heptane was added with mixing after each addition. Following centrifugation, the clear supernatants were transferred to new glass tubes and evaporated to dryness. The dried extracts were finally dissolved in 50 µl of heptane, and mixed with 50 µl of acetonitrile and 75 µl of isopropanol, followed by centrifugation. Chromatographic separation of the lipid extract was done on a 5-µm HyPurity C4 50 × 3 mm column (Thermo Scientific) with gradient elution.
The cutoff used to suggest excessive drinking was 0.70 µmol/l for total PEth, and 0.20 µmol/l for PEth-16.0/18:1, which is typically the principal PEth subform in human blood, based on studies of blood donors samples (Zheng et al., 2011).
Statistics
Statistical evaluations were made by the use of the Wilcoxon test for independent samples and by Pearson correlation coefficient (MedCalc software). A P-value below 0.05 was considered statistically significant.
RESULTS
Five serum samples containing CDT (%disialotransferrin) levels in the range of 1.0–2.5% (mean 1.5%) were used for the in vitro incubation study with glucose. Incubation of serum spiked with 20 or 200 mmol/l glucose caused time- and dose-dependent changes in the HPLC pattern of transferrin glycoforms, the most pronounced effects being wider peaks and hence poorer peak resolution (see one example in Fig. 1). A gradual reduction in the relative amounts (i.e. relative peak areas) of disialo- and trisialotransferrin and increases of pentasialo- and hexasialotransferrin were also observed. Following incubation for 24 h with 20 or 200 mmol/l glucose, the relative disialotransferrin level was decreased to on average 87 and 74%, respectively, compared with the starting value. The chromatographic effects seen after 48 h incubation were similar to the 24-h changes for 20 mmol/l glucose, but even more pronounced with 200 mmol/l (data not shown). In the control incubations without exogenous glucose, no change in the peak resolution for disialo- and trisialotransferrin was observed, and the %disialotransferrin mean value was 99% of the starting level.
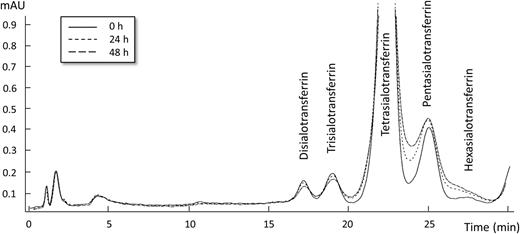
HPLC chromatographic changes of the iron-saturated transferrin glycoform pattern at 470 nm following incubation of a serum sample at 37°C with 20 mmol/l glucose at baseline (0 h) and after 24 h and 48 h.
For the in vivo part of the study, 50 EDTA whole blood samples containing an elevated HbA1c value [>68 mmol/mol (i.e. >8.4% NGSP); range 69–128 mmol/mol, mean 88] and 50 control samples with HbA1c levels within the reference interval [<44 mmol/mol (i.e. <6.2% NGSP); range 29–43 mmol/mol, mean 37] were compared. There were no significant differences in peak width for disialo- (P = 0.549), trisialo- (P = 0.544), tetrasialo- (P = 0.652), pentasialo- (P = 0.591) or hexasialotransferrin (P = 0.418) between the two HbA1c groups. Instead, the plasma of the EDTA blood samples with elevated HbA1c values showed significantly higher (P = 0.023) relative CDT (i.e. %disialotransferrin) levels (mean 1.21%, range 0.79–2.77) than the samples with low HbA1c values (mean 1.06%, range 0.65–2.04) (Fig. 2). A significant difference was also obtained for trisialotransferrin (mean 4.63 vs. 5.02%; P = 0.043) but not for tetrasialo- (P = 0.181), pentasialo- (P = 0.736) and hexasialotransferrin (P = 0.840). Altogether, three (6%) plasma samples with an elevated HbA1c and two (4%) with a low HbA1c showed CDT (%disialotransferrin) values exceeding the 97.5th percentile cutoff (>1.7%) for controls (Helander et al., 2003).
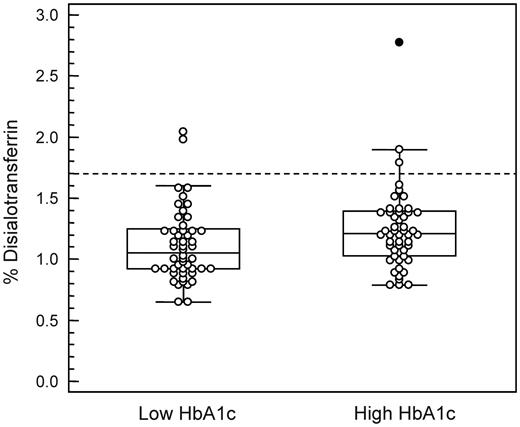
Box-and-whisker plot showing CDT (%disialotransferrin) values in EDTA plasma samples from diabetic patients with low HbA1c (<44 mmol/mol) or elevated HbA1c (>68 mmol/mol) values. Outliers are plotted with filled symbols. The broken line represents the cutoff employed for %disialotransferrin based on the 97.5th percentile for control populations (Helander et al., 2003). There was a statistically significant difference between the groups (P = 0.023).
Several blood samples contained PEth values above the cutoff used to suggest regular high alcohol consumption, both among the samples with elevated HbA1c (16%) and low HbA1c (12%) levels, but there was no significant difference between the two groups. The mean concentration for total PEth in samples with an elevated HbA1c was 0.37 µmol/l (range 0–3.05 µmol/l) compared with 0.30 µmol/l (0–3.63 µmol/l; P = 0.257) for the low HbA1c samples (Fig. 3A). Similar results were obtained for the PEth-16:0/18:1 subform, the mean level in samples with an elevated HbA1c being 0.15 µmol/l (range 0–1.22 µmol/l) compared with 0.10 µmol/l (range 0–1.39 µmol/l; P = 0.210) for the low HbA1c samples (Fig. 3B).
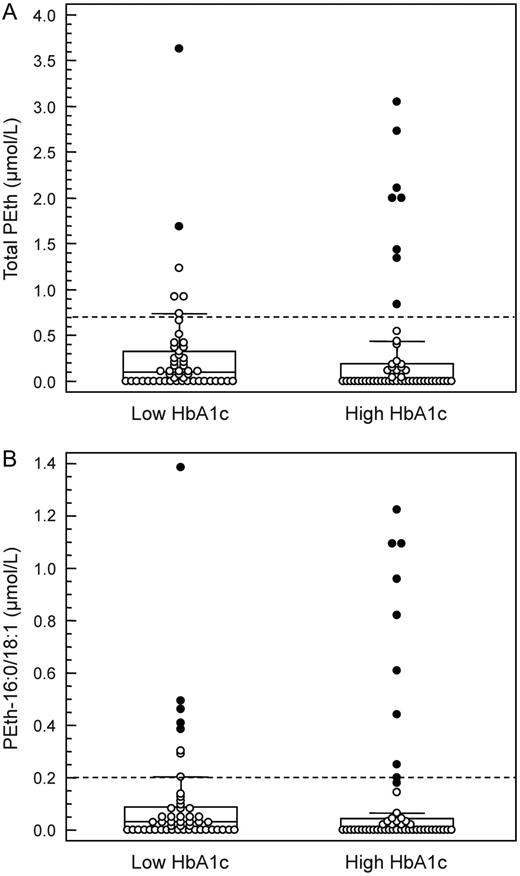
Box-and-whisker plot showing (A) total PEth and (B) PEth-16:0/18:1 values in EDTA whole blood samples from diabetic patients with low HbA1c (<44 mmol/mol) or elevated HbA1c (>68 mmol/mol) values. Outliers are plotted with filled symbols. The broken lines represent the routinely employed cutoffs (Zheng et al., 2011). There were no statistically significant differences between the groups (P > 0.2 for both).
Overall, CDT (%disialotransferrin) showed a weak but statistically significant positive correlation with total PEth (r = 0.331, P = 0.001) as well as with PEth-16:0/18:1 (r = 0.313, P = 0.002). Of the total 14 specimens with an elevated total PEth level, only 3 (21%) also had an elevated CDT level; among the 5 CDT-positive specimens, 3 (60%) tested positive for total PEth. Similar numbers were obtained for CDT vs. PEth-16:0/18:1 (data not shown).
DISCUSSION
Studies have demonstrated the relative amount of serum CDT to be a specific alcohol biomarker with little risk for generating false-positive identifications of alcohol abuse, which is in contrast to the liver enzymes traditionally used as ‘alcohol tests’ (Meerkerk et al., 1998; Bergström and Helander, 2008a). Except for a few confirmed interferences including genetic transferrin variants (Helander et al., 2001), rare congenital disorders of glycosylation (Helander et al., 2004), severe liver disease (Arndt et al., 2008; Stewart et al., 2010) and pregnancy (Bianchi et al., 2011; Kenan et al., 2011), common diseases and drug therapies have been indicated not to affect the CDT test (Bergström and Helander, 2008a), although further studies were requested in the case of diabetes mellitus (Fleming et al., 2004). Rather, most reported causes for false-positive CDT results were indicated to be due to the poorer analytical methodologies used previously (Bergström and Helander, 2008a).
In this study, incubation of serum samples spiked with glucose caused time- and dose-dependent changes in the chromatographic pattern of transferrin glycoforms. These changes were observed already following 24 h incubation with 20 mmol/l glucose, a concentration being in the range seen in diabetic patients with poor glycemic control (UK Prospective Diabetes Study Group, 1998). The higher glucose concentration tested in vitro (200 mmol/l) is well above that observed even in case of severe hyperglycemia (Tzamaloukas et al., 2008). However, here it should be pointed out that the incubations were performed for only up to 48 h, which is considerably shorter than the time transferrin, with a half-life of ∼1.5–2 weeks, is exposed to glucose in the circulation. Incubation of serum with glucose resulted in gradually wider HPLC peaks for the transferrin glycoforms and a concomitant reduction in the relative amount of disialotransferrin, the main CDT glycoform (Jeppsson et al., 2007). In contrast, blood samples originating from diabetics with elevated HbA1c values, indicating exposure to high blood glucose levels in the weeks prior to sampling, showed no corresponding difference in peak width for disialotransferrin, nor a reduced %disialotransferrin level, in comparison with the low HbA1c samples. This suggested that transferrin glycation in vitro differs from that in vivo, as has been demonstrated for hemoglobin (Finke et al., 1998; Hempe et al., 2012).
Although it cannot be excluded that the reduction in the serum %disialotransferrin level seen following incubation with glucose (glycation) in vitro to some extent also occurs in vivo, and may thus partly mask elevations in CDT (i.e. causing false-low values) in diabetics with a high HbA1c, the present results indicated no such influence. Instead, among the blood specimens collected from diabetic subjects, a slightly higher %CDT mean value was seen in the samples with elevated HbA1c values, pointing at a higher alcohol consumption level. Furthermore, a number of samples (∼5% overall) showed CDT levels exceeding the cutoff used to indicate chronic heavy drinking. However, there was no significant group difference for the PEth levels, but there were several elevated test results in both HbA1c groups (∼17% overall), which indicated regular high alcohol consumption. A higher frequency of elevated PEth than CDT values was expected, given the higher sensitivity of the PEth biomarker (Helander et al., 2012).
Many diabetic patients regularly consume alcohol (Ahmed et al., 2006). Previous research has suggested moderate drinking to be protective for type 2 diabetes in both men and women, whereas no risk reduction, or rather an increased risk, has been reported in case of chronic heavy drinking (Carlsson et al., 2005; Koppes et al., 2005; Shai et al., 2007; Baliunas et al., 2009; Pietraszek et al., 2010). Problem drinking has also been demonstrated to make diabetic patients less adherent to self-care practices, such as following a meal plan, monitoring and maintaining a normal blood glucose level and performing HbA1c tests, and hence increase the risk of hyper- and hypoglycemia (Johnson et al., 2000; Ahmed et al., 2006; Engler et al., 2013). The importance of assessment and treatment of at-risk drinking to improve diabetes treatment adherence and outcomes therefore needs to be highlighted. Based on the present results of CDT and PEth testing, risky drinking was indicated to occur in diabetic patients with an elevated HbA1c level, which is indicative of poor glycemic control in the previous weeks, but also among patients showing a low, normal HbA1c level.
In summary, transferrin glycation in vitro was demonstrated to cause changes in the chromatographic pattern of transferrin glycoforms and a reduction in the %disialotransferrin (CDT) level. No corresponding effects were apparent in vivo, based on the study of samples collected from diabetic subjects with elevated HbA1c values. Thus, CDT is seemingly a reliable objective tool for screening and follow-up of heavy alcohol consumption also in diabetic subjects. Given that CDT and PEth identified partly different cases, they should be regarded as complementary rather than alternative alcohol biomarkers.
Funding
Financial support was provided through the regional agreement on medical training and clinical research (ALF) between Stockholm County Council and the Karolinska Institutet.
Conflict of interest statement. None declared.
