


Abstract
Aims: Subjective response to alcohol represents a marker of alcoholism risk. The A118G single-nucleotide polymorphism (SNP) of the mu opioid receptor (OPRM1) gene has been associated with subjective response to alcohol. Recently, the dopamine transporter (DAT1) variable number of tandem repeat (VNTR; SLC6A3) has been found to interact with the OPRM1 A118G SNP in predicting neural and behavioral responses to naltrexone and to alcohol. This exploratory study examines the OPRM1 × DAT1 interaction on subjective responses to alcohol. Methods: Non-treatment-seeking problem drinkers (n = 295) were assessed in the laboratory for alcohol dependence. Following prospective genotyping for the OPRM1 gene, 43 alcohol-dependent individuals were randomized to two intravenous infusion sessions, one of alcohol (target BrAC = 0.06 g/dl) and one of saline. Measures of subjective responses to alcohol were administered in both infusion sessions. Results: Analyses revealed significant Alcohol × OPRM1 × DAT1 interactions for alcohol-induced stimulation, vigor and positive mood as well as significant Alcohol × OPRM1 × DAT1 × Time interactions for stimulation and positive mood. These effects were such that, compared with other genotype groups, OPRM1 G-allele carriers + DAT1 A10 homozygotes reported steeper increases in stimulation and positive mood across rising BrAC, when compared with placebo. All Alcohol × OPRM1 × DAT1 interactions remained significant when analyses were restricted to a subsample of Caucasian participants (n = 34); however, 4-way interactions did not reach statistical significance in this subsample. Conclusions: This study suggests that the contribution of OPRM1 genotype to alcohol-induced stimulation, vigor and positive mood is moderated by DAT1 genotype. These findings are consistent with the purported interaction between opioidergic and dopaminergic systems in determining the reinforcing properties of alcohol.
INTRODUCTION
While the heritability of alcohol dependence (AD) may be as high as 50–60% (Kendler et al., 1997; Prescott and Kendler, 1999), the genetic architecture of AD is complex and remains largely elusive. In recent years, risk gene identification has progressed through the use of intermediate phenotypes for alcohol use disorders (Hines et al., 2005; Ducci and Goldman, 2008), including the subjective effects of alcohol (Ray et al., 2010a). The endogenous opioid system has been implicated in the pathophysiology of alcoholism as it modulates the reinforcing effects of alcohol via activation of mu opioid receptors in the ventral tegmental area and nucleus accumbens, which in turn enhances extracellular concentrations of dopamine in the mesolimbic pathway (Koob and Kreek, 2007; Gianoulakis, 2009). Several genetic association studies have focused on genetic variation in the mu opioid receptor (OPRM1) gene as a plausible candidate locus for alcoholism phenotypes. In particular, a single-nucleotide polymorphism (SNP) of the OPRM1 gene, the A118G SNP (rs17799971), has received significant attention as this non-synonymous mutation results in an amino acid change from asparagine to aspartic acid, which, although controversial, may in turn increase binding affinity for β-endorphin (Bond et al., 1998).
An experimental study focusing on behavioral mechanisms of alcohol reward in a sample of heavy drinkers has shown that compared with A-allele homozygotes, G-allele carriers report greater subjective reinforcement from alcohol in the laboratory (Ray and Hutchison, 2004). Similar results were obtained in a naturalistic study of the effects of alcohol (Ray et al., 2010b). A study of non-human primates has demonstrated that male macaques carrying the SNP that is homologous to the G-allele displayed increased alcohol-induced stimulation, consumed more ethanol and exhibited increased ethanol preference (Barr et al., 2007). Further, neuroimaging studies revealed that G-allele carriers had greater hemodynamic response to alcohol cues in mesocorticolimbic areas (Filbey et al., 2008) and that G-allele carriers displayed a more potent striatal dopamine response to alcohol, compared with A-allele homozygotes (Ramchandani et al., 2011). This is consistent with the role of endogenous opioids in alcohol reinforcement and suggests that alcohol reward and reinforcement are ideal phenotypes to test this candidate gene (Ray et al., 2012).
Research on the OPRM1 gene in alcoholism has been readily applied to naltrexone pharmacogenetics (Heilig et al., 2010, 2011) with some clinical studies suggesting that G-allele carriers may respond better to naltrexone (Oslin et al., 2003; Anton et al., 2008), while other studies have failed to replicate these findings (Gelernter et al., 2007). Laboratory studies have shown that G-allele carriers may experience greater blunting of alcohol reward on naltrexone (Ray and Hutchison, 2007; Setiawan et al., 2011), which may explain its differential clinical efficacy in some trials.
In addition to OPRM1, dopamine systems are critical in neural reward processing. The dopamine transporter (DAT) is an important regulator of dopaminergic transmission and is responsible for the rapid clearing of dopamine from the synaptic cleft. The DAT1 gene (SLC6A3) contains a 40-base-pair variable number of tandem repeats (VNTR) in the 3′ untranslated region, with the most common alleles being 9 and 10 repeat VNTRs (rs28363170). The 10-repeat allele (A10) has higher DAT expression than 9 (A9) or lesser VNTRs (Fuke et al., 2001), suggesting that A9 carriers are likely to have higher synaptic dopamine than A10 carriers. This increase in synaptic dopamine for A9 carriers has been associated with psychological disorders, including alcoholism (Du et al., 2011). Further, A9 carriers have shown greater neural response in the ventral striatum during anticipation and reward receipt suggesting that greater synaptic dopamine may be related to behavioral impulsivity and reward seeking (Dreher et al., 2009; Forbes et al., 2009; Aarts et al., 2010).
Two recent studies suggest there may be an interactive effect between OPRM1 and DAT1 genes in terms of response to naltrexone and alcohol. Anton et al. (2012) found a three-way interaction between naltrexone, OPRM1 and DAT1 genes, such that, among A9 carriers who were OPMR1 A-allele homozygotes, naltrexone significantly reduced drinking relative to placebo. On the other hand, for A10 carriers, there was no significant OPRM1 by medication interaction (Anton et al., 2012). Furthermore, there were main effects of both OPRM1 genotype and DAT1 genotype on stimulation response to an oral alcohol challenge in a lab-bar, with A9 carriers and OPRM1 AA homozygotes both expressing greater stimulation than A10 homozygotes or G carriers (Anton et al., 2012). Thus, participants in the genotype groups reporting the greatest stimulation response were the same participants who were most responsive to naltrexone.
Functional neuroimaging in the same study population found a similar three-way interaction between naltrexone, OPRM1 and DAT1 on ventral striatal response during an alcohol cue task, such that among G-allele carriers who received naltrexone, DAT1 A10 homozygotes had less activation in the ventral striatum than A9 carriers (Schacht et al., 2012). Additionally, in the naltrexone condition, A10 carriers had less medial prefrontal activation than A9 carriers. Together, these results suggest an epistatic interaction between these opioid and dopaminergic genes, which could have implications for the pharmacological treatment of alcoholism.
Further research is warranted to examine these interactions, particularly in the context of subjective responses to naltrexone and to alcohol. To that end, this exploratory study examines the interaction between OPRM1 × DAT1 genotypes on subjective responses to an intravenously administered placebo-controlled alcohol challenge. To better elucidate the contribution of these genes to alcoholism development, the sample is comprised of non-treatment-seeking alcohol-dependent individuals prospectively genotyped for the A118G SNP of the OPRM1 gene. Based on a previous analysis of this sample (Ray et al., 2013), we expected that G-allele carriers would display greater hedonic response to alcohol even after DAT1 polymorphism is included in the models. Additionally, given previous research showing epistatic interactions between OPRM1 and DAT1 genotypes in mediating response to alcohol, we expect OPRM1 genotype to interact with DAT1 genotype in predicting subjective response to alcohol when compared with saline.
METHOD
Participants
Non-treatment-seeking problem drinkers (N = 295) were recruited from the Los Angeles community through print and online advertisements. The protocol was approved by the University of California, Los Angeles Institutional Review Board. Inclusion criteria were: (a) age between 21 and 65 years; (b) self-identification of problems with alcohol; (c) consuming a minimum of 48 standard drinks per month. The cut-off of 48 drinks per month was used to identify heavy drinkers, thus increasing the likelihood that they would meet criteria for current AD, a requirement for enrollment in the alcohol administration. Exclusion criteria were: (a) in treatment for alcohol problems or seeking treatment; (b) ≥21 days since last drink; (c) history of bipolar disorder or any psychotic disorder; and (d) Clinical Institute Withdrawal Assessment for Alcohol (CIWA-AR) (Sullivan et al., 1989b) score ≥10. The average age of the screening sample (n = 295) was 31.05 (SD = 10.49, range 21–63) and the majority of participants were male (73.5%). The ethnic background of the sample was: White (55.6%), African American (23.5%), Asian (5.8%), Latino (13.7%) and Native American (1.4%). The majority of the screening sample met DSM-IV criteria for AD (n = 213, 72.2%) and all individuals enrolled in the alcohol administration met criteria for current AD.
Screening and experimental procedures
Potential participants responded to advertisements designed to identify problem drinkers by inquiring the following: ‘Do you worry about your drinking?’ and ‘Do you often drink more than you wanted to?’ Interested individuals completed an initial telephone interview after which eligible participants were invited to the laboratory for a screening session. After written informed consent, participants provided a saliva sample for DNA analyses and completed individual differences measures. Prospective genotyping was used to oversample for the A118G SNP of the OPRM1 gene in the experimental portion of the study (Ray and Hutchison, 2004; Ray et al., 2007). Prior to the infusion sessions, participants attended a physical examination and completed associated laboratory tests, including a liver enzymes panel. The medical examination was designed to exclude individuals who were not medically fit to receive the intravenous alcohol and/or who were taking medications that may interact adversely with alcohol. From the total 295 participants screened in the lab, 48 were invited to the physical examination based on OPRM1 genotype and alcohol dependence status. Of those, 45 were medically eligible, 43 were randomized and 42 completed the study. Participants received two randomized infusion sessions; one alcohol infusion and one saline control infusion, delivered in a single-blinded, counterbalanced fashion. Participants were blinded to infusion condition (alcohol versus saline) and infusion sessions were separated by an interval of 7–10 days. Participants were compensated $240 for completing the entire study.
Measures
Individual Difference Measures: (a) Alcohol use was assessed using the 30-day timeline follow-back (TLFB) interview (Sobell and Sobell, 1980). (b) AD and the exclusionary psychiatric diagnoses were assessed using the Structured Clinical Interview for DSM-IV (SCID; First et al., 1995); (c) The Clinical Institute Withdrawal Assessment for Alcohol (CIWA-AR) assessed the presence and severity of withdrawal symptoms (Sullivan et al., 1989a). Participants also completed (d) the Alcohol Dependence Scale (ADS) (Skinner and Allen, 1982), (e) the Drinkers Inventory of Consequences (DrInC-2R) questionnaire (Miller et al., 1995); (f) the Penn Alcohol Craving Scale (PACS) (Flannery et al., 1999), (g) the Beck Anxiety Inventory (BAI) (Beck and Steer, 1993); and (h) the Beck Depression Inventory-II (BDI-II) (Beck et al., 1996).
Alcohol administration procedures
All participants were required to have a BrAC of zero immediately prior to the alcohol/saline administration. Participants were not required to fast prior to the alcohol/saline administration and regular smokers were allowed to smoke immediately prior to the infusions. Given the importance of effectively controlling blood alcohol levels (O'Connor et al., 1998; Ramchandani et al., 1999; Li et al., 2001), alcohol was administered intravenously using an established nomogram that takes into account participants' sex and weight (Ray and Hutchison, 2004; Ray et al., 2007). The infusion was performed using a 5% ethanol IV solution. Infusion rates were: 0.166-ml/minute × weight, in kilograms, for males, and 0.126-ml/minute × weight, for females. Target BrACs were: 0.02, 0.04 and 0.06 g/dl, measured with a scientific breathalyzer every 3–5 min. Upon reaching each of the target BrAC levels, participants' infusion rates were reduced to half in order to maintain stable BrAC during testing. Participants were required to have a BrAC ≤ 0.02 g/dl before leaving the laboratory (or a BrAC = 0.00 g/dl if driving).
Alcohol Administration Measures: (a) The Biphasic Alcohol Effects Scale (BAES) captures feelings of alcohol-induced stimulation and sedation (Martin et al., 1993; Erblich and Earleywine, 1995); and (b) The Vigor and Positive Mood subscales of the Profile of Mood States (POMS) (McNair et al., 1971) were investigated given their previous association with OPRM1 effects in heavy drinkers (Ray and Hutchison, 2004; Ray et al., 2010b).
Genotyping
Saliva samples were collected under researcher observation for DNA analyses using Oragene saliva collection kits. Genotyping was performed at the UCLA Genotyping and Sequencing (GenoSeq) Core. Polymerase chain reaction (PCR) primers were labeled with fluorescent dye (6-FAM, VIC or NED), and PCR was performed on Applied Biosystems dual block PCR thermal cyclers. SNP sequencing was run on an AB 7900HT Fast Real-Time PCR System and analyzed using the Sequence Detection Systems (SDS) software version 2.3. Each run included two positive control samples (individual 2 in CEPH family 1347; Coriell Institute). Genotypes were automatically scored by the allele calling software and verified by visual inspection. In process validation checks, the UCLA GenoSeq Core has average call, reproducibility and concordance rates of 96, 99.7 and 99.8%, respectively. In the screening sample (n = 295), the following OPRM1 genotypes were observed: AA, n = 224, AG, n = 59 and GG, n = 10 (two samples could not be genotyped). Allele frequencies for the A118G SNP of the OPRM1 gene in the screening (unselected) sample were in conformity with Hardy–Weinberg equilibrium, P > 0.10. For the DAT1 VNTR, the following frequencies were observed in the screening sample: 7/7, n = 1; 7/9, n = 1; 7/10, n = 5; 8/10, n = 3; 9/9, n = 24; 9/10, n = 80; 9/11, n = 2; 9/12, n = 1; 10/10, n = 170; and 10/11, n = 7 (one sample could not be genotyped). For the purpose of data analysis, alleles that had <9 repeats were called 9s and alleles with >10 repeats were called 10s. Consistent with previous research, these genotypes were then grouped as 9/9, 9/10 or 10/10. Prospective genotyping was used to reach a balanced sample for the A118G SNP. See Table 1 for OPRM1 × DAT1 genotype frequencies among study completers (n = 42).
OPRM1 × DAT1 genotype frequencies among study completers (n = 42)
| DAT1 | OPRM1 | |
|---|---|---|
| AA | AG/GG | |
| 9,9/9,10 | 7 | 8 |
| 10,10 | 16 | 11 |
| DAT1 | OPRM1 | |
|---|---|---|
| AA | AG/GG | |
| 9,9/9,10 | 7 | 8 |
| 10,10 | 16 | 11 |
OPRM1 × DAT1 genotype frequencies among study completers (n = 42)
| DAT1 | OPRM1 | |
|---|---|---|
| AA | AG/GG | |
| 9,9/9,10 | 7 | 8 |
| 10,10 | 16 | 11 |
| DAT1 | OPRM1 | |
|---|---|---|
| AA | AG/GG | |
| 9,9/9,10 | 7 | 8 |
| 10,10 | 16 | 11 |
Data analytic plan
Hypothesis testing was conducted using a multilevel regression-based framework (Singer, 1998) via PROC MIXED in SAS Version 9.3. The critical P-value was set at P < 0.05 for all analyses. All analyses were modeled with random intercepts and linear slopes across time. Specifically, in the multilevel models, Alcohol and Time were Level 1 variables (nested within subjects), while OPRM1 and DAT1 genotype were Level 2 variables. The primary analyses of genotype effects examined the effects of Alcohol, a two-level within subjects factor (Saline versus Alcohol, coded 0 and 1), OPRM1 Genotype, a two-level between subjects factor (A-allele homozygotes versus G-allele carriers, coded 0 and 1), DAT1 Genotype, a two-level between subjects factor (9.9/9.10 versus 10.10, coded 0 and 1), Time, a four-level within subjects factor (0 at baseline, 1 at BrAC = 0.02 g/dl or 18 min, 2 at BrAC = 0.04 g/dl or 43 min, and 3 at BrAC = 0.06 g/dl or 75 min), and their interactions. Analyses were conducted in a hierarchical blocking fashion, first including all covariates and main effects, followed by the addition of two-way interaction terms in block 2, three-way interactions in block 3 and the four-way Alcohol × Time × OPRM1 × DAT1 interaction in the fourth and final block. The main and interactive effects of alcohol were modeled as linear terms, although quadratic terms were also considered but ruled out as non-significant. The dependent variables were subjective response to alcohol (BAES and POMS). All analyses controlled for sex, ethnicity, and mean centered age, Smoking Status, FTND score, drinks per drinking day (DPDD) and ADS score. Lastly, in order to further rule out the potentially confounding effects of ethnicity, all models were repeated in a subsample of Caucasians only (n = 34). Coefficients for the two pharmacogenetic effects of interest estimated in the subsample of Caucasians (i.e. Alcohol × OPRM1 × DAT1 and Alcohol × Time × OPRM1 ×DAT1) were used to probe the study findings using the full sample.
RESULTS
Pre-test comparisons
As shown in Table 2, the genotype groups generally did not differ on demographics or on measures of alcohol use and problems with a few exceptions. DAT1 genotype groups differed significantly in terms of ethnic diversity (P = 0.01) and age (P = 0.001). Further, significant effects of OPRM1 genotype, DAT genotype and their interaction were observed in terms of cigarette smoking (Ps ≤ 0.05). In light of these baseline differences, smoking status, ethnicity and age were entered as covariates in initial models. While the participants were not formally evaluated for depressive and anxiety disorders, scores on the BDI-II and BAI indicated that on average, study completers reported mild levels of depression (BDI-II mean = 18.9; SD = 12.8) and anxiety (BAI mean = 15.7; SD = 12.5) at study entry. As for the experimental results, there was a significant effect of alcohol (versus placebo) on all the dependent variables of interest, such that alcohol predicted stronger subjective responses than saline across time. Baseline ratings of the BAES, POMS, and AUQ were not significantly different between alcohol and saline conditions (Ps > 0.10). Analyses found no effect of ethnicity (white versus non-white) on subjective responses to alcohol (BAES and POMS) (Ps > 0.10). There was no evidence of order effects (alcohol versus saline infusion first) on any of the dependent variables of interest.
Demographics by OPRM1 genotype, DAT1 genotype, and their interaction
| Variablea | Full Sample (n = 43) | OPRM1 | DAT1 | OPRM1 | DAT1 | OPRM1 × DAT1 | |||||
|---|---|---|---|---|---|---|---|---|---|---|---|
| AA (n = 23) | AG/GG (n = 20) | 9,9/9,10 (n = 15) | 10,10 (n = 27) | χ2/t | P | χ2/t | P | χ2/F | P | ||
| Gender (% female) | 25.6 | 26.1 | 25.0 | 26.7 | 26.0 | 0.01 | 0.94 | 0.00 | 0.96 | 0.01 | 0.92 |
| Race (% Caucasian) | 79.1 | 73.9 | 85.0 | 100 | 66.7 | 0.79 | 0.37 | 6.37 | 0.01 | 0.30 | 0.58 |
| %Regular smoker | 27.9 | 43.5 | 10.0 | 13.3 | 37.0 | 6.01 | 0.05 | 6.28 | 0.04 | 3.91 | 0.05 |
| %Occasional | 34.9 | 26.1 | 45.0 | 60.0 | 22.2 | ||||||
| % Non-smoker | 37.2 | 30.4 | 45.0 | 26.7 | 40.8 | ||||||
| Age | 29.4 (9.5) | 31.6 (10.8) | 26.8 (7.1) | 24.2 (4.6) | 32.2 (10.5) | 1.72 | 0.09 | 3.43 | 0.001 | 0.41 | 0.52 |
| Education | 14.7 (3.4) | 14.9 (4.3) | 14.4 (1.8) | 14.5 (1.4) | 14.8 (4.1) | 0.48 | 0.64 | 0.26 | 0.80 | 0.59 | 0.45 |
| Alcohol Dep Sx | 4.7 (1.5) | 5.0 (1.5) | 4.4 (1.5) | 4.5 (1.5) | 4.8 (1.5) | 1.32 | 0.20 | 0.65 | 0.52 | 0.58 | 0.45 |
| ADS score | 42.4 (5.5) | 42.2 (5.7) | 42.6 (5.3) | 43.2 (5.0) | 41.9 (5.9) | 0.25 | 0.80 | 0.73 | 0.47 | 0.03 | 0.87 |
| DrInC-2R score | 51.0 (24.6) | 52.7 (28.0) | 49.0 (20.5) | 44.1 (19.1) | 55.3 (26.9) | 0.49 | 0.63 | 1.42 | 0.16 | 1.86 | 0.18 |
| PACS score | 20.0 (7.5) | 20.0 (7.1) | 19.9 (5.2) | 15.8 (6.2) | 20.8 (6.3) | 0.03 | 0.98 | 1.17 | 0.25 | 0.12 | 0.73 |
| CIWA-Ar score | 5.6 (4.4) | 6.2 (4.7) | 5.0 (4.1) | 4.0 (3.5) | 6.7 (4.5) | 0.87 | 0.39 | 2.03 | 0.05 | 0.11 | 0.74 |
| Drinking daysb | 19.1 (7.5) | 21.3 (7.9) | 16.9 (6.5) | 16.7 (8.2) | 20.9 (6.9) | 1.96 | 0.06 | 1.74 | 0.09 | 0.01 | 0.93 |
| Drinks per drink dayb | 7.1 (2.9) | 7.5 (3.2) | 6.6 (2.5) | 6.7 (2.2) | 7.2 (3.2) | 1.05 | 0.30 | 0.54 | 0.59 | 0.30 | 0.59 |
aStandard deviations appear in parentheses.
bIn the 30 days prior to the intake interview.
Genetic effects
The results of the multilevel models are shown in Table 3. Block 1 contains all of the predictors, including covariates with no interaction terms. Block 2 contains all two-way interactions of all predictor variables (i.e. alcohol condition, time, OPRM1 and DAT1 genotype). Block 3 contains all three-way interactions, and lastly, block 4 contains the four-way Alcohol × Time × OPRM1 × DAT1 interaction. Based on the study design including a placebo control (i.e. saline condition), the hypothesized pharmacogenetic results are captured by the Alcohol × OPRM1 × DAT1 and the Alcohol × Time × OPRM1 × DAT1 model terms, with the three-way interaction representing a G × G effect of alcohol response and the four-way interaction capturing G × G moderation of response slopes across levels of BrAC.
Results of multilevel models predicting each of the outcome variables of interest (unstandardized regression coefficients are presented)
| Block | Variable | Stimulation (BAES) | Sedation (BAES) | Vigor (POMS) | Pos. Mood (POMS) |
|---|---|---|---|---|---|
| 1 | Sex | 9.41 | −3.00 | 0.57 | 0.42 |
| Ethnicity 1 | −9.05 | 3.40 | −1.16 | −0.003 | |
| Ethnicity 2 | −10.23 | 7.31 | −1.02 | −0.22 | |
| Ethnicity 3 | −14.74 | 2.36 | −0.94 | −0.24 | |
| Age | −0.54 | −0.60 | −0.009 | −0.002 | |
| Smoking status | −8.39 | 4.40 | −0.72 | −0.73 | |
| FTND | 1.31 | 3.06 | −0.056 | −0.057 | |
| DPDD | −1.22 | 1.65 | −0.072 | −0.060 | |
| ADS | −0.53 | 0.40 | −0.039 | −0.005 | |
| Alcohol | 7.30*** | 4.45** | 0.18* | 0.33*** | |
| Time | 1.84 | 2.26** | −0.012 | 0.092* | |
| OPRM1 | −1.07 | −9.28 | 0.24 | 0.44 | |
| DAT1 | −4.70 | −9.80 | −0.47 | −0.41 | |
| 2 | Alcohol*Time | 2.44* | −1.39 | 0.13 | 0.19** |
| Alcohol*OPRM1 | −0.94 | −1.63 | −0.13 | −0.23 | |
| Alcohol*DAT1 | 1.25 | 5.44 | −0.030 | 0.13 | |
| Time*OPRM1 | 4.07* | −2.98 | 0.17* | 0.13 | |
| Time*DAT | 0.17 | −2.00 | 0.0051 | 0.015 | |
| OPRM1*DAT | −12.58 | −6.46 | −1.72* | −0.57 | |
| 3 | Alcohol*Time*OPRM1 | 6.98** | 1.73 | 0.40** | 0.28* |
| Alcohol*Time*DAT1 | 2.04 | 4.10 | −0.001 | 0.10 | |
| Time*OPRM1*DAT1 | −0.25 | 2.65 | −0.24 | −0.085 | |
| Alcohol*OPRM1*DAT1 | |||||
| Full sample (n = 43) | 14.40* | −4.44 | 1.31*** | 1.18*** | |
| Caucasians only (n = 34) | 12.58* | −9.89 | 1.27*** | 1.06*** | |
| 4 | Alcohol*Time*OPRM1*DAT1 | ||||
| Full sample (n = 43) | 10.88* | −1.28 | 0.15 | 0.60* | |
| Caucasians only (n = 34) | 7.86 | −1.60 | 0.03 | 0.51† |
Coefficients for the two pharmacogenetic effects of interest (i.e. Alcohol × OPRM1 × DAT1 and Alcohol × Time × OPRM1 × DAT1) are presented for the full sample (n = 43) and then again for identical models (except covarying for ethnicity) restricted to the sample of Caucasians only (n = 34).
†P < 0.10, *P < 0.05, **P < 0.01, ***P < 0.001.
Alcohol-induced stimulation
Demographic factors such as sex, age, and ethnicity were not significantly related to stimulation response overall (Ps > 0.19). Neither smoking status nor nicotine dependence severity (FTND) was significantly associated with stimulation (P > 0.27). Alcohol use covariates, including average drinks per drinking day and ADS score, were not significantly related to stimulation (Ps > 0.12). A main effect of alcohol condition was observed (P < 0.0001), such that stimulation was greater in the alcohol condition when compared with the placebo condition. A trend was observed for increased stimulation over time (P = 0.06). No main effect of OPRM1 or DAT1 genotype was observed (Ps > 0.39). A significant interaction was observed between alcohol condition and time (P < 0.05) such that stimulation increased to a greater extent in the alcohol condition than in the placebo condition. An OPRM1 × Time interaction was observed (P = 0.05), such that stimulation increased more sharply in G-carriers when compared with A-allele homozygotes. No other two-way interactions were observed (Ps > 0.21). A significant Alcohol × Time × OPRM1 interaction was observed (P < 0.01) such that G-allele carriers showed greater stimulation increases along rising BrAC when compared with A-allele homozygotes. Additionally, a significant interaction between Alcohol × OPRM1 × DAT1 was found (P < 0.05) such that possession of two A10 alleles potentiated the effect of OPRM1 G-allele possession. Lastly, a four-way Alcohol × Time × OPRM1 × DAT1 interaction was observed (P < 0.05; Fig. 1).
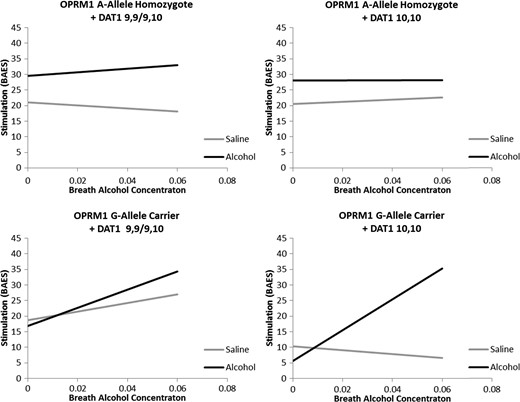
Best fitting regressions line as determined by the full model predicting Stimulation from the BAES from alcohol infusion condition (Alcohol versus Saline), Time (0.00–0.06 BrAC or time equivalent), OPRM1 genotype (A-allele homozygote versus G-allele carrier) and DAT1 genotype (9,9/9,10 versus 10,10) controlling for sex, ethnicity, smoking status, FTND score, DPDD, and ADS score. A significant interaction between alcohol condition and time was observed for G-allele carrier + DAT1 10,10 participants only (P < 0.001).
Post hoc analyses were conducted to decompose this four-way interaction into four 2-way interactions. Specifically, the interaction between Alcohol and Time was examined in each of the four genotype groups. Analyses revealed a significant Alcohol × Time interaction among G-allele carriers who were A10 homozygotes (P < 0.001), but no significant Alcohol × Time effect in all other genotype groups (Ps > 0.19). Post hoc analyses were also conducted to examine possible baseline differences between alcohol and saline infusion sessions and revealed that, for OPRM1 A-allele homozygotes + DAT1 10,10 participants only, stimulation was greater in the alcohol condition when compared with saline (β = 7.54, SE = 3.13, P = 0.017). In no other genotype group did stimulation at baseline differ between infusion conditions (Ps > 0.12). Additionally a significant effect of OPRM1 genotype was observed on baseline stimulation (β = −16.52, SE = 6.98, P = 0.032), such that A-allele homozygotes reported greater stimulation at baseline. This effect was not moderated by DAT1 genotype (P = 0.44) and DAT1 groups did not differ from each other on baseline stimulation (P = 0.95).
Alcohol-induced sedation
Sex, age and ethnicity were not significantly associated with sedation response overall (Ps > 0.29). Similarly, neither smoking status nor FTND score was significantly predictive of sedation response (Ps > 0.23). A trend level effect of DPDD was observed (P = 0.07); however, no main effect of ADS score was observed (P = 0.41). A significant main effect of alcohol condition was observed (P < 0.01) such that sedation was greater when alcohol was administered compared with saline. Additionally, a significant main effect of time was observed (P < 0.01), with sedation increasing over time. No main effects of OPRM1 or DAT1 genotype were observed (P > 0.12). No statistically significant two-way interactions were observed for sedation (Ps > 0.07). Additionally, no three-way interactions were found to be significant (Ps > 0.11). Lastly, the four-way interaction between, Alcohol, Time, OPRM1 and DAT1 was also found not to be significant (P = 0.81).
Alcohol-induced changes in mood
Vigor Response: As before, demographic variables were not found to be associated with vigor during the alcohol-saline administration (P > 0.08). Additionally, smoking status, FTND score, DPDD and ADS score were not associated with vigor response overall (Ps > 0.17). A significant main effect of alcohol condition was observed (P < 0.05) such that vigor was greater in the alcohol condition when compared with the placebo condition. No other main effects were statistically significant (Ps > 0.22). Analyses revealed a significant Time × OPRM1 interaction (P < 0.05) such that vigor increased more quickly over time in G-allele carriers. A trend level Alcohol × Time interaction was observed such that vigor increased more quickly in the alcohol condition when compared with placebo (P = 0.06). An OPRM1 × DAT1 interaction was observed (P = 0.01) and no other two-way interactions were significant (Ps ≥ 0.44). A significant Alcohol × Time × OPRM1 interaction was observed such that alcohol-induced changes in vigor were more pronounced in G-allele carriers (P < 0.01). Additionally a significant three-way interaction between Alcohol, OPRM1 and DAT1 was observed (P < 0.0001; Fig. 2). This effect was such that a significant positive Alcohol effect was observed when averaging across time (i.e. removing Time from the model) in A-allele homozygotes + A9 carriers (P < 0.001) and G-allele carriers + A10 homozygotes (P < 0.01). Among A-allele + A10 homozygotes and G-allele + A9 carriers no significant alcohol effect was observed (Ps > 0.25). Lastly, a four-way Alcohol × Time × OPRM1 × DAT1 interaction was not statistically significant (P = 0.59) such that the pharmacogenetic effects observed did not differ substantially over BrAC.
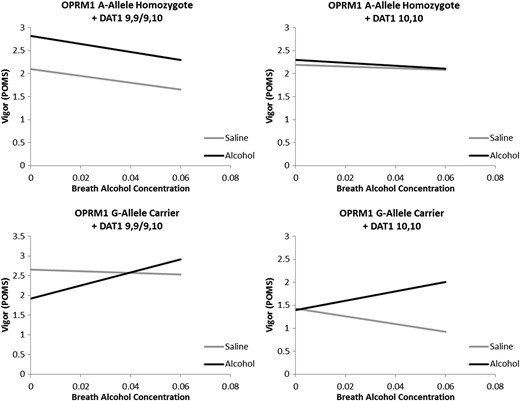
Best fitting regressions line as determined by the model in block 3 (i.e. without a four-way interaction) predicting Vigor from the POMS from alcohol infusion condition (Alcohol versus Saline), Time (0.00–0.06 BrAC or time equivalent), OPRM1 genotype (A-allele homozygote versus G-allele carrier) and DAT1 genotype (9,9/9,10 versus 10,10) controlling for sex, ethnicity, smoking status, FTND score, DPDD, and ADS score. A significant difference between alcohol and placebo infusion averaging across time was observed for OPRM1 A-allele homozygotes + DAT1 A9 carriers and OPRM1 G-allele carriers + DAT1 10,10 homozygotes.
Post hoc analysis of baseline differences between alcohol and saline conditions revealed a significant baseline difference among A-allele homozygote + A9 carriers (β = 0.64, SE = 0.29, P = 0.029) and among G-allele carriers + A9 carriers (β = −0.69, SE = 0.24, P = 0.005), in opposite directions. No significant baseline difference was observed between alcohol and saline conditions among DAT1 A10 homozygotes regardless of OPRM1 genotype (Ps > 0.43). No significant genotype effects were observed for baseline Vigor scores (OPRM1: P = 0.094; DAT1: P = 0.41, OPRM1 × DAT1: P = 0.55).
Positive Mood: Neither sex, age, nor ethnicity was significantly associated with positive mood on the POMS (Ps > 0.31). Likewise, smoking status, FTND score, DPDD and ADS score were not significantly associated with positive mood (Ps > 0.10). Main effects of Alcohol (P < 0.0001) and Time (P < 0.05) were observed, such that positive mood was greater in the alcohol condition and increased over time. No main effects of OPRM1 or DAT1 genotypes were observed (Ps > 0.19). A significant two-way interaction between Alcohol and Time was observed (P < 0.01) such that positive mood increased more quickly in the alcohol condition when compared with saline. No other significant main two-way interactions were observed (P > 0.13). A significant three-way Alcohol × Time × OPRM1 interaction was found (P < 0.05) such that G-allele carriers had a greater response to alcohol in terms of positive mood. Additionally, a significant Alcohol × OPRM1 × DAT1 interaction was observed (P < 0.0001). Analyses to deconstruct this effect revealed that, averaging across time, there was a significant effect of alcohol among OPRM1 A-allele homozygotes + A9 carriers (β = 0.73, P < 0.0001), among A-allele homozygotes + A10 homozygotes (β = 0.34, P < 0.01) and among G-allele carriers + A10 Homozygotes (β = 0.63, P < 0.001), but not in G-Allele carriers + A9 homozygotes (β = −0.16, P = 0.30). Lastly, analysis revealed a significant Alcohol × Time × OPRM1 × DAT1 interaction (P < 0.05; Fig. 3). Post hoc test revealed that the interaction between Alcohol and Time was significant among OPRM1 G-allele carriers + A10 homozygotes (P < 0.0001), but not in any other genotype group (Ps > 0.13). No baseline differences between alcohol and saline infusion conditions were observed in any genotype group (Ps > 0.07). Additionally, no differences in baseline positive mood were observed between genotype groups (OPRM1: P = 0.21; DAT1: P = 0.38, OPRM1 × DAT1: P = 0.99).
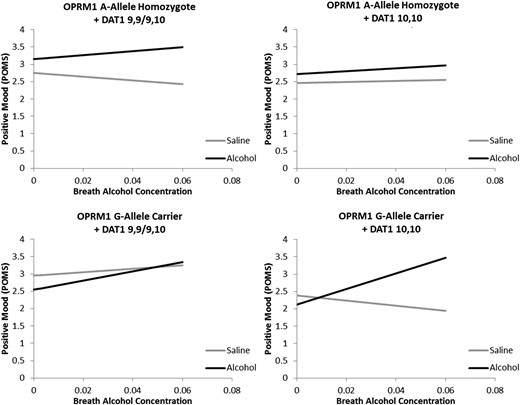
Best fitting regressions line as determined by the full model predicting positive mood from the POMS from alcohol infusion condition (Alcohol versus Saline), Time (0.00–0.06 BrAC or time equivalent), OPRM1 genotype (A-allele homozygote versus G-allele carrier) and DAT1 genotype (9,9/9,10 versus 10,10) controlling for sex, ethnicity, smoking status, FTND score, DPDD, and ADS score. A significant interaction between alcohol condition and time was observed for G-allele carrier + DAT1 10,10 participants only (P < 0.0001).
DISCUSSION
The goal of this study was to examine OPRM1 × DAT1 genotype interactions on subjective responses to alcohol. Based on recent studies suggesting epistatic effects between these two genetic markers, these exploratory analyses were undertaken to further explain individual differences in subjective response to alcohol, as ascertained by an acute intravenous placebo-controlled alcohol challenge among non-treatment-seeking alcohol-dependent participants. We assessed multiple domains of subjective response across the infusion sessions including stimulation and sedation (BAES), and positive mood and vigor (POMS). While single-gene × alcohol effects were observed, this study sought specifically to probe for Alcohol × OPRM1 × DAT1 interactions as well as Alcohol × OPRM1 × DAT1 × Time interactions, both of which probe for alcohol-specific effects (alone or moderated by BrAC). There were significant three-way interactions (Alcohol × OPRM1 × DAT1) for stimulation, vigor and positive mood. In addition, there were significant four-way interactions (Alcohol × OPRM1 × DAT1 × Time) for stimulation and positive mood. Across all three variables, the general pattern of results was such that alcohol (versus saline) administration was associated with an increase in the rewarding effects of alcohol (i.e. greater stimulation, vigor and positive mood) among carriers of the OPRM1 G-allele and the DAT1 A10 homozygotes, when compared with all other genotype groups. Importantly, when probing for these effects in a subsample of Caucasians only, all three-way interactions (Alcohol × OPRM1 × DAT1) remained significant; however, the four-way interactions no longer reached statistical significance. This may be the result of reduced statistical power in the subsample of Caucasians, but it may also reflect population heterogeneity effects. As such, caution is warranted in interpreting the four-way interaction findings.
And while it must be emphasized that this study was not undertaken to examine genetic influences on the naltrexone and alcohol interaction, a comparison to the only other study (Anton et al., 2012) examining this genetic interaction in response to alcohol is worthwhile. In Anton et al. (2012), the Alcohol × OPRM1 interaction suggests that OPRM1 AA homozygotes exhibited a larger stimulation response to alcohol than G carriers, and the DAT1 × OPRM1 interaction suggested that OPRM1 AA homozygotes who were also DAT A9 carriers reported the strongest stimulation following alcohol consumption. In the present study, carriers of the G-allele of the OPRM1 gene who were DAT1 A10 homozygotes showed the greatest subjective response to alcohol, when compared with saline, and when compared with all other genotype groups. A number of differences between the two studies could account for somewhat divergent results. For instance, in the Anton et al. (2012) study the subject population consisted solely of Caucasians while the current study has more racial diversity (including Asians and Hispanics), which, as discussed above, could account for these effects. In this study, alcohol (or placebo) was administered intravenously to achieve BrAC levels up to three times that of the oral alcohol dose used in the Anton et al. (2012) study, assessed after 6 days of ingesting a pill (placebo or naltrexone). Our finding that OPRM1 A-allele homozygotes had higher baseline scores for stimulation and vigor (at a trend level), at BrAC = 0.02, was in agreement with the findings by Anton et al. (2012). Importantly however, by examining a wider BrAC range (target BrAC 0.06 g/dl when compared with 0.02 g/dl in Anton et al.), our analyses revealed the OPRM1 G-allele carriers + DAT1 A10 homozygotes to have a more pronounced hedonic response to alcohol, when compared with saline, and to all other genotype groups. Whether dosage effects, route of administration, expectancy effects, use of a placebo alcohol condition, or pill taking could influence results is unclear. In addition, differences in age and gender between the two studies could lead to discrepant findings.
In summary, this study found significant Alcohol × OPRM1 × DAT1 interactions for alcohol-induced stimulation, vigor and positive mood, such that only those who are carriers of the OPRM1 G-allele and homozygotes for the DAT1 A10 VNTR experienced significant increases in stimulation, vigor and positive mood during the alcohol administration, versus saline. Since both OPRM1 and DAT1 genes are related to dopaminergic transmission, this epistatic effect is highly plausible. OPRM1 heterozygotes (AG or GG individuals) show greater activation of mu opioid receptors in the ventral tegmental area and nucleus accumbens, which is related to increased extracellular concentrations of dopamine in the mesolimbic pathway (Koob and Kreek, 2007; Gianoulakis, 2009). Conversely, DAT1 A9 carriers are thought to have higher concentrations of dopamine in the ventral striatum (Dreher et al., 2009; Forbes et al., 2009; Aarts et al., 2010). While these DAT1 A9 carriers may have higher basal levels of dopamine in the striatum, in this study, carriers of G-allele at the OPRM1 A118G locus and DAT1 A10 homozygotes were most responsive to the hedonic effects of acute alcohol administration. Thus while accounting for baseline differences in all of our models, as well as relevant covariates, a consistent pattern of epistatic effects on the reinforcing subjective response to alcohol emerged. It may be that while DAT1 A9 carriers have higher basal levels of dopamine, they are less responsive to an alcohol challenge than A10 homozygotes who are also OPRM1 G-allele carriers.
This study had several strengths and limitations. The clinical psychopharmacology design and prospective genotyping for the A118G SNP of the OPRM1 gene, the more rare variant of the two genotypes, strengthen the inferences drawn from these analyses. The small sample size and its ethnic diversity represent study limitations, which are partially mitigated by the prospective genotyping and crossover design. The lack of both naltrexone intake and alcohol ‘self-administration’ limits our ability to directly compare the present findings with the two recent reports of epistatic effects of these genetic variants (Anton et al., 2012; Schacht et al., 2012). Nevertheless, the goal of the present study was not to test pharmacogenetics of naltrexone and instead to evaluate DAT1 × OPRM1 interactions on the pharmacogenetics of alcohol response. This is a worthwhile effort as subjective responses to alcohol represent a useful endophenotype for AD (Ray et al., 2010a). On balance, these findings expand on previous naltrexone reports where the DAT1 genotype moderated the effect of OPRM1 status on alcohol use (Anton et al., 2012), as well as brain response during an alcohol cue task (Schacht et al., 2012). Specifically, this exploratory study found that alcohol infusion increased alcohol-induced stimulation, vigor and positive mood markedly among carriers of the OPRM1 G-allele who were also homozygotes for the DAT1 A10 allele, compared with all other genotype groups. Additional studies are needed to more fully elucidate the biological underpinnings and clinical significance of this epistatic effect. For example, studies combining alcohol administration with PET imaging are well positioned to test the neural substrates of the OPRM1 × DAT1 interaction by quantifying dopaminergic output in the striatum during alcohol intake across genotype groups. Clinically, it would be intriguing to analyze existing treatment trials of naltrexone in order to test whether the addition of DAT1 genotype to previous OPRM1 analyses can further identify treatment responders. Finally, a larger replication study in across multiple sites using a standard assessment and alcohol administration paradigm after genotyping would enhance the validity of these results. If supported by further studies, particularly translational investigations of individuals' responses to alcohol and/or naltrexone, the present findings may help identify genetic subgroups that could preferentially benefit from pharmacological interventions targeting the rewarding properties of alcohol.
Funding
This study was supported by grants from ABMRF, the Foundation for Alcohol Research, and the UCLA Clinical and Translational Science Institute, National Institutes of Health (M01-RR00865—L.A.R.).
Conflict of interest statement
R.F.A. reports being a consultant on the scientific advisory board for Alkermes, Lundbeck, and Sun Pharma. Additionally, he has received support from Eli Lilly, Lundbeck, Abbvie, Pfizer and Ethypharm as part of the Alcohol Clinical Trials workgroup (ACTIVE). He also has received research contracts/grants from Eli Lilly. L.A.R. reports being a consultant for GSK and has received funding from Pfizer.
Acknowledgements
The authors thank Eliza Hart, Andia Heydari, Pauline Chin, Kelly Courtney, Nathasha Moallem, Molly Tartter, Belinda De La Torre and Ryan Arellano for their contribution to data collection and data management for this project.
