


Abstract
There is ongoing debate about how and why the menstrual cycle affects women’s attraction to men. According to the dual sexuality hypothesis, women form pair-bond relationships with men who provide care but also obtain genetic benefits by biasing mating effort towards men with high-fitness genes during the fertile phase. By contrast, the commitment hypothesis proposes that attachment bonds with primary partners function to strengthen pair-bond relationships by enhancing in-pair attraction at the fertile phase, rather than extrapair attraction. We tested these hypotheses by measuring women’s daily sexual and emotional attraction towards men over the whole menstrual cycle. We employed 1) a urinary luteinizing hormone test to determine the day of ovulation, 2) a 5-part classification of menstrual cycle that identifies a distinct peri-ovulatory phase, and 3) individualized phase identification for each participant. There was a mid-cycle rise in extrapair sexual desire. Women gave and received more care from partners during the menstrual than the mid-cycle phases. Partner’s sexual attractiveness and mutual commitment did not moderate these findings. The results do not support either the dual sexuality or commitment hypotheses, and imply that female self-reported sexual desire is not strictly dependent on cyclic hormonal changes. Our results are more consistent with a recently proposed `spandrel’ hypothesis, positing cycle phase effects as a nonfunctional by-product of raised estradiol. Additionally, we found that, with the date of ovulation estimated by luteinizing hormone tests, 45% of ovulations were misclassified by the backward counting method, which urges caution in interpreting results based on counting methods.
INTRODUCTION
There has been debate about the extent to which women’s attraction to in-pair and extrapair partners fluctuates over the menstrual cycle. According to the “dual sexuality” hypothesis (reviewed in Thornhill and Gangestad 2008), women pursue a dual sexuality strategy, favoring genetic quality in males with whom they mate whilst forming long-term pair-bonds with males that provide care and/or resources. Evidence is provided by studies showing that during periods of peak fertility and when seeking short-term partners, women’s sexual preferences shift to favor men who possess phenotypic indicators of “good genes”, such as low fluctuating asymmetry (signaling developmental stability) and more masculine traits such as androgen-mediated olfactory cues (Havlicek et al. 2005; Thornhill et al. 2013) and dimorphic facial shape (Penton-Voak et al. 1999, but see Gildersleeve et al. 2014a). Such testosterone-dependent traits in sexually selected species are thought to be costly and therefore honest signals of condition because high circulating levels of testosterone compromise immune responses (Folstad and Karter 1992). Partnered women whose mates are of lower genetic quality are proposed to be especially likely to be attracted to extrapair mates during peak fertility (Gangestad et al. 2005). Supporting this, women with less sexually desirable partners experience greater sexual attraction to other men when fertile and, in some cases, a decrease in attraction to their primary partner (Larson et al. 2012). According to the dual sexuality argument, the extent to which the primary partner lacks phenotypic indicators of gene quality moderates the strength of women’s extrapair sexual desire.
An alternative hypothesis—the “commitment” hypothesis—implicates pair-bond attachment as a key moderator. Eastwick and Finkel (2012) argued that, because the evolution of the ovulatory shift adaptation is likely to have preceded the reproductive pair bonds, a new adaptation has occurred to counter this cycle shift effect, thereby supporting intersexual cooperation and reducing antagonistic coevolution. This adaptation depends upon the attachment bond which cements long-term commitment and redirects women’s sexual desire at high fertility toward the partner, rather than to extrapair men. In support of this, they found that women who were strongly bonded to their partner experienced more intimate physical contact with them on high fertility days. In weakly-bonded women however, peak fertility was associated with decreased intimate contact with their partner. These 2 hypotheses make specific predictions regarding the interaction between their favored moderator (sexual attractiveness or relationship commitment) and cycle phase on women’s evaluations of their long-term relationships and desire for in-pair and extrapair men.
Previous studies have not produced consistent findings. Congruent with the commitment hypothesis, Pillsworth et al. (2004) found that extrapair desire during the fertile phase was reduced by relationship satisfaction. However, other findings have failed to find support. Although Pillsworth et al. (2004) found in-pair sexual desire was higher on more fertile days, this effect was not moderated by relationship commitment, satisfaction or length. Similarly, Larson et al. (2012) found no evidence that relationship quality or length moderated fertility-related changes in in-pair or extrapair attraction. Larson et al. (2013) included a measure of investment attractiveness, operationalized as high financial status and desirability as a long-term partner. To the extent that women’s positive evaluation of these qualities might be associated with greater commitment to the relationship, the commitment hypothesis would predict an interaction between partner’s investment attractiveness and women’s ratings of relationship quality at high versus low fertility. However (and contrary to prediction) the only (marginally) significant interaction indicated that women partnered with men of high investment attractiveness reported decreased (rather than increased) closeness at high compared to low fertility. Pillsworth and Haselton (2006) found no interaction between investment attractiveness and phase on either in-pair or extrapair sexual desire. The bulk of empirical research to date has been inspired by and has preferentially supported the dual sexuality hypothesis. In the most detailed analysis of relationship variables to date (Larson et al. 2013), phase interacted with ratings of partner’s sexual attractiveness for 3 measures of relationship quality (satisfaction, closeness, faults, and virtues). Women partnered by more sexually attractive men felt closer to them and more satisfied with the relationship during the fertile phase than the nonfertile phase. Women with less attractive partners experienced decreased closeness and found more faults with them at high versus low fertility.
Two recent meta-analyses of over 50 studies, which examined potential cycle shift effects on purported “good gene” traits, reached different conclusions about the strength of support for the cycle shift effect (Gildersleeve et al. 2014a; Wood et al. 2014). The fierce debate about this inconsistency (Harris et al. 2014; Wood and Carden 2014; Gildersleeve et al. 2014b) centered upon 3 key methodological issues which we address in the design of the present study. One important issue concerns the estimation of the fertile period. There is wide variation in the placement and size of the fertile window used by researchers. The majority of studies base their estimate on the reported date of previous menses or the expected or actual date of next menses, assuming a 28-day cycle (despite evidence of wide variability in cycle length, Münster et al. 1992). For instance, in studies reviewed in Gildersleeve et al.’s (2014a) meta-analyses (data collection ended in December 2012), around 92% of studies published before 2010 and 83% of studies published after 2010 used counting methods (see Gonzales and Ferrer 2016). Ovulation is estimated using either a forward counting (from the first day of last menses) or backward counting (from first day of the next menses) methods, with the latter method proving the more valid estimate (Gangestad et al. 2016). The number of days included in the fertile period has ranged from 5 to 11 (Harris et al. 2013). Other researchers use a continuous measure of the probability of pregnancy from a single act of intercourse on the day of data collection (calculated by Wilcox et al. 2001). Importantly, these methods are not very accurate in assessing whether or when ovulation occurred. The most precise procedure to identify the ovulation might be transvaginal ultrasonography (e.g., see Cobey et al. 2013). However, it is both invasive and costly. Since the menstrual cycle is under the control of 4 primary hormones—follicle-stimulating hormone, luteinizing hormone (LH), estrogen, and progesterone—it is possible to estimate the timing of ovulation by measuring hormonal fluctuations. These methods include measurement of daily hormone levels (e.g., Direito et al. 2013), assessment of weekly hormone levels (e.g., Hahn et al. 2016), and the combination of counting and hormonal methods (e.g., Roney et al. 2011). Another less costly method is the measurement of LH alone. A sudden surge in LH triggers ovulation; therefore, ovulation can be conveniently estimated by the use of commercial instant tests which assay LH surge (e.g., see Gangestad et al. 2005; Pillsworth and Haselton 2006; Larson et al. 2013). These hormonal methods are naturally sensitive to individual differences in the way hormones fluctuate and how it affects women’s cycles. Regarding LH, a study showed that in 75% of cycles ovulation occurred around the first LH surge (Direito et al. 2013), implying that the accuracy of LH tests can be improved by administering tests daily until the initiation of an LH surge (Gangestad et al. 2016). In our study, we administered LH tests daily during individually tailored test windows. We use it in the current study to establish a distinct 6-day peri-ovulatory phase during which conception is most likely (Wilcox et al. 1995).
A second concern is with study design. Some studies employ a between-groups design comparing fertile and nonfertile groups on a dependent variable of interest. A repeated measures design is preferable because it reduces the noise associated with between-group analysis and dramatically reduces the sample size required to achieve adequate power (Gangestad et al. 2016). However, most studies to date have employed a between subjects design (e.g., 62% of reviewed studies in Gildersleeve et al. 2014a’s meta-analysis study, see Gonzales and Ferrer 2016) and taken only 2 measures, one each from fertile and nonfertile phases. Measurement reliability is increased by aggregation, so we employed a daily diary method to calculate ratings across an entire menstrual cycle. This also allowed us to more accurately record the date of menses onset rather than relying on the recollection of participants, around 20% of which is erroneous by at least 3 days (Wegienka and Baird 2005).
A third issue is the importance of tailoring phases to the individual cycle of each participant. Rather than assuming a 28-day cycle, we individualized each participant’s cycle by calculating 5 phases (menstrual, follicular, peri-ovulatory, luteal, premenstrual). This also permits a more sensitive analysis by identifying a peri-ovulatory phase (when fertilization is possible), distinct from the broader follicular phase which is sometimes used as a proxy for the fertile window. We also distinguish the premenstrual phase from the broader luteal phase in light of the fact that up to 80% of women experience negative premenstrual psychological changes, as well as a significant decrease in sexual desire (Yang et al. 2010).
The primary aim of the study was to examine cycle phase effects, specifically whether they are moderated by partner physical attractiveness (PA) or by mutual commitment (MC). A secondary aim was to address the methodological debate about the potential impact of differences in estimating fertile and nonfertile phases. We reanalyzed our data following the description given by Haselton and Gangestad (2006) in their report of how partner’s sexual-versus-investment attractiveness (SIA) moderated cycle phase effects on extrapair attraction. Their analysis employed a within-participant 2-phase classification scheme. We compared these results with those obtained using our 5-phase scheme individually tailored around the hormonally-estimated day of ovulation.
Recently, after the completion of our study, Havlíček et al. (2015a) proposed a “spandrel” hypothesis which asserts that the within-cycle shift in women’s mate preferences is not in itself an adaptation, but is instead a by-product of the calibration of individuals’ behavior to their levels of reproductive hormones and associated attractiveness. Although there is no uniform agreement about which hormones are specifically associated with sexual desire, evidence suggests that estradiol was positively and progesterone was negatively associated with female sexual desire (Roney and Simmons 2013; Roney and Simmons 2016). Estradiol is known to increase around ovulation and progesterone to peak at the mid-luteal phase (reviewed in Barbieri 2014). Thus, the spandrel hypothesis views the cycle shift effect as a nonfunctional by-product of raised estradiol. In the discussion section, we will mention some connections between our work and this new hypothesis.
METHODS
Participants
Participants were 40 naturally cycling heterosexual women who received a nominal payment and/or course credits for their participation. They were recruited through a participant pool in a psychology department (Durham University) or via social networking systems outside the department. Of the original sample of 40 women, 5 women were dropped from the analysis due to the use of mood-altering medication, relationship termination, illness, or irregular menses. The final sample was composed of 35 women (median age = 20.0 year old 95% CI [20.50, 24.30]) all of whom were in a committed romantic relationship (median relationship length = 1.88 years 95% CI [1.79, 4.63]). The women described themselves as European (63%), Asian (31%), North American (3%), and South American (3%). One of the women had 2 children. Having children could plausibly affect women’s sexual desire, but it was not possible to test the effect, since there was only one relevant participant in our sample. Nonetheless, exclusion of this woman’s data did not alter results and her data were retained.
Procedure
The study was approved by the Durham University Psychology Committee on Ethics. At an initial session, the study was explained to participants and they gave informed consent. They provided demographic information and completed an evaluation of their partner (see below). Participants were provided with urinary LH test sticks (Clearblue® Easy Digital Ovulation Test) and given directions on how to use the tests.
After the initial session, participants completed daily questionnaires via a dedicated website. After participants notified us via email that they had started their menses, they were emailed a link to the online questionnaire every morning. This acted as a daily reminder for participants and enabled us to send a special reminder during a LH test window (see below). The reminders and links continued until participants informed us of the onset of their next menses. Participants were not able to see their previous responses.
Participants took the LH tests during their cycle. LH surge generally occurs 36–44 h prior to ovulation (reviewed in Barbieri 2014), and ovulation is believed to occur 15 days prior to the onset of next menstruation in a standard 28-day cycle (Gangestad et al. 2016). In order to schedule the LH test window tailored to each woman, information about the date of the first day of previous menses, usual cycle length, and the length of her previous cycle (obtained at the initial session) was used in conjunction with the date of the onset of her next menses (emailed by the participant on the day she began her daily ratings) to identify the predicted date of her subsequent menses. The likely date of ovulation was then estimated using the backward counting method. Women were asked to test daily for 10 days, beginning 5 days before the estimated LH surge day.
MEASURES
Intake questionnaire
At an initial meeting, participants provided information on age, ethnicity, use of hormonal contraceptives, menstrual cycles, and length of current relationship with their primary partner. Participants rated their partner’s PA (“How physically attractive is your partner?”), level of commitment from and to their partners (“How committed is your partner to you?” and “How committed are you to your partner?”), and level of partner’s financial security (“How financially secure is your partner?”) using a visual analogue scale (0 = Not at all to 100 = Very).
Daily questionnaires
The daily questionnaire was composed of 8 items. Six items were designed to assess 6 pair-bond relationship dimensions derived from a previous factor analytic study (Shimoda 2014). These were: Obsession, “My partner always seems to be on my mind.”; Care-receiving, “I feel that my partner understand me when I have a hard time.”; Care-giving, “I am prepared to be counted on by my partner and I will always be there for and care about my partner in times of need.”; Separation distress, “I would feel despair if my partner left me.”; In-pair sexual desire, “How strong is your desire to engage in sexual activity with your partner?”; and Extrapair sexual desire, “How strong is your desire to engage in sexual activity with a person you find attractive (not your partner)?”. Participants were instructed to think about their feelings on that day and rate the applicability of the 6 statements on a 5-point scale (Disagree Strongly to Agree Strongly for emotional items and No Desire to Very Strong Desire for sexual desire items). Participants also rated their mood, “How is your mood right now?” (Worst = 0 to Best = 100). In a 10-day window during which women used the test sticks daily, they were also asked to report the result of their ovulation tests.
Menstrual phase coding
The cycle was divided into 5 phases as follows. The mean length of menstruation is 5 days (reviewed in Barbieri 2014); hence, the 5 consecutive days from the onset of menses were coded as the menstrual phase. Conception probability is highest during a 6-day interval that ends in ovulation day (Wilcox et al. 1995). Thus, the peri-ovulatory phase of peak fertility was coded as 6 successive days (from 4 days before the day of LH surge to 1 day after the day of LH surge). With these milestones established, the follicular phase was identified as the time between the end of menstruation and the start of the peri-ovulatory phase, the luteal phase as the interval between the end of the peri-ovulatory phase and 3 days prior the reported onset of the next menses, and these 3 premenstrual days as the premenstrual phase. Hence, whereas the length of the menstrual, peri-ovulatory, and premenstrual phases was common to all participants, the length of the follicular and luteal phases differed depending on each individual’s cycle.
Statistical analyses
A 2-level linear mixed model (SPSS 23 IBM) was used to analyze the daily reports of the 6 relationship measures (i.e., obsession, care-giving, care-receiving, separation distress, in-pair and extrapair sexual desire). The daily reports (level 1) nested within participants (level 2). We first examined whether the 6 relationship measures varied as a function of cycle phase (Model 1). This base model was constructed from cycle phase as a within-subjects variable with 5 time points (menstrual, follicular, peri-ovulatory, luteal, premenstrual phases). We also included an intercept for participants as a random effect. A random slope for participants was not added as it yielded convergence problems. Mood may vary systematically over the cycle for hormonal and lifestyle reasons. Thus, a main cycle effect on mood was also tested (with the intercept also allowed to vary randomly, Model 2). We also entered mood as a time-varying covariate to the base model (Model 3). We then examined whether the partner’s PA or the couples’ MC moderated the effect of phase on any of the 6 dependent measures. Women’s evaluations of their partners’ PA and MC (created by summing commitment to and from partners) were entered into the base model simultaneously as between-subjects covariates to examine interactions with cycle phase on the 6 relationship measures (Model 4). These variables were mean centered so that main effects of phase would be estimated at mean levels of partner ratings. Pairwise contrasts were conducted to compare each phase. We used a first-order autoregressive covariance structure for the repeated measurements. The estimation method was restricted maximum likelihood.
Additionally, we reanalyzed our data using SIA as a moderator in a 2-phase classification scheme. We adopted the scheme used by Haselton and Gangestad (2006) due to their clear description of the decision rules used to assign participants to fertile and nonfertile phases. To mimic their SIA variable (“sexual attractiveness” minus “long-term attractiveness” in their study), SIA was estimated by subtracting women’s ratings of their partner’s financial security from PA ratings. SIA represents the extent to which men have relatively more long-term (indicated by negative values) or short-term (indicated by positive values) partner qualities (Haselton and Gangestad 2006). We also recoded our data so that phase was a binary independent variable (fertile versus infertile). Fertile days included the estimated day of ovulation (i.e., 15 days prior to the onset of the next menses) and the 4 days preceding it. Infertile days spanned from the third day immediately following the estimated day of ovulation to 3 days prior to menstruation. There were 34 women in the analyses (one participant who took emergency contraceptives was excluded). Using the 2 phases as a repeated measures variable and SIA (mean-centered) as the covariate, we used repeated measure analysis of covariance with the 6 dependent measures being the average of each scale computed for each phase. Following interactions, tests of simple effects were conducted using directed tests (see Rice and Gaines, 1994; Haselton and Gangestad, 2006), assigning a critical value of P < 0.04 to the predicted direction and P < 0.01 to the unpredicted direction (Pdir). This analysis was repeated using our 5-phase classification.
RESULTS
Preanalyses
Participants completed an evaluation of their partner and relationship at the initial session, which was scheduled randomly. This could be an issue as the evaluation could be influenced by cycle phase effect. Using the dates of the initial sessions, the dates of the onset of previous menses (a cycle just before participating in our study), and the cycle patterns found in our study, we made a rough estimation of which phases women were in on the initial session day. The distribution was estimated as 22.9%, 17.1%, 22.9%, 25.7%, and 11.4% for the menstrual, follicular, peri-ovulatory, luteal, and premenstrual phases, respectively. We compared the expected and observed frequencies of initial sessions in each phase using a one-sample chi-square test. For the menstrual, peri-ovulatory, and premenstrual phases, the phase length was fixed for every woman in the current study design, which was 5, 6, and 3, respectively. For the follicular and luteal phases, the observed median length of phases was 6 and 10, respectively. Thus, with 35 samples, the minimum expected count of initial sessions was less than 5 (3.5) for the premenstrual phase. Following the recommendation (McDonald 2014), we pooled the premenstrual phase with the adjacent luteal phase. A result showed that the expected and observed frequencies of initial sessions were not significantly different from each other, χ2(3) = 1.40, exact P = 0.70. In addition, a Kruskal-Wallis H test was conducted to determine whether scores of partner PA and MC were different across the 4 phases (the luteal and premenstrual phases were pooled). Levene’s test indicated that homogeneity of variance assumption was met for partner attractiveness (P = 0.33) and MC (P = 0.50). Median scores for the menstrual, follicular, peri-ovulatory, and luteal/premenstrual phases for partner PA were 80.0, 89.0, 73.0, and 77.0, and for MC 191.0, 190.0, 176.5, and 183.0, respectively. Results showed that the scores were not significantly different across the phases for partner attractiveness, χ2(3) = 7.52, P = 0.06, and MC, χ2(3) = 3.27, P = 0.35. The potential cycle phase effect on the partner evaluation could not be controlled, but these rough analyses indicated that the initial sessions were distributed throughout the cycle, and the scores did not differ among phases.
Values of skewness and kurtosis showed departures from normality for care-giving, separation distress, extrapair sexual desire, and MC. Regarding partner PA, one case had an extremely low score (z = −3.84). In keeping with the recommended practice (Tabachnick and Fidell 2013), the 5 variables were log or square root transformed. It improved the normality of these variables and there was no outlier in the transformed values.
Menstrual cycles
The participants returned a total of 957 valid daily reports. The numbers of the valid reports at each phase were 162, 229, 195, 285, and 86 for the menstrual, follicular, peri-ovulatory, luteal, and premenstrual phases, respectively. One woman took emergency contraceptives on day 17 (she reported a positive result on LH test on day 13). Thus, her data after day 17 was not included in the study. In total, 7.4% of the menstrual phase, 5.4% of the follicular phase, 7.1% of the peri-ovulatory phase, 12.0% of the luteal phase, and 15.7% for the premenstrual phase were missing. We used a repeated measures ANOVA to test whether the frequency of missingness varied across the phases. Repeated factors were the proportion of missingness per phase calculated for each participant (excluding the participant who dropped after day 17). Mauchly’s test of sphericity indicated that the assumption of sphericity was violated, χ2(9) = 25.03, P = 0.003, thus a Greenhouse-Geisser correction was used. The result showed that the frequencies of missingness were not significantly differed across the 5 phases, F2.92, 93.51 = 2.21, P = 0.09. Furthermore, although having missing data and unequal numbers of observations per individual could be an issue for traditional analysis of variance models, a linear mixed model is rather robust to missing data and unbalanced designs (reviewed in Gibbons et al. 2010).
The observed mean cycle length was 30.47 days, ranging from 24 to 40 days (excluding the participant who dropped after day 17). This was an average of 2.82 days longer than the self-reported cycle length. On average, women reported positive results on LH tests 7.13 days from the onset of scheduled test window. One participant (the one who took emergency contraceptives) had a positive test result on the day she started to use the test sticks. Thus, for this participant, the estimated fertile window had a lower accuracy (see Introduction for details). Exclusion of this woman’s data did not alter the results and her data were retained.
Three women showed no LH surge despite taking LH tests on the specified dates. This might have been caused by a technical problem with the test, an anovulatory cycle, or an improperly scheduled test window. The last possibility seems probable as these women had a current cycle length 6 days longer or shorter than their previous one. For these women, LH surge date was estimated by a 15-day backward counting method (Exclusion of these women’s data did not alter the results, thus they were kept in the analyses to increase statistical power). For the LH surge observed participants (n = 31, excluding the participant dropped after day 17), the mean interval between LH surge and the first day of subsequent menstruation was 14.19 days. However, this interval varied markedly from 6 to 21 days. Two women experienced LH surge 6 and 8 days respectively before their next menses and therefore had an unusually short luteal phase. These data indicate the potential for distortion when calculations of ovulation dates are based on calculations assuming a 28-day cycle length.
Cycle effects on mood and the 6 relationship measures
We tested a main cycle effect on the 6 relationship measures and mood in Model 1 and Model 2, respectively. Mood was also entered as a time-varying covariate in Model 3. According to the dual sexuality hypothesis, women partnered with less physically attractive men should show heightened sexual interest in extrapair men and decreased attraction towards their partners during the peri-ovulatory phase compared to other phases. The commitment hypothesis predicts that women with higher level of MC should experience an increased level of attraction towards their partners and a decreased level of attraction towards other men during the peri-ovulatory phase relative to other phases. In Model 4, we examined whether PA or MC moderated the effect of phase on the 6 relationship measures. Table 1 shows summaries of F tests for each of the fixed effects for Models 1, 3, and 4.
Summaries of F tests for fixed effects on the 6 relationship measures in Models 1, 3, and 4
| Models | Obsession | Receiving | Giving | Separation | In-pair desire | Extrapair desire | |
|---|---|---|---|---|---|---|---|
| 1 | Cycle | 0.83 (0.51) | 2.97 (0.02) | 1.53 (0.19) | 1.45 (0.22) | 2.19 (0.07) | 3.40 (0.01) |
| 4,384.06 | 4,373.07 | 4,366.20 | 4,371.75 | 4,392.05 | 4,376.74 | ||
| 3 | Cycle | 1.16 (0.33) | 5.62 (0.001) | 2.64 (0.03) | 1.92 (0.11) | 1.23 (0.30) | 2.91 (0.02) |
| 4,377.09 | 4,371.50 | 4,360.02 | 4,361.75 | 4,380.48 | 4,374.48 | ||
| Mood | 20.83 (0.001) | 62.37 (0.001) | 45.53 (0.001) | 9.32 (0.002) | 96.50 (0.001) | 1.45 (0.23) | |
| 1,879.37 | 1,917.73 | 1,914.55 | 1,906.47 | 1,893,30 | 1,920.44 | ||
| 4 | Cycle | 0.86 (0.49) | 2.71 (0.03) | 1.45 (0.22) | 1.35 (0.25) | 2.22 (0.07) | 3.62 (0.01) |
| 4,371.21 | 4,362.78 | 4,357.97 | 4,363.15 | 4,383.18 | 4,369.06 | ||
| PA | 0.84 (0.37) | 2.32 (0.14) | 0.71 (0.41) | 0.07 (0.79) | 1.58 (0.22) | 1.59 (0.22) | |
| 1,32.56 | 1,32.18 | 1,32.34 | 1,32.06 | 1,32.56 | 1,33.06 | ||
| MC | 7.63 (0.01) | 2.99 (0.09) | 8.69 (0.01) | 10.24 (0.003) | 0.50 (0.49) | 7.02 (0.01) | |
| 1,32.82 | 1,32.45 | 1,32.59 | 1,32.21 | 1,33.06 | 1,33.61 | ||
| PA×Cycle | 0.68 (0.60) | 1.14 (0.34) | 0.89 (0.47) | 0.43 (0.79) | 0.79 (0.53) | 1.89 (0.11) | |
| 4,367.57 | 4,359.06 | 4,354.32 | 4,360.02 | 4,378.72 | 4,364.73 | ||
| MC×Cycle | 1.44 (0.22) | 1.40 (0.23) | 0.54 (0.71) | 0.97 (0.43) | 0.82 (0.52) | 1.37 (0.24) | |
| 4,369.64 | 4,362.62 | 4,357.83 | 4,362.92 | 4,381.75 | 4,368.74 | ||
PA, MC, and × represent physical attractiveness, mutual commitment, and interactions, respectively. Reported numbers are F-values, P- values (in brackets), and df (in italic). Significant figures are shown in bold.
MC, mutual commitment; PA, physical attractiveness.
Mood
There was a significant main effect of cycle phase on mood (Model 2), F4, 366.11 = 6.74, P < 0.001. Pairwise comparisons showed that women scored significantly lower at the menstrual phase than at all other phases: the follicular (P < 0.001); peri-ovulatory (P = 0.002); luteal (P < 0.001); and premenstrual phases (P < 0.001). When mood was entered as a time-varying covariate (Model 3), mood had a significant effect and positively predicted obsession (b = 0.006, t879.37 = 4.56, P < 0.001), care-receiving (b = 0.01, t917.73 = 7.90, P < 0.001), care-giving (b = 0.002, t914.55 = 6.75, P < 0.001), separation distress (b = 0.001, t906.47 = 3.05, P = 0.002), and partner-directed desire (b = 0.02, t893.30 = 9.82, P < 0.001). There was no significant association between mood and extrapair sexual desire.
Obsession
The main effect of cycle phase was not significant (Model 1). When PA and MC were added to the model (Model 4), MC had a significant effect and positively predicted obsession (b = 0.41, t49.25 = 2.20, P = 0.03). Controlling for PA and MC did not alter the results of the initial analysis. The main effect of PA, interactions between PA and cycle phase and between MC and cycle phase had no significant effect on obsession.
Care-receiving
The main effect of cycle phase was significant (Model 1). An inspection of Figure 1 reveals that the lowest scores were in the peri-ovulatory and luteal phases. Pairwise comparisons showed that women reported significantly higher scores at the menstrual phase than at the follicular (P = 0.02), peri-ovulatory (P = 0.01), and luteal phases (P = 0.001). Controlling for PA and MC (Model 4) did not alter the results of the initial analysis. The main effect of PA, MC, interactions between PA and cycle phase and between MC and cycle phase had no significant effect on care-receiving.
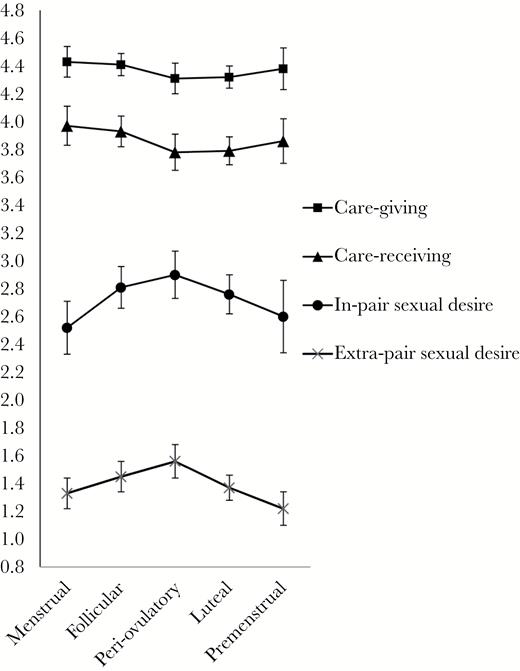
Raw mean scores of care-giving, care-receiving, in-pair sexual desire, and extra-pair sexual desire as a function of menstrual cycle phase.
Care-giving
The main effect of cycle phase was not significant (Model 1). When mood was entered as a time-varying covariate (Model 3), a main effect of cycle phase on care-giving became significant. Mirroring the patterns found for care-receiving (see also Figure 1), women reported significantly higher scores at the menstrual phase than at the follicular (P = 0.02), peri-ovulatory (P = 0.01), and luteal phases (P = 0.01). These results imply that the relation between cycle phase and care-giving initially appeared absent, because lower mood (which had a positive relation with care-giving) during the menstrual phase was suppressing the cycle phase effect (which was associated with higher care-giving during the menstrual phase). When PA and MC were entered to the model (Model 4), MC had a significant effect and positively predicted care-giving (b = 0.09, t46.51 = 2.70, P = 0.01). Controlling for PA and MC did not alter the results of the initial analysis. The main effect of PA, interactions between PA and cycle phase and between MC and cycle phase had no significant effect on care-giving.
Separation distress
The main effect of cycle phase was not significant (Model 1). When PA and MC were added to the model (Model 4), MC had a significant effect and positively predicted separation distress (b = 0.13, t39.96 = 3.11, P = 0.003). Controlling for PA and MC did not alter the result of the initial analysis. The main effect of PA, interactions between PA and cycle phase and between MC and cycle phase had no significant effect on separation distress.
In-pair sexual desire
Although Figure 1 shows a curvilinear relationship peaking at the peri-ovulatory phase, the main effect of cycle phase was not statistically significant (Model 1). Controlling for PA and MC (Model 4) did not change the results of the initial analysis. The main effect of PA, MC, interactions between PA and cycle phase and between MC and cycle phase had no significant effect on separation distress.
Extrapair sexual desire
The main effect of cycle phase was significant (Model 1). Figure 1 shows a curvilinear relationship peaking at the peri-ovulatory phase. Pairwise comparisons showed that compared to the peri-ovulatory phase, women reported significantly lower scores at the menstrual (P = 0.01), luteal (P = 0.01), and premenstrual phases (P = 0.002). Scores during the follicular phase were higher than at the premenstrual phase (P = 0.04). A difference between the peri-ovulatory and the follicular phases was not significant (P = 0.14). These results showed a mid-cycle rise for extrapair sexual desire. When PA and MC were added to the model (Model 4), MC negatively predicted extrapair sexual desire (b = −0.10, t73.50 = −2.71, P = 0.01). Controlling for PA and MC did not alter the result of the initial analysis. The main effect of PA, interactions between PA and cycle phase and between MC and cycle phase had no significant effect on care-receiving.
Comparisons between in-pair and extrapair sexual desires
Figure 1 shows that in-pair sexual desire was consistently higher than extrapair sexual desire. We used paired-samples t-tests to compare in-pair and extrapair sexual desires (untransformed) in each of the 5 phases. There were significant differences across all pairs: the menstrual phase, t(161) = 11.68, P < 0.001; the follicular phase, t(228) = 15.75, P < 0.001; the peri-ovulatory phase, t(194) = 13.88, P < 0.001; the luteal phase, t(284) = 16.57, P < 0.001; and the premenstrual phase, t(85) = 10.88, P < 0.001.
Moderation by SIA: a comparison of classification systems
Haselton and Gangestad (2006) found support for the prediction of the dual sexuality hypothesis that women partnered with men who had lower SIA would show increased sexual desire towards other men at fertile relative to nonfertile phases. We reanalyzed our data with SIA as a moderator in the 2-phase classification scheme. No significant effect of phase was found for any of the measures. Whereas our initial analysis revealed a cycle phase effect for care-receiving and extrapair sexual desire, neither of these was significant in the 2-phase analysis, F1,32 = 0.50, P = 0.49, and F1,32 = 0.43, P = 0.52, respectively. However, replicating Haselton and Gangestad (2006) findings, there was a significant interaction between cycle phase and SIA on extrapair desire, F1,32 = 5.36, P = 0.03. In order to examine the cycle phase effect among participants whose partners had higher and lower SIA, SIA was recentered at 1 standard deviation (SD) above the mean (those with relatively greater short-term attractiveness) and below the mean (those with relatively greater long-term attractiveness). However, no cycle phase effect was found when partner SIA scores were one SD above (marginal mean for a fertile phase = 1.37 and for a nonfertile phase = 1.67, F1, 32 = 4.44, Pdir = 0.02, the unpredicted direction P > 0.01) or below the means (marginal means for fertile phase = 1.51 and for nonfertile phase = 1.34, F1,32 = 1.42, Pdir = 0.12). This did not support the prediction of the dual sexuality hypothesis. It is also worth noting that in our recoded data, 14 out of 31 (45%) ovulation days detected by LH surge were categorized by Haselton and Gangestad’s (2006) criteria as “nonfertile”.
When our 5-phase classification scheme was applied, a cycle phase effect on extrapair sexual desire was significant, F2.66, 85.24 = 3.57, P = 0.02 (with Greenhouse-Geisser correction). Pairwise comparisons showed that women scored significantly lower at the premenstrual phase than at the follicular (Pdir = 0.01) and peri-ovulatory phases (Pdir = 0.01). The main effects of cycle on the other 5 measures were not significant. The interaction between cycle phase and SIA was not significant for extrapair sexual desire or for the other 5 measures.
DISCUSSION
Lack of support for the commitment and dual sexuality hypotheses
We found no support for the commitment hypothesis. In-pair sexual desire was not greater at the peri-ovulatory phase for women with high levels of MC, nor was extrapair desire weaker. Eastwick and Finkel’s (2012) test of the commitment hypothesis focused on intimate physical contact but this was chosen to represent a variable that “could plausibly strengthen (or, by its absence, weaken) intersexual cooperation” (p. 176). Our measures of obsession, care-giving, care-receiving, and separation distress can also be seen as fulfilling this function, without containing physical contact components. Indeed, women with higher levels of MC to their partner scored significantly higher on these measures. Nevertheless, MC did not moderate cycle phase effects for any of the measures.
Nor did we find evidence for the dual sexuality proposal. Although sexual desire for extrapair men was higher during the peri-ovulatory phase compared to the menstrual, luteal, and premenstrual phases, partner PA did not moderate this effect. Null results are not unprecedented. Of 8 studies which have examined the moderating effect of partner attractiveness, 6 found support for increased extrapair attraction at fertile versus nonfertile phases while one found support for reduced in-pair desire at ovulation (see Larson et al. 2012). It should be noted that, given the small sample size, there might have been insufficient variation in partner PA and MC to detect the moderating effects. Indeed, most women in our study scored relatively highly in both variables. In this sense, we are unable to conclusively treat these null findings as replication failures.
Our sample size is relatively small, but we note that a sample size of N = 38 has 70% power to detect a true effect size of d = 0.5 (Gangestad et al. 2016), given measurement accuracy of 85% for LH tests and a between-phase correlation of r = 0.5 (average correlations across the phases were all above r = 0.48 for the 6 relationship measures). The loss of 5 participants reduced statistical power. Nevertheless, our sample was larger than some repeated-measures studies in paired-women that have reported positive results (N = 31 in Gangestad et al. 2002; N = 24 in Haselton and Gangestad 2006; N = 20 in Eastwick and Finkel 2012). Moreover, some studies reported large interaction effects between fertility and partner attractiveness on emotional closeness (N = 41 and 67 in Study 1 and Study 2, respectively, in Larson et al. 2013) and on in-pair and extrapair sexual attraction (N = 41 in Larson et al. 2012). According to the conventional sample size recommendations for linear mixed models, 957 daily reports for level-1 unit and 35 participants for level-2 unit had an acceptable statistical power for level 1 and level 2 predictors (Bell et al. 2010).
In summary, in-pair sexual desire did not peak at the peri-ovulatory phase, and levels of MC did not moderate the cycle phase effects in any of the 6 relationship measures. These findings did not support the commitment hypothesis. Our study also did not provide positive evidence for the dual sexuality hypothesis. Although extrapair sexual desire was highest at the mid phases, in-pair sexual desire was significantly greater than extrapair sexual desire throughout the cycle, and partner attractiveness did not moderate the cycle phase effects in both types of sexual desires. Our results could be more consistent with the spandrel hypothesis than the 2 adaptive explanations, suggesting that between-individual differences should be given more attention.
The main effect of cycle phase on the 6 relationship measures
The main cycle phase effect was found for sexual desire for others, care-receiving, and care-giving. Regarding sexual desire measures, plots over the cycles of both in-pair and extrapair sexual desire showed a mid-cycle rise (Figure 1). This is in line with a considerable body of work showing a peri-ovulatory peak in sexual desire (e.g., Roney and Simmons 2013), sexual fantasies, and sexual activity, including female-initiated sex (e.g., Gangestad et al. 2002). Although the plots showed a mid-cycle rise for both types of sexual desire, the cycle phase effect was statistically significant only for extrapair desire. This naturally prompts consideration of factors that might affect in-pair and extrapair sexual desire. We discuss 4 possible considerations.
One possibility is mood. Indeed, mood varied significantly across the cycle, and positively predicted partner-directed emotional and sexual measures. However, it did not mediate the relationship between the main cycle phase effect and in-pair sexual desire.
A second possible explanation is that our results reflect demand characteristics (Orne et al. 2000), which refers to participants anticipating the purpose of study and altering their responses accordingly (and such a critique would also apply for other cycle studies). However, the fact that there was no significant difference between the follicular and peri-ovulatory phases makes this unlikely. If participants’ knowledge of their positive LH test results or of the dual sexuality hypothesis could influence their levels of extrapair sexual desire, we would expect to see a sudden increase in desire at the peri-ovulatory phase (i.e., when they read their positive results).
A third possibility to explain the null finding for the main cycle phase effect for in-pair sexual desire is that overall female hormonal levels moderated the size of cycle phase effects in a way consistent with the spandrel hypothesis (Havlíček et al. 2015a). This hypothesis implies that women with higher levels of estrogen are more physically attractive and show stronger preference for more masculine men. The hypothesis further predicts that ceiling effects on preferences occurs among such women, leading to a smaller cycle shift effect. If our participants’ partner evaluations truly reflected their partners’ attractiveness, the relatively higher mean scores for partner PA found in our study imply that these women were paired with higher quality men. Thus, if our participants had relatively higher overall estrogen levels, it might have caused smaller cyclical variation in sexual desire for a partner. Future studies are required to examine how women’s average hormone levels affect cycle shift effects.
A fourth possibility is that mechanisms underlying pair-bond relationships led to different main effects of cycle phase depending on the target of sexual attraction. Pair-bonded relationships have been hypothesizes as a key aspect of human sexuality (e.g., Dixson 2009; Havlíček et al. 2015b; Emery Thompson and Muller 2016). Romantic love and sexual desire might be a part of mechanisms evolved to initiate and maintain pair-bond relationships with selected partners in order to increase offspring survival (Fisher 1998). Fisher (1998) hypothesized that romantic love plays a role of mate choice and leads individuals to focus their sexual desire towards a particular mate. Human females display extended sexuality (being sexually receptive or proceptive during nonfertile phases, see Gangestad and Thornhill 2008). Some researchers have argued that extended sexuality was decoupled from strict hormonal dependency (Havlíček et al. 2015b; Roney and Simmons 2016). In line with these arguments, the current study showed that the strength of women’s sexual desire throughout the cycle was consistently higher for their romantic partners than for other men. Pair-bonding may be an adaptive aspect of female sexual desire that is uncorrelated with cyclical changes in hormones.
Regarding emotional measures, the main cycle phase effect was found only for care-receiving and care-giving. Care-receiving and care-giving were higher in the menstrual phase, compared to other mid-cycle phases (Figure 1). Although all women initiated their diaries on the first day of their menstrual cycle, an order effect is unlikely because the plots of both care-receiving and giving showed a curvilinear relationship with the lowest scores in the peri-ovulatory and luteal phases. Order effects are also unlikely for extrapair sexual desire as it followed a reverse U shape. One possibility is that women seek more emotional connection during the menstrual phase when physical relationships with partners are less likely.
Methodological considerations
We found significant moderating effects of SIA attractiveness when we employed Haselton and Gangestad’s (2006) 2-phase coding scheme. However, follow-up analyses found no cycle phase effect when partner SIA scores were one SD above (those with relatively greater short-term attractiveness) or below the means (those with relatively greater long-term attractiveness). This suggests that the magnitude of the disparity between a partner’s investment attractiveness and sexual attractiveness may not be particularly influential in driving women’s extrapair desire.
When our 5-phase classification system was used, there was no evidence of moderation by SIA, although the main effect of cycle on extrapair sexual desire that was found in our initial analysis remained. Our sample size was larger than Haselton and Gangestad’s (2006, N = 24) which increased our power to detect an effect. Our 5-phase classification used LH tests to estimate ovulation which has a validity of between 0.8 and 0.9 (Gangestad et al. 2016). Haselton and Gangestad (2006) estimated ovulation by the backward counting method from a confirmed date of next menses, a method with an estimated validity of 0.66. This validity estimate drops to 0.64 when error associated with failure to detect anovulatory participants is added and is further compromised by the use of a shorter fertile window. The degree of estimation error can be substantial: In our sample, with the date of ovulation confirmed by LH surge, 45% of estimated ovulation days were misclassified by the backward counting method. One of the most evident differences between the analyses was the number of phases that were compared. An advantage of our 5-phase scheme is that all daily data is included in the analysis whereas in the binary scheme the bulk of data is discarded which, aside from being wasteful, raises doubts about the objective basis on which data are selected (Harris et al. 2014; Gangestad et al. 2016). It is important to note that SIA was created based on sexual and investment attractiveness which were measured on different variables than in Haselton and Gangestad’s original study, and this could contribute to inconsistent findings between our studies and the original. However, it is clear that results can vary markedly as a function of the classification system used to determine fertile and nonfertile phases.
On the basis of our data, we urge caution in the use of any technique that estimates ovulation on the basis of an assumed 28-day cycle. We found cycle lengths to vary between 24–40 days. With only 3 out of 34 participants experiencing a 28-day cycle, the forward counting methods is unlikely to accurately capture the date of ovulation. The backward counting method fares little better. The range of days intervening between LH surge and subsequent menses (6–21 days) was considerable. Our findings verify the argument of Gangestad et al. (2016) that the gold standard for future research is the use of daily measurement of estradiol and progesterone levels which can establish ovulation, in addition to their intrinsic value of examining the hormonal basis of cycle shift effects.
CONCLUSIONS
In closing, our work reveals a compelling need for further careful study of cycle effects on women’s sexual desire, paying due attention to objectivity and accuracy of methods for determining cycle phases. We found significant problems with backward counting which was commonly used in earlier cycle studies. Moreover, our results raise potential issues in the dual sexuality and commitment hypotheses, and they also suggest that further investigation of the recent spandrel hypothesis may be fruitful. Future studies might also examine the role of cycle-independent factors on women’s sexual desire.
A.C. died in February 2017, during the review process for this paper. The first and third authors would like to record their indebtedness to Anne, who committed her time and energy to this project even during the time that she was unwell. She will be fondly remembered as a warm, enthusiastic, and inspirational supervisor and colleague. The authors wish to thank Eric Cator for statistical advice and are grateful to 2 referees for their careful reading and constructive comments to improve the manuscript.
Data accessibility: Analyses reported in this article can be reproduced using the data provided by Shimoda et al. (2017).
REFERENCES
Author notes
R.S. is currently unaffiliated.
